Mga Batayang Estadistika
| Pemilik Institusional | 111 total, 111 long only, 0 short only, 0 long/short - change of -3.48% MRQ |
| Alokasi Portofolio Rata-rata | 0.2985 % - change of 82.46% MRQ |
| Saham Institusional (Jangka Panjang) | 6,255,245 (ex 13D/G) - change of -0.01MM shares -0.18% MRQ |
| Nilai Institusional (Jangka Panjang) | $ 670,005 USD ($1000) |
Kepemilikan Institusional dan Pemegang Saham
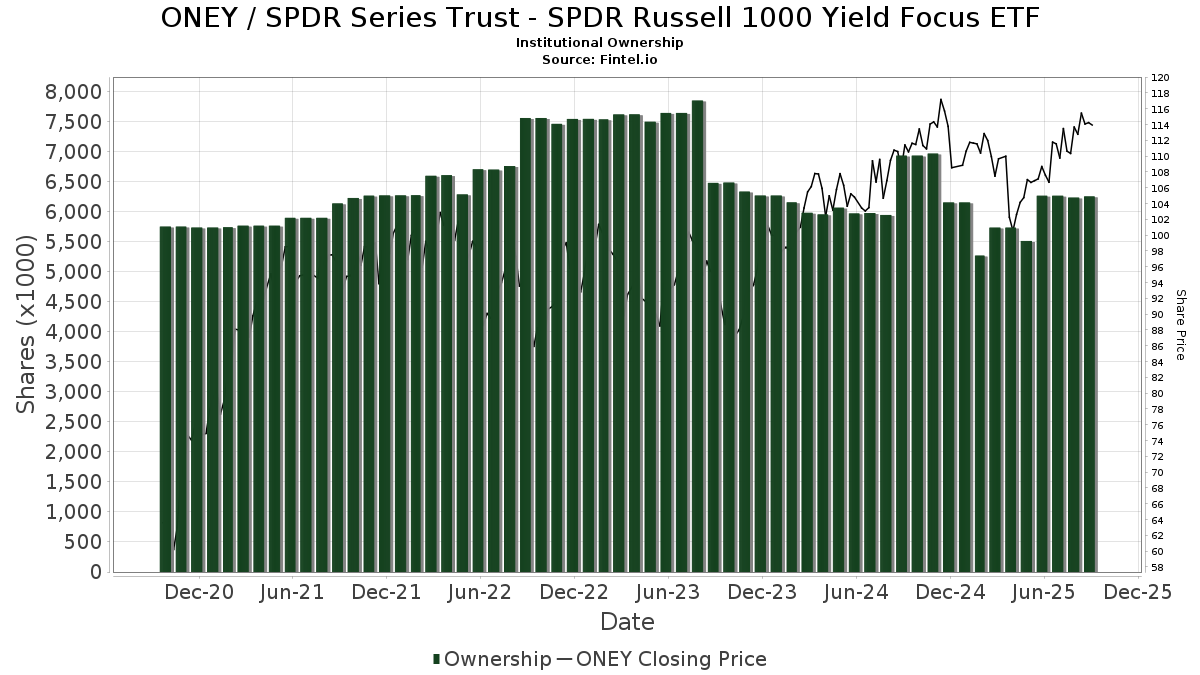
SPDR Series Trust - SPDR Russell 1000 Yield Focus ETF (US:ONEY) memiliki 111 pemilik institusional dan pemegang saham yang telah mengajukan formulir 13D/G atau 13F kepada Komisi Bursa Efek (Securities Exchange Commission/SEC). Lembaga-lembaga ini memegang total 6,255,245 saham. Pemegang saham terbesar meliputi Alaska Permanent Fund Corp, Ameriprise Financial Inc, LPL Financial LLC, Kestra Investment Management, LLC, Creative Planning, Raymond James Financial Inc, Mariner, LLC, Lebenthal Global Advisors, LLC, Cambridge Investment Research Advisors, Inc., and Northwestern Mutual Wealth Management Co .
Struktur kepemilikan institusional SPDR Series Trust - SPDR Russell 1000 Yield Focus ETF (ARCA:ONEY) menunjukkan posisi terkini di perusahaan oleh institusi dan dana, serta perubahan terbaru dalam ukuran posisi. Pemegang saham utama dapat mencakup investor individu, reksa dana, dana lindung nilai, atau institusi. Jadwal 13D menunjukkan bahwa investor memegang (atau pernah memegang) lebih dari 5% saham perusahaan dan bermaksud (atau pernah bermaksud) untuk secara aktif mengejar perubahan strategi bisnis. Jadwal 13G menunjukkan investasi pasif lebih dari 5%.
The share price as of September 5, 2025 is 115.26 / share. Previously, on September 6, 2024, the share price was 108.76 / share. This represents an increase of 5.97% over that period.
Skor Sentimen Dana
Skor Sentimen Dana (sebelumnya dikenal sebagai Skor Akumulasi Kepemilikan) menemukan saham-saham yang paling banyak dibeli oleh dana. Ini adalah hasil dari model kuantitatif multi-faktor yang canggih yang mengidentifikasi perusahaan dengan tingkat akumulasi institusional tertinggi. Model penilaian menggunakan kombinasi dari total peningkatan pemilik yang diungkapkan, perubahan dalam alokasi portofolio pada pemilik tersebut, dan metrik lainnya. Angka berkisar dari 0 hingga 100, dengan angka yang lebih tinggi menunjukkan tingkat akumulasi yang lebih tinggi dibandingkan dengan perusahaan sejenisnya, dan 50 adalah rata-ratanya.
Frekuensi Pembaruan: Setiap Hari
Lihat Ownership Explorer, yang menyediakan daftar perusahaan dengan peringkat tertinggi.
Rasio Put/Call Institusional
Selain melaporkan isu ekuitas dan utang standar, institusi dengan aset di bawah manajemen lebih dari 100 juta dolar AS juga harus mengungkapkan kepemilikan opsi put dan call mereka. Karena opsi put umumnya menunjukkan sentimen negatif, dan opsi call menunjukkan sentimen positif, kita dapat mengetahui sentimen institusional secara keseluruhan dengan memplot rasio put terhadap call. Grafik di sebelah kanan memplot rasio put/call historis untuk instrumen ini.
Menggunakan Rasio Put/Call sebagai indikator sentimen investor mengatasi salah satu kekurangan utama dari penggunaan total kepemilikan institusional, yaitu sejumlah besar aset yang dikelola diinvestasikan secara pasif untuk melacak indeks. Dana yang dikelola secara pasif biasanya tidak membeli opsi, sehingga indikator rasio put/call lebih akurat dalam melacak sentimen dana yang dikelola secara aktif.
Pengajuan 13F dan NPORT
Detail pada pengajuan 13F tersedia gratis. Detail pada pengajuan NP memerlukan keanggotaan premium. Baris berwarna hijau menunjukkan posisi baru. Baris berwarna merah menunjukkan posisi yang sudah ditutup. Klik tautan ini ikon untuk melihat riwayat transaksi selengkapnya.
Tingkatkan
untuk membuka data premium dan mengekspor ke Excel ![]() .
.
| Tanggal File | Sumber | Investor | Ketik | Presyo ng Avg (Silangan) |
Saham | Δ Saham (%) |
Dilaporkan Nilai ($1000) |
Nilai Δ (%) |
Alokasi Port (%) |
|
|---|---|---|---|---|---|---|---|---|---|---|
| 2025-07-21 | 13F | DHJJ Financial Advisors, Ltd. | 93 | 0.00 | 10 | 0.00 | ||||
| 2025-08-06 | 13F | Golden State Wealth Management, LLC | 15 | 0.00 | 2 | 0.00 | ||||
| 2025-07-02 | 13F | Central Pacific Bank - Trust Division | 17 | 0.00 | 2 | 0.00 | ||||
| 2025-08-15 | 13F | Morgan Stanley | 2,788 | 12.06 | 302 | 11.07 | ||||
| 2025-08-05 | 13F | Strategic Financial Concepts, LLC | 7,388 | -22.70 | 800 | -23.39 | ||||
| 2025-08-11 | 13F | Cornerstone Planning Group LLC | 2,772 | 5.48 | 306 | 13.75 | ||||
| 2025-07-15 | 13F | Financial Partners Group, Inc | 2,629 | -7.72 | 285 | -8.68 | ||||
| 2025-07-30 | 13F | Insight Advisors, LLC/ PA | 4,178 | -5.71 | 452 | -6.61 | ||||
| 2025-08-06 | 13F | Commonwealth Equity Services, Llc | 16,994 | 1.55 | 2 | 0.00 | ||||
| 2025-08-07 | 13F | Winthrop Capital Management, LLC | 225 | -4.66 | 0 | |||||
| 2025-08-08 | 13F | Larson Financial Group LLC | 211 | -30.82 | 23 | -33.33 | ||||
| 2025-08-12 | 13F | Proequities, Inc. | 0 | 0 | ||||||
| 2025-07-31 | 13F | Cambridge Investment Research Advisors, Inc. | 65,856 | 3.55 | 7 | 16.67 | ||||
| 2025-08-01 | 13F | Envestnet Asset Management Inc | 57,776 | 14.57 | 6,255 | 13.56 | ||||
| 2025-08-12 | 13F | Bokf, Na | 0 | -100.00 | 0 | |||||
| 2025-07-29 | 13F | Private Trust Co Na | 160 | 0.00 | 17 | 0.00 | ||||
| 2025-08-14 | 13F | Integrated Wealth Concepts LLC | 4,125 | -3.80 | 447 | -4.70 | ||||
| 2025-08-12 | 13F | Indie Asset Partners, LLC | 0 | -100.00 | 0 | |||||
| 2025-08-05 | 13F | GPS Wealth Strategies Group, LLC | 268 | 0.00 | 29 | 0.00 | ||||
| 2025-08-12 | 13F | Global Retirement Partners, LLC | 10,680 | 7.37 | 1,156 | 6.84 | ||||
| 2025-07-07 | 13F | Nova Wealth Management, Inc. | 275 | 0.00 | 30 | -3.33 | ||||
| 2025-07-31 | 13F | Glass Jacobson Investment Advisors llc | 1,207 | 1.60 | 131 | 0.78 | ||||
| 2025-08-12 | 13F | Gladstone Institutional Advisory LLC | 3,549 | 3.11 | 384 | 2.13 | ||||
| 2025-08-13 | 13F | Mayfair Advisory Group, LLC | 2,048 | -66.83 | 226 | -66.47 | ||||
| 2025-04-25 | 13F | Sovran Advisors, LLC | 0 | -100.00 | 0 | |||||
| 2025-08-13 | 13F | Financial Freedom, LLC | 2,188 | 0.32 | 237 | -0.84 | ||||
| 2025-08-13 | 13F | Northwestern Mutual Wealth Management Co | 58,027 | -2.07 | 6,282 | -2.94 | ||||
| 2025-07-28 | 13F | RFG Advisory, LLC | 0 | -100.00 | 0 | |||||
| 2025-08-14 | 13F | Ameriprise Financial Inc | 1,270,103 | 8.92 | 137,039 | 7.54 | ||||
| 2025-08-14 | 13F | Smartleaf Asset Management LLC | 0 | -100.00 | 0 | |||||
| 2025-08-26 | 13F/A | Thrivent Financial For Lutherans | 0 | -100.00 | 0 | -100.00 | ||||
| 2025-05-15 | 13F | Hrt Financial Lp | 0 | -100.00 | 0 | |||||
| 2025-08-15 | 13F | Kestra Advisory Services, LLC | 2,204 | 11.76 | 239 | 10.70 | ||||
| 2025-08-05 | 13F | Bank of New York Mellon Corp | 2,903 | 314 | ||||||
| 2025-08-13 | 13F | Continuum Advisory, LLC | 0 | -100.00 | 0 | |||||
| 2025-07-15 | 13F | World Equity Group, Inc. | 3,413 | 2.93 | 370 | 1.93 | ||||
| 2025-04-14 | 13F | RDA Financial Network | 0 | -100.00 | 0 | |||||
| 2025-07-22 | 13F | IVC Wealth Advisors LLC | 2,900 | 0.00 | 314 | -0.95 | ||||
| 2025-07-25 | 13F | Atria Wealth Solutions, Inc. | 2,001 | 217 | ||||||
| 2025-07-28 | 13F | Harbour Investments, Inc. | 108 | -91.22 | 12 | -91.79 | ||||
| 2025-08-12 | 13F | Financial Advocates Investment Management | 5,903 | -2.88 | 639 | -3.62 | ||||
| 2025-08-14 | 13F | Lebenthal Global Advisors, LLC | 113,429 | -0.99 | 12,281 | -1.86 | ||||
| 2025-08-14 | 13F | Main Street Financial Solutions, LLC | 2,110 | 0.00 | 228 | -0.87 | ||||
| 2025-08-08 | 13F | Collaborative Wealth Managment Inc. | 24,132 | 7.35 | 2,613 | 6.40 | ||||
| 2025-08-08 | 13F | Avantax Advisory Services, Inc. | 8,191 | -1.55 | 887 | -2.42 | ||||
| 2025-07-21 | 13F | Precedent Wealth Partners, Llc | 10,395 | -16.43 | 1,125 | -17.16 | ||||
| 2025-07-23 | 13F | Valmark Advisers, Inc. | 2,424 | 7.21 | 262 | 6.50 | ||||
| 2025-07-29 | 13F | Portland Financial Advisors Inc | 2,775 | -15.40 | 300 | -16.20 | ||||
| 2025-08-12 | 13F | Quadcap Wealth Management, LLC | 2,019 | -12.10 | 219 | -12.80 | ||||
| 2025-08-07 | 13F | Cascade Financial Partners, LLC | 2,399 | -29.92 | 260 | -30.56 | ||||
| 2025-08-08 | 13F | Pnc Financial Services Group, Inc. | 29 | 0.00 | 3 | 0.00 | ||||
| 2025-08-15 | 13F | Equitable Holdings, Inc. | 31,959 | 17.43 | 3,460 | 16.42 | ||||
| 2025-07-28 | 13F | Copia Wealth Management | 114 | 0.00 | 12 | 0.00 | ||||
| 2025-08-14 | 13F | Goldman Sachs Group Inc | 17,877 | 1,935 | ||||||
| 2025-07-28 | 13F | BRYN MAWR TRUST Co | 25 | 0.00 | 3 | 0.00 | ||||
| 2025-08-11 | 13F | Western Wealth Management, LLC | 2,804 | 0.00 | 304 | -0.98 | ||||
| 2025-08-12 | 13F | Steward Partners Investment Advisory, Llc | 53,032 | 4.48 | 5,742 | 3.55 | ||||
| 2025-07-21 | 13F | Ameriflex Group, Inc. | 0 | -100.00 | 0 | |||||
| 2025-08-14 | 13F | CoreCap Advisors, LLC | 0 | -100.00 | 0 | |||||
| 2025-08-04 | 13F | Horizon Wealth Management, LLC | 9,768 | -18.29 | 1,058 | -19.00 | ||||
| 2025-04-21 | 13F | Nelson, Van Denburg & Campbell Wealth Management Group, LLC | 0 | -100.00 | 0 | |||||
| 2025-07-31 | 13F | Leavell Investment Management, Inc. | 17,144 | 0.85 | 1,856 | 0.00 | ||||
| 2025-08-14 | 13F | Bank Of America Corp /de/ | 24,078 | -0.18 | 2,607 | -1.06 | ||||
| 2025-08-18 | 13F/A | Kestra Investment Management, LLC | 252,445 | -40.05 | 27,332 | -40.59 | ||||
| 2025-08-18 | 13F | Geneos Wealth Management Inc. | 600 | 0.00 | 65 | -1.54 | ||||
| 2025-07-18 | 13F | Truist Financial Corp | 2,887 | -40.03 | 313 | -40.57 | ||||
| 2025-08-14 | 13F | UBS Group AG | 1,351 | 16,787.50 | 146 | |||||
| 2025-09-04 | 13F/A | Advisor Group Holdings, Inc. | 16,111 | 5.91 | 1,744 | 5.00 | ||||
| 2025-07-17 | 13F | Fifth Third Securities, Inc. | 10,493 | 17.08 | 1,136 | 16.16 | ||||
| 2025-05-14 | 13F | Triad Wealth Partners, LLC | 0 | -100.00 | 0 | |||||
| 2025-07-15 | 13F | Family Investment Center, Inc. | 36,674 | 2.73 | 3,971 | 1.82 | ||||
| 2025-07-16 | 13F | Essex Financial Services, Inc. | 7,241 | -3.79 | 784 | -4.74 | ||||
| 2025-08-12 | 13F | Jpmorgan Chase & Co | 368 | -50.47 | 40 | -51.85 | ||||
| 2025-05-07 | 13F | Vista Private Wealth Partners. LLC | 0 | -100.00 | 0 | |||||
| 2025-07-31 | 13F | CAP Partners, LLC | 2,289 | -0.56 | 248 | -1.59 | ||||
| 2025-08-14 | 13F | Mariner, LLC | 188,405 | 8.79 | 20,398 | 7.83 | ||||
| 2025-07-07 | 13F | Capital Asset Advisory Services LLC | 0 | -100.00 | 0 | -100.00 | ||||
| 2025-07-29 | 13F | Lutz Financial Services LLC | 2,295 | -31.33 | 248 | -32.05 | ||||
| 2025-08-12 | 13F | MAI Capital Management | 19 | 0.00 | 2 | 0.00 | ||||
| 2025-08-13 | 13F | Jones Financial Companies Lllp | 9,502 | 28.60 | 1,024 | 28.04 | ||||
| 2025-08-13 | 13F | Capital Analysts, Inc. | 10,813 | 25.62 | 1 | |||||
| 2025-07-02 | 13F | Crumly & Associates Inc. | 13,723 | 0.00 | 1,486 | -0.93 | ||||
| 2025-08-14 | 13F | GWM Advisors LLC | 200 | 0.00 | 22 | 0.00 | ||||
| 2025-08-13 | 13F | Virtue Capital Management, LLC | 0 | -100.00 | 0 | |||||
| 2025-08-15 | 13F | Tower Research Capital LLC (TRC) | 2,728 | 34.65 | 295 | 33.48 | ||||
| 2025-07-25 | 13F | Cwm, Llc | 218 | 0 | ||||||
| 2025-04-30 | 13F | Stratos Wealth Partners, LTD. | 0 | -100.00 | 0 | |||||
| 2025-07-09 | 13F | Dynamic Advisor Solutions LLC | 1,901 | -0.37 | 206 | -1.44 | ||||
| 2025-08-08 | 13F | Kingsview Wealth Management, LLC | 36,904 | 5.35 | 3,995 | 4.42 | ||||
| 2025-08-11 | 13F | Principal Securities, Inc. | 413 | 11.02 | 45 | 10.00 | ||||
| 2025-07-11 | 13F | Meriwether Wealth & Planning, LLC | 3,057 | -0.36 | 331 | -1.49 | ||||
| 2025-07-17 | 13F | Venture Visionary Partners LLC | 8,696 | 0.00 | 941 | -0.84 | ||||
| 2025-07-11 | 13F | Farther Finance Advisors, LLC | 55 | 0.00 | 6 | -16.67 | ||||
| 2025-07-29 | 13F | Rodgers & Associates, LTD | 2,061 | 0.00 | 223 | -0.89 | ||||
| 2025-08-14 | 13F | Alaska Permanent Fund Corp | 2,420,919 | 0.00 | 266,180 | 5.58 | ||||
| 2025-08-04 | 13F | Assetmark, Inc | 82 | 9 | ||||||
| 2025-08-13 | 13F | Ally Invest Advisors Inc. | 2,313 | -7.33 | 250 | -8.09 | ||||
| 2025-07-25 | 13F | Concurrent Investment Advisors, LLC | 1,851 | -41.35 | 200 | -41.86 | ||||
| 2025-07-30 | 13F | Bogart Wealth, LLC | 1,104 | 0.00 | 120 | -0.83 | ||||
| 2025-08-12 | 13F | Cornerstone Wealth Management, LLC | 2,717 | 12.09 | 294 | 11.36 | ||||
| 2025-08-13 | 13F | Congress Wealth Management LLC / DE / | 0 | -100.00 | 0 | |||||
| 2025-07-23 | 13F | Prime Capital Investment Advisors, LLC | 2,603 | 0.00 | 282 | -1.06 | ||||
| 2025-08-14 | 13F | Mml Investors Services, Llc | 2,659 | 7.09 | 0 | |||||
| 2025-07-16 | 13F | Brown, Lisle/cummings, Inc. | 6,805 | 0.00 | 737 | -0.94 | ||||
| 2025-08-13 | 13F | Holos Integrated Wealth LLC | 57,730 | 0.61 | 6,382 | 1.82 | ||||
| 2025-08-06 | 13F | Bonfire Financial | 14,811 | -1.30 | 1,604 | -2.20 | ||||
| 2025-07-09 | 13F | Pallas Capital Advisors LLC | 37,319 | 3.69 | 4,040 | 2.77 | ||||
| 2025-08-14 | 13F | Jane Street Group, Llc | 3,002 | 21.15 | 325 | 20.37 | ||||
| 2025-08-14 | 13F | CoreFirst Bank & Trust | 11,058 | 2.45 | 1,197 | 1.53 | ||||
| 2025-07-15 | 13F | FMA Wealth Management, LLC | 37,594 | 2.34 | 4,070 | -1.48 | ||||
| 2025-07-17 | 13F | XML Financial, LLC | 2,535 | 12.72 | 274 | 11.84 | ||||
| 2025-08-19 | 13F | Newbridge Financial Services Group, Inc. | 635 | -44.78 | 69 | -45.60 | ||||
| 2025-08-11 | 13F | Private Advisor Group, LLC | 44,561 | -5.70 | 4,825 | -6.55 | ||||
| 2025-04-17 | 13F | Lockerman Financial Group, Inc. | 0 | -100.00 | 0 | -100.00 | ||||
| 2025-07-29 | 13F | Angeles Wealth Management, Llc | 2,616 | 0.00 | 283 | -0.70 | ||||
| 2025-07-28 | 13F | Axxcess Wealth Management, Llc | 0 | -100.00 | 0 | |||||
| 2025-08-08 | 13F | Thoroughbred Financial Services, Llc | 4,260 | 68.51 | 0 | |||||
| 2025-07-10 | 13F | Wealth Enhancement Advisory Services, Llc | 2,712 | -4.00 | 303 | -1.62 | ||||
| 2025-07-29 | 13F | Creekside Partners | 5,661 | 0.86 | 613 | -0.16 | ||||
| 2025-08-14 | 13F | Wells Fargo & Company/mn | 2,652 | 5.66 | 287 | 4.74 | ||||
| 2025-08-14 | 13F | IHT Wealth Management, LLC | 16,798 | -9.82 | 1,819 | -10.62 | ||||
| 2025-05-08 | 13F | We Are One Seven, LLC | 0 | -100.00 | 0 | |||||
| 2025-07-15 | 13F | McAdam, LLC | 2,765 | 1.02 | 299 | 0.34 | ||||
| 2025-08-14 | 13F | Royal Bank Of Canada | 1,312 | 4.21 | 142 | 2.90 | ||||
| 2025-08-05 | 13F | Fourth Dimension Wealth, LLC | 46 | 5 | ||||||
| 2025-08-14 | 13F | Raymond James Financial Inc | 191,520 | -6.02 | 20,735 | -6.86 | ||||
| 2025-05-15 | 13F | Baird Financial Group, Inc. | 0 | -100.00 | 0 | |||||
| 2025-08-14 | 13F | Susquehanna International Group, Llp | 13,318 | 1,442 | ||||||
| 2025-08-08 | 13F | Creative Planning | 251,328 | -1.17 | 27,211 | -2.05 | ||||
| 2025-08-12 | 13F | LPL Financial LLC | 615,970 | 1.20 | 66,689 | 0.30 | ||||
| 2025-08-14 | 13F | Fmr Llc | 233 | 72.59 | 25 | 78.57 | ||||
| 2025-07-14 | 13F | AdvisorNet Financial, Inc | 61 | 0.00 | 7 | 0.00 | ||||
| 2025-08-08 | 13F | Cetera Investment Advisers | 24,528 | -4.39 | 2,656 | -5.25 | ||||
| 2025-08-11 | 13F | Aptus Capital Advisors, LLC | 10 | 0.00 | 1 | 0.00 |