Mga Batayang Estadistika
| Pemilik Institusional | 139 total, 139 long only, 0 short only, 0 long/short - change of 7.75% MRQ |
| Alokasi Portofolio Rata-rata | 0.0535 % - change of -1.70% MRQ |
| Saham Institusional (Jangka Panjang) | 7,112,435 (ex 13D/G) - change of -0.39MM shares -5.18% MRQ |
| Nilai Institusional (Jangka Panjang) | $ 364,583 USD ($1000) |
Kepemilikan Institusional dan Pemegang Saham
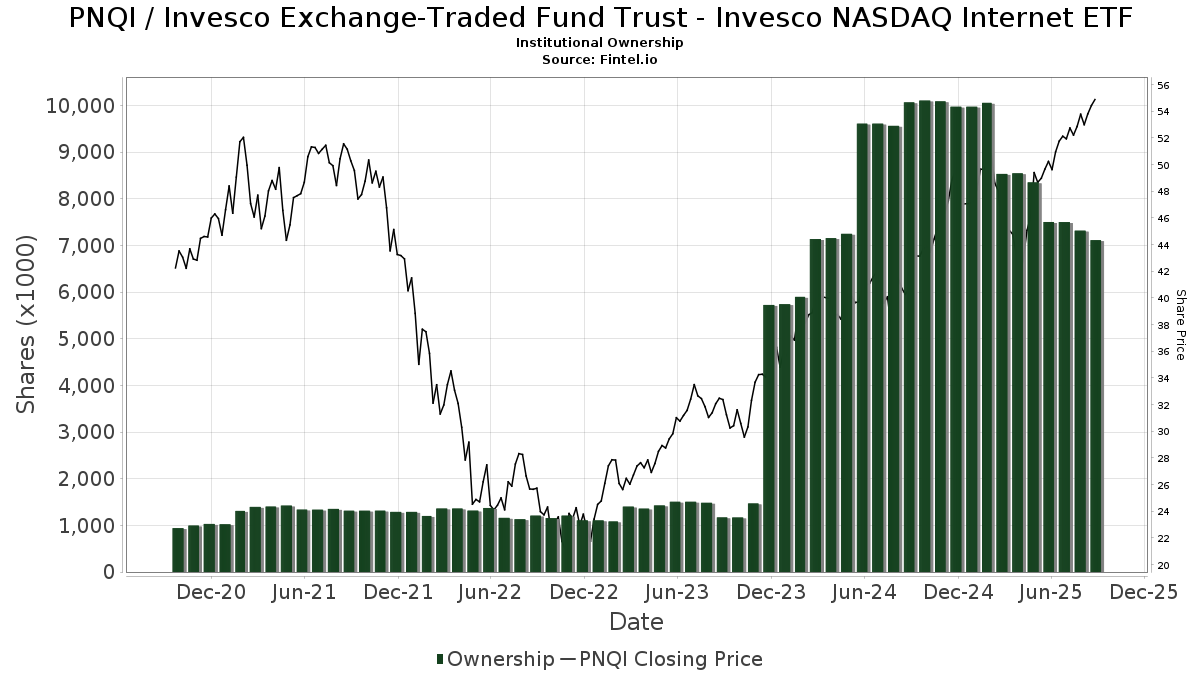
Invesco Exchange-Traded Fund Trust - Invesco NASDAQ Internet ETF (US:PNQI) memiliki 139 pemilik institusional dan pemegang saham yang telah mengajukan formulir 13D/G atau 13F kepada Komisi Bursa Efek (Securities Exchange Commission/SEC). Lembaga-lembaga ini memegang total 7,112,435 saham. Pemegang saham terbesar meliputi Fisher Asset Management, LLC, UBS Group AG, HighTower Advisors, LLC, Morgan Stanley, LPL Financial LLC, Wells Fargo & Company/mn, Bank Of America Corp /de/, Royal Bank Of Canada, Goldman Sachs Group Inc, and Raymond James Financial Inc .
Struktur kepemilikan institusional Invesco Exchange-Traded Fund Trust - Invesco NASDAQ Internet ETF (NasdaqGM:PNQI) menunjukkan posisi terkini di perusahaan oleh institusi dan dana, serta perubahan terbaru dalam ukuran posisi. Pemegang saham utama dapat mencakup investor individu, reksa dana, dana lindung nilai, atau institusi. Jadwal 13D menunjukkan bahwa investor memegang (atau pernah memegang) lebih dari 5% saham perusahaan dan bermaksud (atau pernah bermaksud) untuk secara aktif mengejar perubahan strategi bisnis. Jadwal 13G menunjukkan investasi pasif lebih dari 5%.
The share price as of September 4, 2025 is 54.87 / share. Previously, on September 5, 2024, the share price was 40.44 / share. This represents an increase of 35.68% over that period.
Skor Sentimen Dana
Skor Sentimen Dana (sebelumnya dikenal sebagai Skor Akumulasi Kepemilikan) menemukan saham-saham yang paling banyak dibeli oleh dana. Ini adalah hasil dari model kuantitatif multi-faktor yang canggih yang mengidentifikasi perusahaan dengan tingkat akumulasi institusional tertinggi. Model penilaian menggunakan kombinasi dari total peningkatan pemilik yang diungkapkan, perubahan dalam alokasi portofolio pada pemilik tersebut, dan metrik lainnya. Angka berkisar dari 0 hingga 100, dengan angka yang lebih tinggi menunjukkan tingkat akumulasi yang lebih tinggi dibandingkan dengan perusahaan sejenisnya, dan 50 adalah rata-ratanya.
Frekuensi Pembaruan: Setiap Hari
Lihat Ownership Explorer, yang menyediakan daftar perusahaan dengan peringkat tertinggi.
Rasio Put/Call Institusional
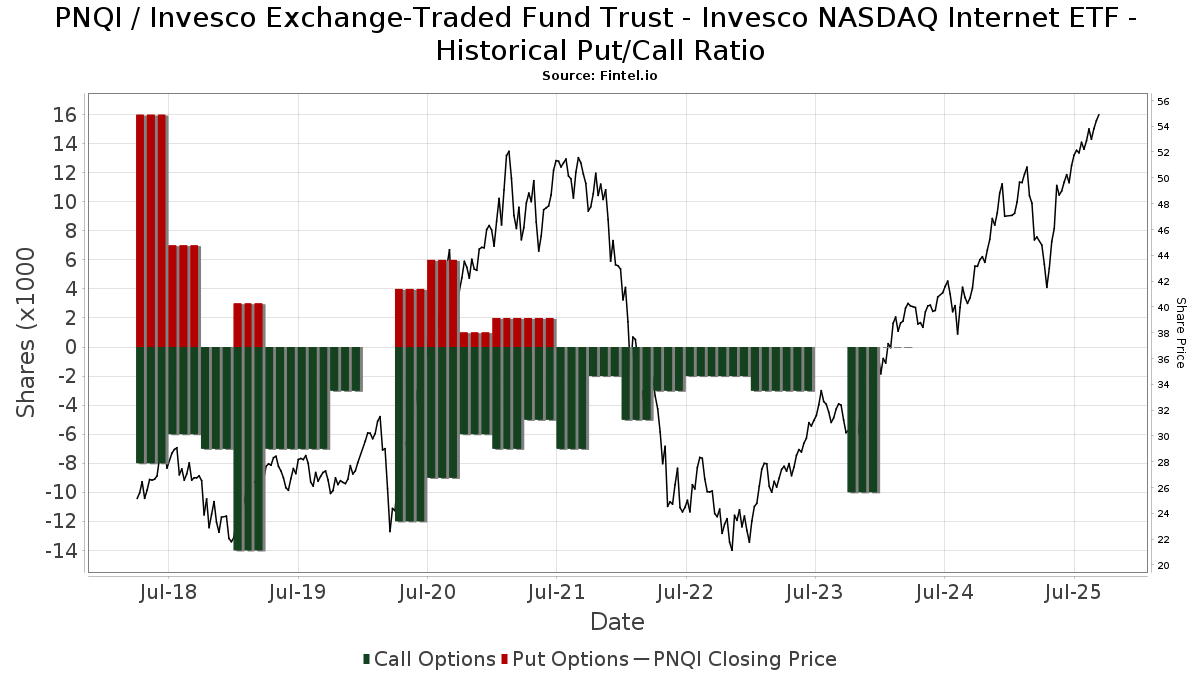
Selain melaporkan isu ekuitas dan utang standar, institusi dengan aset di bawah manajemen lebih dari 100 juta dolar AS juga harus mengungkapkan kepemilikan opsi put dan call mereka. Karena opsi put umumnya menunjukkan sentimen negatif, dan opsi call menunjukkan sentimen positif, kita dapat mengetahui sentimen institusional secara keseluruhan dengan memplot rasio put terhadap call. Grafik di sebelah kanan memplot rasio put/call historis untuk instrumen ini.
Menggunakan Rasio Put/Call sebagai indikator sentimen investor mengatasi salah satu kekurangan utama dari penggunaan total kepemilikan institusional, yaitu sejumlah besar aset yang dikelola diinvestasikan secara pasif untuk melacak indeks. Dana yang dikelola secara pasif biasanya tidak membeli opsi, sehingga indikator rasio put/call lebih akurat dalam melacak sentimen dana yang dikelola secara aktif.
Pengajuan 13F dan NPORT
Detail pada pengajuan 13F tersedia gratis. Detail pada pengajuan NP memerlukan keanggotaan premium. Baris berwarna hijau menunjukkan posisi baru. Baris berwarna merah menunjukkan posisi yang sudah ditutup. Klik tautan ini ikon untuk melihat riwayat transaksi selengkapnya.
Tingkatkan
untuk membuka data premium dan mengekspor ke Excel ![]() .
.
| Tanggal File | Sumber | Investor | Ketik | Presyo ng Avg (Silangan) |
Saham | Δ Saham (%) |
Dilaporkan Nilai ($1000) |
Nilai Δ (%) |
Alokasi Port (%) |
|
|---|---|---|---|---|---|---|---|---|---|---|
| 2025-08-12 | 13F | Edmond De Rothschild Holding S.a. | 650 | 0.00 | 34 | 17.86 | ||||
| 2025-08-08 | 13F | Cetera Investment Advisers | 21,475 | -1.84 | 1,121 | 16.17 | ||||
| 2025-07-10 | 13F | Wealth Enhancement Advisory Services, Llc | 14,773 | 9.02 | 771 | 28.93 | ||||
| 2025-07-24 | 13F | WMG Financial Advisors, LLC | 5,798 | 5.92 | 303 | 25.31 | ||||
| 2025-08-11 | 13F | Aptus Capital Advisors, LLC | 667 | 0.00 | 35 | 17.24 | ||||
| 2025-07-30 | 13F | Pacific Sun Financial Corp | 48,900 | -0.10 | 2,553 | 18.19 | ||||
| 2025-08-14 | 13F | Comerica Bank | 15,224 | -0.83 | 795 | 17.28 | ||||
| 2025-08-14 | 13F | Susquehanna International Group, Llp | 11,676 | 122.78 | 610 | 163.64 | ||||
| 2025-04-29 | 13F | Lee Danner & Bass Inc | 0 | -100.00 | 0 | -100.00 | ||||
| 2025-05-12 | 13F | Sandy Spring Bank | 1,500 | 0.00 | 66 | -5.71 | ||||
| 2025-07-18 | 13F | Truist Financial Corp | 72,590 | -1.41 | 3,790 | 16.62 | ||||
| 2025-08-18 | 13F | Goodman Advisory Group, LLC | 0 | -100.00 | 0 | |||||
| 2025-07-22 | 13F | Gsa Capital Partners Llp | 4,034 | 0 | ||||||
| 2025-08-05 | 13F | NewSquare Capital LLC | 75 | 4 | ||||||
| 2025-07-17 | 13F | Robbins Farley Llc | 3,593 | -13.73 | 188 | 2.19 | ||||
| 2025-08-11 | 13F | HighTower Advisors, LLC | 651,649 | 0.15 | 34,023 | 18.49 | ||||
| 2025-08-14 | 13F | Jane Street Group, Llc | 0 | -100.00 | 0 | |||||
| 2025-07-10 | 13F | Global Financial Private Client, LLC | 6,690 | 0.00 | 349 | 18.31 | ||||
| 2025-08-12 | 13F | O'shaughnessy Asset Management, Llc | 821 | 0.00 | 43 | 16.67 | ||||
| 2025-08-05 | 13F | Westside Investment Management, Inc. | 1,140 | 0.00 | 60 | 18.00 | ||||
| 2025-08-06 | 13F | Texas Yale Capital Corp. | 25,150 | 0.00 | 1,313 | 18.39 | ||||
| 2025-07-25 | 13F | Cwm, Llc | 246 | 95.24 | 0 | |||||
| 2025-07-30 | 13F | Evermay Wealth Management Llc | 0 | -100.00 | 0 | |||||
| 2025-08-11 | 13F | Private Advisor Group, LLC | 33,579 | 0.35 | 1,753 | 18.77 | ||||
| 2025-08-13 | 13F | Colonial Trust Co / SC | 4,401 | 3.41 | 230 | 22.46 | ||||
| 2025-08-14 | 13F | Qube Research & Technologies Ltd | 130 | 0.00 | 7 | 20.00 | ||||
| 2025-08-14 | 13F | Wiley Bros.-aintree Capital, Llc | 3,947 | 205 | ||||||
| 2025-08-12 | 13F | Steward Partners Investment Advisory, Llc | 1,470 | 0.00 | 77 | 18.75 | ||||
| 2025-07-16 | 13F | Beaumont Financial Advisors, LLC | 4,000 | 209 | ||||||
| 2025-08-12 | 13F | LPL Financial LLC | 415,174 | -10.61 | 21,676 | 5.76 | ||||
| 2025-08-14 | 13F | Goldman Sachs Group Inc | 230,073 | 0.00 | 12,012 | 18.31 | ||||
| 2025-07-18 | 13F | SOA Wealth Advisors, LLC. | 160 | 0.00 | 8 | 14.29 | ||||
| 2025-08-14 | 13F | Boston Private Wealth Llc | 0 | -100.00 | 0 | |||||
| 2025-08-15 | 13F | Kestra Advisory Services, LLC | 4,504 | 235 | ||||||
| 2025-08-14 | 13F | Sunbelt Securities, Inc. | 1,100 | 0.00 | 51 | 6.25 | ||||
| 2025-07-16 | 13F | Meridian Investment Counsel Inc. | 4,165 | 217 | ||||||
| 2025-08-13 | 13F | GeoWealth Management, LLC | 66,545 | -31.04 | 3,474 | -18.41 | ||||
| 2025-07-11 | 13F | Farther Finance Advisors, LLC | 410 | 0.00 | 21 | 16.67 | ||||
| 2025-07-30 | 13F | Whittier Trust Co | 155 | 0.00 | 8 | 33.33 | ||||
| 2025-04-14 | 13F | Pallas Capital Advisors LLC | 0 | -100.00 | 0 | |||||
| 2025-08-12 | 13F | Proequities, Inc. | 0 | 0 | ||||||
| 2025-08-07 | 13F | Hennion & Walsh Asset Management, Inc. | 10,110 | -0.88 | 528 | 17.11 | ||||
| 2025-07-16 | 13F | Minichmacgregor Wealth Management, Llc | 7,410 | -5.99 | 387 | 11.24 | ||||
| 2025-08-11 | 13F | Wealthspire Advisors, LLC | 7,680 | 0.00 | 401 | 18.34 | ||||
| 2025-07-14 | 13F | Abound Wealth Management | 92 | 0.00 | 5 | 0.00 | ||||
| 2025-07-30 | 13F | Onyx Bridge Wealth Group LLC | 9,915 | -23.35 | 518 | -9.30 | ||||
| 2025-08-13 | 13F | Financial Freedom, LLC | 1,100 | 0.00 | 57 | 18.75 | ||||
| 2025-07-22 | 13F | Merit Financial Group, LLC | 22,559 | -1.21 | 1,178 | 16.88 | ||||
| 2025-08-12 | 13F | J.w. Cole Advisors, Inc. | 15,975 | -6.95 | 834 | 10.17 | ||||
| 2025-05-01 | 13F | Grant/GrossMendelsohn, LLC | 0 | -100.00 | 0 | |||||
| 2025-08-06 | 13F | Commonwealth Equity Services, Llc | 29,660 | -2.11 | 2 | 0.00 | ||||
| 2025-07-21 | 13F | Ameritas Advisory Services, LLC | 651 | 34 | ||||||
| 2025-07-24 | 13F | Blair William & Co/il | 10,045 | 0.00 | 524 | 18.28 | ||||
| 2025-08-11 | 13F | Principal Securities, Inc. | 634 | 10.45 | 33 | 26.92 | ||||
| 2025-08-14 | 13F | Fmr Llc | 20,496 | 26.65 | 1,070 | 49.86 | ||||
| 2025-08-13 | 13F | Northwestern Mutual Wealth Management Co | 6,259 | -6.82 | 327 | 10.14 | ||||
| 2025-04-10 | 13F | TruWealth Advisors, LLC | 0 | -100.00 | 0 | -100.00 | ||||
| 2025-07-30 | 13F | Schnieders Capital Management Llc | 7,660 | 0.00 | 400 | 18.05 | ||||
| 2025-04-01 | 13F | Massmutual Trust Co Fsb/adv | 0 | -100.00 | 0 | |||||
| 2025-08-06 | 13F | Prospera Financial Services Inc | 8,626 | -5.63 | 450 | 11.66 | ||||
| 2025-08-08 | 13F | Creative Planning | 11,485 | 1.19 | 600 | 19.80 | ||||
| 2025-08-15 | 13F | Tower Research Capital LLC (TRC) | 8,900 | 4.72 | 465 | 23.73 | ||||
| 2025-05-14 | 13F | Barometer Capital Management Inc. | 0 | -100.00 | 0 | |||||
| 2025-07-15 | 13F | Santori & Peters, Inc. | 40,844 | 0.00 | 2,132 | 18.31 | ||||
| 2025-08-14 | 13F | Wells Fargo & Company/mn | 239,900 | -0.97 | 12,525 | 17.17 | ||||
| 2025-08-14 | 13F | GWM Advisors LLC | 5,920 | 178.59 | 309 | 232.26 | ||||
| 2025-07-21 | 13F | Mirae Asset Global Investments Co., Ltd. | 1,283 | 0.00 | 67 | 17.86 | ||||
| 2025-09-04 | 13F/A | Advisor Group Holdings, Inc. | 79,051 | 18.21 | 4,127 | 39.85 | ||||
| 2025-07-31 | 13F | Cambridge Investment Research Advisors, Inc. | 35,033 | -5.88 | 2 | 0.00 | ||||
| 2025-08-14 | 13F | Old Mission Capital Llc | 6,633 | 346 | ||||||
| 2025-08-12 | 13F | FourThought Financial Partners, LLC | 22,464 | 0.02 | 1,173 | 18.26 | ||||
| 2025-08-13 | 13F | Fisher Asset Management, LLC | 1,830,206 | -3.77 | 95,555 | 13.85 | ||||
| 2025-05-07 | 13F | Prudent Investors Network | 0 | -100.00 | 0 | |||||
| 2025-08-14 | 13F | Mpwm Advisory Solutions, Llc | 230 | 15.00 | 12 | 50.00 | ||||
| 2025-08-05 | 13F | Wellington Shields Capital Management, LLC | 450 | 23 | ||||||
| 2025-07-18 | 13F | PFG Investments, LLC | 7,349 | -3.61 | 384 | 13.99 | ||||
| 2025-08-14 | 13F | Bank Of America Corp /de/ | 233,883 | -40.02 | 12,211 | -29.04 | ||||
| 2025-07-14 | 13F | Sowell Financial Services LLC | 17,175 | 0.00 | 897 | 18.36 | ||||
| 2025-08-05 | 13F | Wellington Shields & Co., LLC | 4,680 | 244 | ||||||
| 2025-08-08 | 13F | Tortoise Investment Management, LLC | 442 | 0.00 | 23 | 21.05 | ||||
| 2025-08-05 | 13F | Bank Of Montreal /can/ | 3,050 | 0.00 | 159 | 18.66 | ||||
| 2025-08-14 | 13F | Citadel Advisors Llc | 10,824 | -57.55 | 565 | -49.78 | ||||
| 2025-07-17 | 13F | Fifth Third Securities, Inc. | 4,910 | 0.00 | 256 | 18.52 | ||||
| 2025-08-07 | 13F | Efficient Advisors, LLC | 30,290 | 35.62 | 1,581 | 60.51 | ||||
| 2025-08-12 | 13F | CIBC Private Wealth Group, LLC | 279 | 0.00 | 15 | 40.00 | ||||
| 2025-08-13 | 13F | Lido Advisors, LLC | 11,133 | 12.51 | 581 | 33.26 | ||||
| 2025-07-29 | 13F | Private Trust Co Na | 141 | 0.00 | 7 | 16.67 | ||||
| 2025-07-28 | 13F | WJ Wealth Management, LLC | 8,500 | 0.00 | 444 | 18.13 | ||||
| 2025-07-16 | 13F | Perigon Wealth Management, LLC | 7,602 | -2.04 | 397 | 15.79 | ||||
| 2025-08-14 | 13F | Raymond James Financial Inc | 165,485 | 0.79 | 8,640 | 19.24 | ||||
| 2025-07-08 | 13F | Parallel Advisors, LLC | 43,715 | -5.37 | 2,282 | 11.97 | ||||
| 2025-07-18 | 13F | Founders Capital Management | 95 | 0.00 | 5 | 0.00 | ||||
| 2025-07-17 | 13F | Beacon Capital Management, LLC | 230 | 0.00 | 12 | 20.00 | ||||
| 2025-07-29 | 13F | Ballast, Inc. | 22,523 | 1,176 | ||||||
| 2025-08-14 | 13F | Benjamin Edwards Inc | 19,368 | 22.27 | 1,011 | 44.64 | ||||
| 2025-05-12 | 13F | Biltmore Family Office, LLC | 0 | -100.00 | 0 | -100.00 | ||||
| 2025-07-17 | 13F | Halbert Hargrove Global Advisors, Llc | 220 | 0.00 | 11 | 22.22 | ||||
| 2025-08-12 | 13F | Pathstone Holdings, LLC | 44,454 | 0.00 | 2,321 | 18.31 | ||||
| 2025-08-04 | 13F | Creative Financial Designs Inc /adv | 95 | 0.00 | 5 | 0.00 | ||||
| 2025-08-07 | 13F | Allworth Financial LP | 1,000 | 0.00 | 52 | 18.18 | ||||
| 2025-08-04 | 13F | Joseph P. Lucia & Associates, LLC | 22,523 | -1.94 | 1,176 | 15.99 | ||||
| 2025-08-07 | 13F | PFG Advisors | 93,473 | 21.64 | 4,880 | 43.91 | ||||
| 2025-08-11 | 13F | Atlantic Private Wealth, LLC | 2,000 | 0.00 | 104 | 18.18 | ||||
| 2025-08-14 | 13F | UBS Group AG | 736,821 | 1.29 | 38,469 | 19.84 | ||||
| 2025-08-15 | 13F | Morgan Stanley | 620,314 | 4.66 | 32,387 | 23.83 | ||||
| 2025-07-01 | 13F | Harbor Investment Advisory, Llc | 20,315 | -1.22 | 1,061 | 16.87 | ||||
| 2025-08-08 | 13F | Pnc Financial Services Group, Inc. | 2,200 | 0.00 | 115 | 17.53 | ||||
| 2025-08-12 | 13F | Jpmorgan Chase & Co | 33,901 | -0.81 | 1,770 | 17.31 | ||||
| 2025-07-14 | 13F | Golden State Equity Partners | 4,150 | 217 | ||||||
| 2025-08-01 | 13F | Envestnet Asset Management Inc | 26,133 | 43.68 | 1,364 | 70.07 | ||||
| 2025-07-25 | 13F | Hemington Wealth Management | 866 | 0.00 | 0 | |||||
| 2025-08-11 | 13F | Citigroup Inc | 1,850 | 0.00 | 97 | 18.52 | ||||
| 2025-07-31 | 13F | Nilsine Partners, LLC | 29,499 | 0.38 | 1,540 | 18.83 | ||||
| 2025-08-04 | 13F | Kovack Advisors, Inc. | 13,863 | 0.17 | 724 | 18.52 | ||||
| 2025-08-14 | 13F | Royal Bank Of Canada | 232,891 | -5.10 | 12,159 | 12.27 | ||||
| 2025-08-14 | 13F | Colony Group, LLC | 4,025 | 210 | ||||||
| 2025-08-14 | 13F | Mariner, LLC | 20,819 | 0.00 | 1,087 | 18.30 | ||||
| 2025-07-11 | 13F | Seacrest Wealth Management, Llc | 21,234 | 2.82 | 1,109 | 21.62 | ||||
| 2025-07-28 | 13F | Harbour Investments, Inc. | 2,596 | 0.04 | 136 | 18.42 | ||||
| 2025-08-06 | 13F | AE Wealth Management LLC | 1,677 | 15.02 | 88 | 35.94 | ||||
| 2025-07-23 | 13F | Tcfg Wealth Management, Llc | 6,986 | 0.00 | 365 | 18.18 | ||||
| 2025-08-12 | 13F | MAI Capital Management | 440 | -55.47 | 23 | -48.84 | ||||
| 2025-08-19 | 13F | Asset Dedication, LLC | 90 | 0.00 | 5 | 33.33 | ||||
| 2025-07-15 | 13F | Carr Financial Group Corp | 22,454 | 39.42 | 1,172 | 65.07 | ||||
| 2025-07-28 | 13F | Frazier Financial Advisors, LLC | 32 | 0.00 | 2 | 0.00 | ||||
| 2025-08-14 | 13F | Aqr Capital Management Llc | 9,035 | -3.99 | 472 | 13.49 | ||||
| 2025-08-13 | 13F/A | StoneX Group Inc. | 0 | -100.00 | 0 | |||||
| 2025-08-08 | 13F | Austin Wealth Management, LLC | 11,714 | -2.78 | 617 | 15.76 | ||||
| 2025-07-02 | 13F | Central Pacific Bank - Trust Division | 240 | 0.00 | 13 | 20.00 | ||||
| 2025-08-14 | 13F | KKM Financial LLC | 5,209 | 0.00 | 272 | 18.34 | ||||
| 2025-07-14 | 13F | Painted Porch Advisors LLC | 0 | -100.00 | 0 | -100.00 | ||||
| 2025-08-01 | 13F | Gwn Securities Inc. | 5,938 | -96.96 | 310 | -96.78 | ||||
| 2025-08-11 | 13F | GW&K Investment Management, LLC | 1,375 | 0.00 | 0 | |||||
| 2025-07-24 | 13F | Us Bancorp \de\ | 15,986 | 0.00 | 835 | 18.30 | ||||
| 2025-08-08 | 13F | Avantax Advisory Services, Inc. | 22,946 | -5.58 | 1,198 | 11.75 | ||||
| 2025-08-06 | 13F | Atlantic Union Bankshares Corp | 1,500 | 78 | ||||||
| 2025-07-17 | 13F | Sound Income Strategies, LLC | 30 | 0.00 | 2 | 0.00 | ||||
| 2025-08-13 | 13F | Jones Financial Companies Lllp | 25,513 | 17.14 | 1,327 | 37.80 | ||||
| 2025-08-19 | 13F | Newbridge Financial Services Group, Inc. | 1,491 | 78 | ||||||
| 2025-08-13 | 13F | Marshall Wace, Llp | 12,111 | -19.97 | 632 | -5.25 | ||||
| 2025-08-14 | 13F | Two Sigma Investments, Lp | 70,300 | 3,670 | ||||||
| 2025-07-22 | 13F | Bank Hapoalim Bm | 4,600 | 0.00 | 0 | |||||
| 2025-08-14 | 13F | CIBC World Markets Inc. | 13,710 | 1.22 | 716 | 19.77 | ||||
| 2025-07-07 | 13F | RDA Financial Network | 9,760 | 0.00 | 510 | 18.37 | ||||
| 2025-08-14 | 13F | Hirtle Callaghan & Co LLC | 8,600 | 0.00 | 449 | 18.47 | ||||
| 2025-07-16 | 13F | ORG Wealth Partners, LLC | 93 | 0.00 | 5 | 0.00 | ||||
| 2025-07-31 | 13F | Brighton Jones Llc | 7,084 | -0.91 | 370 | 17.14 | ||||
| 2025-05-09 | 13F | Atria Wealth Solutions, Inc. | 0 | -100.00 | 0 | |||||
| 2025-07-17 | 13F | Western Financial Corp/CA | 6,589 | -21.09 | 344 | -6.52 | ||||
| 2025-07-29 | 13F | Stratos Wealth Partners, LTD. | 5,709 | 44.31 | 298 | -44.09 | ||||
| 2025-07-09 | 13F | David J Yvars Group | 23,099 | -7.66 | 1,206 | 9.25 | ||||
| 2025-08-08 | 13F | Ironwood Investment Counsel, LLC | 9,721 | 0.00 | 508 | 18.46 | ||||
| 2025-08-14 | 13F | Ameriprise Financial Inc | 39,225 | 11.60 | 2,048 | 31.98 | ||||
| 2025-08-14 | 13F | Bnp Paribas Arbitrage, Sa | 0 | -100.00 | 0 | |||||
| 2025-08-14 | 13F | Mml Investors Services, Llc | 52,049 | 0.96 | 3 | 0.00 | ||||
| 2025-08-14 | 13F | Stifel Financial Corp | 92,478 | -0.75 | 4,829 | 17.44 |