Mga Batayang Estadistika
| Pemilik Institusional | 107 total, 105 long only, 1 short only, 1 long/short - change of 21.59% MRQ |
| Alokasi Portofolio Rata-rata | 0.0302 % - change of -1.77% MRQ |
| Saham Institusional (Jangka Panjang) | 6,370,243 (ex 13D/G) - change of 1.80MM shares 39.31% MRQ |
| Nilai Institusional (Jangka Panjang) | $ 138,220 USD ($1000) |
Kepemilikan Institusional dan Pemegang Saham
Global X Funds - Global X SuperDividend ETF (US:SDIV) memiliki 107 pemilik institusional dan pemegang saham yang telah mengajukan formulir 13D/G atau 13F kepada Komisi Bursa Efek (Securities Exchange Commission/SEC). Lembaga-lembaga ini memegang total 6,802,652 saham. Pemegang saham terbesar meliputi LPL Financial LLC, Howard Capital Management Inc., Morgan Stanley, Foguth Wealth Management, LLC., Signal Advisors Wealth, LLC, Bank Of America Corp /de/, Advisor Group Holdings, Inc., Wells Fargo & Company/mn, Susquehanna International Group, Llp, and Newbridge Financial Services Group, Inc. .
Struktur kepemilikan institusional Global X Funds - Global X SuperDividend ETF (ARCA:SDIV) menunjukkan posisi terkini di perusahaan oleh institusi dan dana, serta perubahan terbaru dalam ukuran posisi. Pemegang saham utama dapat mencakup investor individu, reksa dana, dana lindung nilai, atau institusi. Jadwal 13D menunjukkan bahwa investor memegang (atau pernah memegang) lebih dari 5% saham perusahaan dan bermaksud (atau pernah bermaksud) untuk secara aktif mengejar perubahan strategi bisnis. Jadwal 13G menunjukkan investasi pasif lebih dari 5%.
The share price as of September 2, 2025 is 23.71 / share. Previously, on September 3, 2024, the share price was 22.21 / share. This represents an increase of 6.75% over that period.

Skor Sentimen Dana
Skor Sentimen Dana (sebelumnya dikenal sebagai Skor Akumulasi Kepemilikan) menemukan saham-saham yang paling banyak dibeli oleh dana. Ini adalah hasil dari model kuantitatif multi-faktor yang canggih yang mengidentifikasi perusahaan dengan tingkat akumulasi institusional tertinggi. Model penilaian menggunakan kombinasi dari total peningkatan pemilik yang diungkapkan, perubahan dalam alokasi portofolio pada pemilik tersebut, dan metrik lainnya. Angka berkisar dari 0 hingga 100, dengan angka yang lebih tinggi menunjukkan tingkat akumulasi yang lebih tinggi dibandingkan dengan perusahaan sejenisnya, dan 50 adalah rata-ratanya.
Frekuensi Pembaruan: Setiap Hari
Lihat Ownership Explorer, yang menyediakan daftar perusahaan dengan peringkat tertinggi.
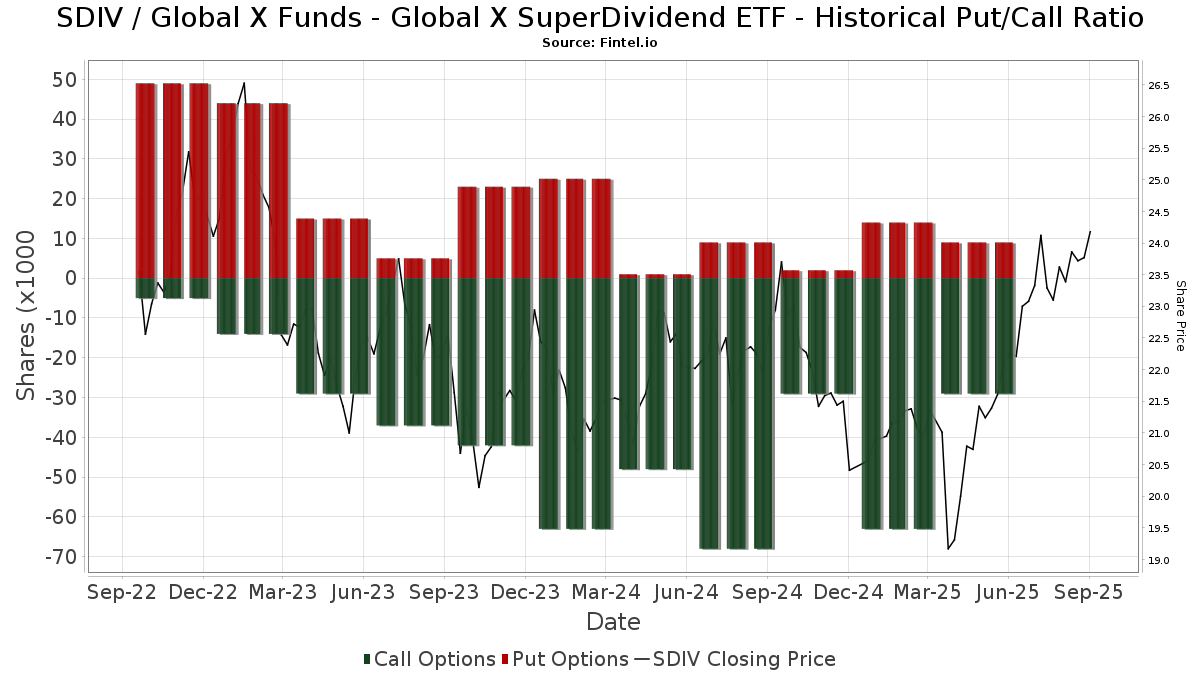
Rasio Put/Call Institusional
Selain melaporkan isu ekuitas dan utang standar, institusi dengan aset di bawah manajemen lebih dari 100 juta dolar AS juga harus mengungkapkan kepemilikan opsi put dan call mereka. Karena opsi put umumnya menunjukkan sentimen negatif, dan opsi call menunjukkan sentimen positif, kita dapat mengetahui sentimen institusional secara keseluruhan dengan memplot rasio put terhadap call. Grafik di sebelah kanan memplot rasio put/call historis untuk instrumen ini.
Menggunakan Rasio Put/Call sebagai indikator sentimen investor mengatasi salah satu kekurangan utama dari penggunaan total kepemilikan institusional, yaitu sejumlah besar aset yang dikelola diinvestasikan secara pasif untuk melacak indeks. Dana yang dikelola secara pasif biasanya tidak membeli opsi, sehingga indikator rasio put/call lebih akurat dalam melacak sentimen dana yang dikelola secara aktif.
Pengajuan 13F dan NPORT
Detail pada pengajuan 13F tersedia gratis. Detail pada pengajuan NP memerlukan keanggotaan premium. Baris berwarna hijau menunjukkan posisi baru. Baris berwarna merah menunjukkan posisi yang sudah ditutup. Klik tautan ini ikon untuk melihat riwayat transaksi selengkapnya.
Tingkatkan
untuk membuka data premium dan mengekspor ke Excel ![]() .
.
| Tanggal File | Sumber | Investor | Ketik | Presyo ng Avg (Silangan) |
Saham | Δ Saham (%) |
Dilaporkan Nilai ($1000) |
Nilai Δ (%) |
Alokasi Port (%) |
|
|---|---|---|---|---|---|---|---|---|---|---|
| 2025-08-13 | 13F | Renaissance Technologies Llc | 28,045 | 632 | ||||||
| 2025-08-07 | 13F | Kestra Private Wealth Services, Llc | 46,775 | 67.90 | 1,055 | 80.48 | ||||
| 2025-08-14 | 13F | Bank Of America Corp /de/ | 410,676 | -8.65 | 9,261 | -1.77 | ||||
| 2025-07-31 | 13F | Cambridge Investment Research Advisors, Inc. | 120,288 | 3.35 | 3 | 0.00 | ||||
| 2025-08-06 | 13F | Atlantic Union Bankshares Corp | 230 | 5 | ||||||
| 2025-08-04 | 13F | Integrity Alliance, Llc. | 18,674 | -0.19 | 421 | 7.40 | ||||
| 2025-08-11 | 13F | Private Advisor Group, LLC | 14,377 | 324 | ||||||
| 2025-08-14 | 13F | Jane Street Group, Llc | 17,057 | 385 | ||||||
| 2025-07-09 | 13F | Lifestyle Asset Management, Inc. | 14,372 | 324 | ||||||
| 2025-05-15 | 13F | Talon Private Wealth, LLC | 0 | -100.00 | 0 | -100.00 | ||||
| 2025-08-05 | 13F | Simplex Trading, Llc | 3,350 | 0 | ||||||
| 2025-05-09 | 13F | CoreCap Advisors, LLC | 0 | -100.00 | 0 | |||||
| 2025-07-17 | 13F | Janney Montgomery Scott LLC | 18,376 | -3.91 | 0 | |||||
| 2025-08-06 | 13F | AE Wealth Management LLC | 14,518 | 23.08 | 327 | 32.39 | ||||
| 2025-07-29 | 13F | International Assets Investment Management, Llc | 19,263 | -10.25 | 434 | -3.56 | ||||
| 2025-08-12 | 13F | Waterloo Capital, L.P. | 10,251 | 0.00 | 231 | 7.94 | ||||
| 2025-08-11 | 13F | Wealthspire Advisors, LLC | 23,804 | 1.04 | 537 | 8.50 | ||||
| 2025-05-16 | 13F/A | Kestra Investment Management, LLC | 0 | -100.00 | 0 | |||||
| 2025-05-15 | 13F | Gts Securities Llc | 0 | -100.00 | 0 | |||||
| 2025-08-11 | 13F | Principal Securities, Inc. | 87,453 | 2,387.99 | 1,972 | 2,638.89 | ||||
| 2025-08-14 | 13F | Qube Research & Technologies Ltd | 26,056 | -25.56 | 588 | -19.92 | ||||
| 2025-08-05 | 13F | GPS Wealth Strategies Group, LLC | 9 | 0.00 | 0 | |||||
| 2025-08-12 | 13F | Global Retirement Partners, LLC | 11,865 | 34.57 | 268 | 47.51 | ||||
| 2025-07-22 | 13F/A | Kingstone Capital Partners Texas, LLC | 10,899 | 2.01 | 246 | 9.82 | ||||
| 2025-08-14 | 13F | UBS Group AG | 54,948 | -86.16 | 1,239 | -85.11 | ||||
| 2025-08-28 | NP | BTSAX - BTS Managed Income Fund Class A Shares | 25,303 | 571 | ||||||
| 2025-07-18 | 13F | Truist Financial Corp | 0 | -100.00 | 0 | |||||
| 2025-04-29 | 13F | Wood Tarver Financial Group, LLC | 0 | -100.00 | 0 | |||||
| 2025-07-31 | 13F | Wealthfront Advisers Llc | 54,733 | 10.18 | 1,234 | 18.54 | ||||
| 2025-08-12 | 13F | Founders Financial Alliance, LLC | 19,717 | 3.93 | 445 | 11.84 | ||||
| 2025-07-25 | 13F | Cwm, Llc | 2,174 | 794.65 | 0 | |||||
| 2025-07-18 | 13F | PFG Investments, LLC | 24,146 | -0.15 | 544 | 7.30 | ||||
| 2025-07-21 | 13F | Crews Bank & Trust | 6,115 | 69.16 | 138 | 82.67 | ||||
| 2025-07-09 | 13F | Sterling Manor Financial, LLC | 14,333 | 323 | ||||||
| 2025-08-14 | 13F | Citadel Advisors Llc | Call | 0 | -100.00 | 0 | ||||
| 2025-08-14 | 13F | Citadel Advisors Llc | Put | 0 | -100.00 | 0 | ||||
| 2025-07-21 | 13F | Ameritas Advisory Services, LLC | 38,532 | 9.30 | 869 | 17.62 | ||||
| 2025-07-28 | 13F | Ckw Financial Group | 1,000 | 0.00 | 0 | |||||
| 2025-07-23 | 13F | Kingswood Wealth Advisors, Llc | 44,576 | 41.08 | 1,005 | 51.81 | ||||
| 2025-08-08 | 13F | SBI Securities Co., Ltd. | 44,841 | -0.29 | 1,011 | 7.21 | ||||
| 2025-08-14 | 13F | Raymond James Financial Inc | 81,692 | 2.99 | 1,842 | 10.76 | ||||
| 2025-08-08 | 13F | Financial Gravity Companies, Inc. | 666 | 0.00 | 15 | 15.38 | ||||
| 2025-08-08 | 13F | Cetera Investment Advisers | 103,842 | 18.89 | 2,342 | 27.85 | ||||
| 2025-08-04 | 13F | Kovack Advisors, Inc. | 15,562 | 20.77 | 351 | 29.63 | ||||
| 2025-08-08 | 13F | Fortis Group Advisors, LLC | 14,741 | 340 | ||||||
| 2025-08-08 | 13F | Advyzon Investment Management, LLC | 15,939 | -0.28 | 359 | 7.16 | ||||
| 2025-05-15 | 13F | Tower Research Capital LLC (TRC) | 0 | -100.00 | 0 | |||||
| 2025-08-14 | 13F/A | Rockefeller Capital Management L.P. | 23,428 | 3.12 | 528 | 10.92 | ||||
| 2025-07-10 | 13F | Signal Advisors Wealth, LLC | 528,346 | 723.03 | 11,914 | 785.14 | ||||
| 2025-07-09 | 13F | Triumph Capital Management | 41,074 | 1.22 | 926 | 8.94 | ||||
| 2025-08-13 | 13F | VestGen Advisors, LLC | 12,336 | 278 | ||||||
| 2025-07-08 | 13F | Parallel Advisors, LLC | 230 | 0.00 | 5 | 25.00 | ||||
| 2025-08-29 | 13F | Total Investment Management Inc | 1,506 | 34 | ||||||
| 2025-08-14 | 13F | Royal Bank Of Canada | 9,330 | 19.65 | 211 | 28.66 | ||||
| 2025-08-14 | 13F | Stifel Financial Corp | 14,316 | -2.77 | 323 | 4.55 | ||||
| 2025-08-19 | 13F | Newbridge Financial Services Group, Inc. | 129,172 | 4.19 | 2,913 | 12.04 | ||||
| 2025-08-08 | 13F | Pnc Financial Services Group, Inc. | 366 | 8 | ||||||
| 2025-08-18 | 13F | Geneos Wealth Management Inc. | 133 | 0.00 | 3 | 0.00 | ||||
| 2025-08-04 | 13F | Assetmark, Inc | 72 | 2 | ||||||
| 2025-08-12 | 13F | Jpmorgan Chase & Co | 86,471 | 10.58 | 1,950 | 18.91 | ||||
| 2025-07-10 | 13F | Wealth Enhancement Advisory Services, Llc | 87,521 | -0.24 | 2,002 | 8.81 | ||||
| 2025-08-05 | 13F | Strategic Financial Concepts, LLC | 52,265 | -2.43 | 1,179 | 4.90 | ||||
| 2025-08-14 | 13F | Wells Fargo & Company/mn | 149,778 | 15.17 | 3,377 | 23.84 | ||||
| 2025-05-05 | 13F | Hazlett, Burt & Watson, Inc. | 0 | -100.00 | 0 | |||||
| 2025-08-11 | 13F | Aptus Capital Advisors, LLC | 768 | 17 | ||||||
| 2025-07-22 | 13F | Foguth Wealth Management, LLC. | 536,276 | 735.39 | 12,093 | 798.44 | ||||
| 2025-08-04 | 13F | Spire Wealth Management | 0 | -100.00 | 0 | |||||
| 2025-08-11 | 13F | Tidemark, LLC | 0 | -100.00 | 0 | |||||
| 2025-08-12 | 13F | Proequities, Inc. | 0 | 0 | ||||||
| 2025-08-14 | 13F | Susquehanna International Group, Llp | Call | 29,300 | -42.88 | 661 | -38.60 | |||
| 2025-08-14 | 13F | Mariner, LLC | 9,558 | 216 | ||||||
| 2025-08-01 | 13F | Brookwood Investment Group LLC | 13,726 | 310 | ||||||
| 2025-08-13 | 13F | Northwestern Mutual Wealth Management Co | 23,010 | 106.29 | 519 | 122.32 | ||||
| 2025-08-14 | 13F | Sei Investments Co | 39,944 | 13.10 | 901 | 21.62 | ||||
| 2025-07-24 | 13F | IFP Advisors, Inc | 764 | 86.80 | 17 | 112.50 | ||||
| 2025-08-13 | 13F | Flow Traders U.s. Llc | 0 | -100.00 | 0 | |||||
| 2025-08-13 | 13F | Advisor Group Holdings, Inc. | 183,179 | 2.84 | 3,836 | 2.68 | ||||
| 2025-08-14 | 13F | Susquehanna International Group, Llp | Put | 9,200 | -14.81 | 207 | -8.41 | |||
| 2025-08-28 | NP | TFAFX - Tactical Growth Allocation Fund Class I | 2,646 | 60 | ||||||
| 2025-08-14 | 13F | Susquehanna International Group, Llp | 138,100 | 16.44 | 3,114 | 25.21 | ||||
| 2025-08-15 | 13F | Kestra Advisory Services, LLC | 22,805 | 82.57 | 514 | 96.93 | ||||
| 2025-07-17 | 13F | Fifth Third Securities, Inc. | 97,389 | -9.96 | 2,196 | -3.17 | ||||
| 2025-08-05 | 13F | Dunhill Financial, LLC | 1,683 | 38 | ||||||
| 2025-08-12 | 13F | Deutsche Bank Ag\ | 1 | 0 | ||||||
| 2025-07-16 | 13F | Strategic Investment Solutions, Inc. /IL | 150 | 3 | ||||||
| 2025-07-11 | 13F | Farther Finance Advisors, LLC | 3,063 | 2.07 | 69 | 9.52 | ||||
| 2025-04-25 | 13F | New Wave Wealth Advisors Llc | 0 | -100.00 | 0 | |||||
| 2025-07-30 | 13F | BTS Asset Management, Inc. | 26,802 | 604 | ||||||
| 2025-08-14 | 13F | Fmr Llc | 526 | 497.73 | 12 | 1,000.00 | ||||
| 2025-07-31 | 13F | Optimum Investment Advisors | 1,000 | 0.00 | 23 | 10.00 | ||||
| 2025-08-11 | 13F | HighTower Advisors, LLC | 25,247 | -0.30 | 569 | 7.16 | ||||
| 2025-08-12 | 13F | MAI Capital Management | 2,050 | 51,150.00 | 46 | |||||
| 2025-07-28 | 13F | Harbour Investments, Inc. | 5,474 | 0.00 | 123 | 7.89 | ||||
| 2025-08-14 | 13F | Comerica Bank | 178 | 20.27 | 4 | 33.33 | ||||
| 2025-08-06 | 13F | Commonwealth Equity Services, Llc | 38,070 | 35.53 | 1 | |||||
| 2025-08-18 | 13F/A | National Bank Of Canada /fi/ | 15,000 | 0.00 | 325 | 6.56 | ||||
| 2025-08-13 | 13F | SageView Advisory Group, LLC | 11,762 | -9.66 | 278 | 1.47 | ||||
| 2025-08-13 | 13F | M Holdings Securities, Inc. | 17,433 | 0 | ||||||
| 2025-07-08 | 13F | Goldstone Financial Group, LLC | 44,451 | -1.34 | 1,017 | 7.63 | ||||
| 2025-08-11 | 13F | Citigroup Inc | 400 | 0.00 | 9 | 12.50 | ||||
| 2025-08-14 | 13F | Mml Investors Services, Llc | 26,894 | 111.20 | 1 | |||||
| 2025-07-21 | 13F | Ameriflex Group, Inc. | 0 | -100.00 | 0 | |||||
| 2025-08-06 | 13F | Prospera Financial Services Inc | 23,242 | 14.07 | 524 | 22.72 | ||||
| 2025-08-11 | 13F | Western Wealth Management, LLC | 15,714 | -12.28 | 354 | -5.60 | ||||
| 2025-08-14 | 13F | GWM Advisors LLC | 75,791 | 7.48 | 1,709 | 15.63 | ||||
| 2025-08-05 | 13F | Westside Investment Management, Inc. | 1,000 | 0.00 | 23 | 10.00 | ||||
| 2025-07-29 | 13F | Private Trust Co Na | 1,166 | 0.00 | 26 | 8.33 | ||||
| 2025-08-14 | 13F | Ameriprise Financial Inc | 75,794 | 18.62 | 1,709 | 27.63 | ||||
| 2025-07-16 | 13F | ORG Partners LLC | 0 | -100.00 | 0 | |||||
| 2025-08-12 | 13F | LPL Financial LLC | 808,842 | 6.79 | 18,239 | 14.84 | ||||
| 2025-08-08 | 13F | Good Life Advisors, LLC | 18,263 | 3.76 | 412 | 11.38 | ||||
| 2025-08-01 | 13F | Howard Capital Management Inc. | 681,750 | 15,373 | ||||||
| 2025-07-21 | 13F | Synergy Financial Management, LLC | 87,496 | 1,973 | ||||||
| 2025-04-30 | 13F | Sofos Investments, Inc. | 666 | 0.00 | 14 | -7.14 | ||||
| 2025-07-18 | 13F | Bartlett & Co. Wealth Management Llc | 0 | -100.00 | 0 | |||||
| 2025-08-01 | 13F | Envestnet Asset Management Inc | 64,381 | 3.72 | 1,452 | 11.53 | ||||
| 2025-08-13 | 13F | Capital Analysts, Inc. | 266 | 0.00 | 0 | |||||
| 2025-07-25 | 13F | Atria Wealth Solutions, Inc. | 9,467 | -25.58 | 214 | -19.55 | ||||
| 2025-08-19 | 13F | Cape Investment Advisory, Inc. | 1,000 | 23 | ||||||
| 2025-05-12 | 13F | Sandy Spring Bank | 230 | 0.00 | 5 | 0.00 | ||||
| 2025-08-14 | 13F | Federation des caisses Desjardins du Quebec | 685 | -16.05 | 15 | -11.76 | ||||
| 2025-07-30 | NP | ORR - Militia Long/Short Equity ETF | Short | -432,409 | -9,310 | |||||
| 2025-07-08 | 13F | Nbc Securities, Inc. | 75 | 0.00 | 0 | |||||
| 2025-05-09 | 13F | GeoWealth Management, LLC | 0 | -100.00 | 0 | -100.00 | ||||
| 2025-07-21 | 13F | Mirae Asset Global Investments Co., Ltd. | 3,800 | 86 | ||||||
| 2025-05-14 | 13F | Gould Capital, LLC | 0 | -100.00 | 0 | |||||
| 2025-08-07 | 13F | Allworth Financial LP | 112 | 0.00 | 3 | 0.00 | ||||
| 2025-08-13 | 13F | Jones Financial Companies Lllp | 35,893 | 56.29 | 803 | 66.25 | ||||
| 2025-08-15 | 13F | Morgan Stanley | 580,719 | 1.80 | 13,095 | 9.48 |