Mga Batayang Estadistika
| Pemilik Institusional | 111 total, 111 long only, 0 short only, 0 long/short - change of 3.67% MRQ |
| Alokasi Portofolio Rata-rata | 0.0303 % - change of 6.43% MRQ |
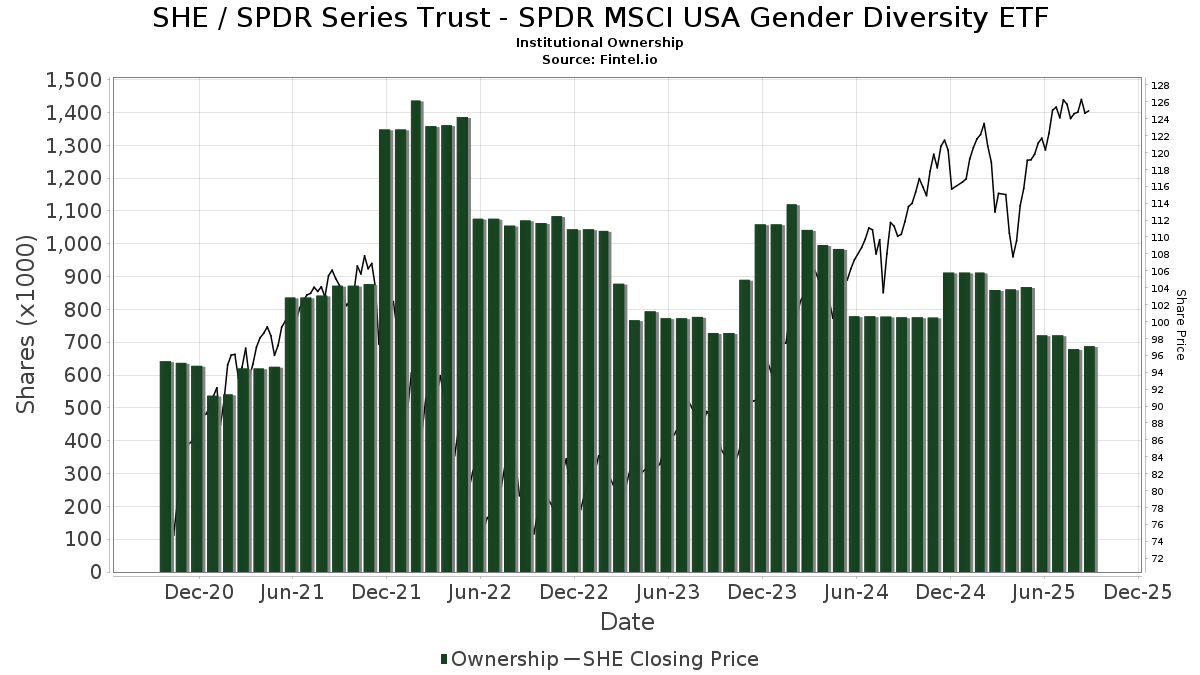
| Saham Institusional (Jangka Panjang) | 688,883 (ex 13D/G) - change of -0.03MM shares -4.51% MRQ |
| Nilai Institusional (Jangka Panjang) | $ 77,866 USD ($1000) |
Kepemilikan Institusional dan Pemegang Saham
SPDR Series Trust - SPDR MSCI USA Gender Diversity ETF (US:SHE) memiliki 111 pemilik institusional dan pemegang saham yang telah mengajukan formulir 13D/G atau 13F kepada Komisi Bursa Efek (Securities Exchange Commission/SEC). Lembaga-lembaga ini memegang total 688,883 saham. Pemegang saham terbesar meliputi LPL Financial LLC, Morgan Stanley, Bank Of America Corp /de/, Jpmorgan Chase & Co, Betterment LLC, Albion Financial Group /ut, Cetera Investment Advisers, UBS Group AG, Commonwealth Equity Services, Llc, and Royal Bank Of Canada .
Struktur kepemilikan institusional SPDR Series Trust - SPDR MSCI USA Gender Diversity ETF (ARCA:SHE) menunjukkan posisi terkini di perusahaan oleh institusi dan dana, serta perubahan terbaru dalam ukuran posisi. Pemegang saham utama dapat mencakup investor individu, reksa dana, dana lindung nilai, atau institusi. Jadwal 13D menunjukkan bahwa investor memegang (atau pernah memegang) lebih dari 5% saham perusahaan dan bermaksud (atau pernah bermaksud) untuk secara aktif mengejar perubahan strategi bisnis. Jadwal 13G menunjukkan investasi pasif lebih dari 5%.
The share price as of September 5, 2025 is 124.57 / share. Previously, on September 6, 2024, the share price was 108.19 / share. This represents an increase of 15.14% over that period.
Skor Sentimen Dana
Skor Sentimen Dana (sebelumnya dikenal sebagai Skor Akumulasi Kepemilikan) menemukan saham-saham yang paling banyak dibeli oleh dana. Ini adalah hasil dari model kuantitatif multi-faktor yang canggih yang mengidentifikasi perusahaan dengan tingkat akumulasi institusional tertinggi. Model penilaian menggunakan kombinasi dari total peningkatan pemilik yang diungkapkan, perubahan dalam alokasi portofolio pada pemilik tersebut, dan metrik lainnya. Angka berkisar dari 0 hingga 100, dengan angka yang lebih tinggi menunjukkan tingkat akumulasi yang lebih tinggi dibandingkan dengan perusahaan sejenisnya, dan 50 adalah rata-ratanya.
Frekuensi Pembaruan: Setiap Hari
Lihat Ownership Explorer, yang menyediakan daftar perusahaan dengan peringkat tertinggi.
Rasio Put/Call Institusional
Selain melaporkan isu ekuitas dan utang standar, institusi dengan aset di bawah manajemen lebih dari 100 juta dolar AS juga harus mengungkapkan kepemilikan opsi put dan call mereka. Karena opsi put umumnya menunjukkan sentimen negatif, dan opsi call menunjukkan sentimen positif, kita dapat mengetahui sentimen institusional secara keseluruhan dengan memplot rasio put terhadap call. Grafik di sebelah kanan memplot rasio put/call historis untuk instrumen ini.
Menggunakan Rasio Put/Call sebagai indikator sentimen investor mengatasi salah satu kekurangan utama dari penggunaan total kepemilikan institusional, yaitu sejumlah besar aset yang dikelola diinvestasikan secara pasif untuk melacak indeks. Dana yang dikelola secara pasif biasanya tidak membeli opsi, sehingga indikator rasio put/call lebih akurat dalam melacak sentimen dana yang dikelola secara aktif.
Pengajuan 13F dan NPORT
Detail pada pengajuan 13F tersedia gratis. Detail pada pengajuan NP memerlukan keanggotaan premium. Baris berwarna hijau menunjukkan posisi baru. Baris berwarna merah menunjukkan posisi yang sudah ditutup. Klik tautan ini ikon untuk melihat riwayat transaksi selengkapnya.
Tingkatkan
untuk membuka data premium dan mengekspor ke Excel ![]() .
.
| Tanggal File | Sumber | Investor | Ketik | Presyo ng Avg (Silangan) |
Saham | Δ Saham (%) |
Dilaporkan Nilai ($1000) |
Nilai Δ (%) |
Alokasi Port (%) |
|
|---|---|---|---|---|---|---|---|---|---|---|
| 2025-07-30 | 13F | Fingerlakes Wealth Management, Inc. | 3,870 | -0.08 | 483 | 9.28 | ||||
| 2025-07-30 | 13F | Pittenger & Anderson Inc | 2,475 | 0.00 | 309 | 9.22 | ||||
| 2025-08-14 | 13F | Mariner, LLC | 3,000 | 0.10 | 374 | 9.36 | ||||
| 2025-06-30 | NP | VWITX - Vanguard Intermediate-Term Tax-Exempt Fund Investor Shares This fund is a listed as child fund of Vanguard Group Inc and if that institution has disclosed ownership in this security, then these positions will not be double counted when calculating total shares and total value | 1,167 | 0.00 | ||||||
| 2025-08-01 | 13F | Redwood Park Advisors LLC | 1 | 0.00 | 0 | |||||
| 2025-08-14 | 13F | Mendel Capital Management LLC | 4,037 | 0.00 | 504 | 9.35 | ||||
| 2025-07-25 | 13F | Johnson Investment Counsel Inc | 2,500 | -19.35 | 312 | -11.61 | ||||
| 2025-08-14 | 13F | Sunbelt Securities, Inc. | 548 | -0.18 | 63 | 1.61 | ||||
| 2025-08-14 | 13F | Integrated Wealth Concepts LLC | 3,693 | 21.20 | 461 | 32.56 | ||||
| 2025-08-08 | 13F | Smithfield Trust Co | 24 | 0.00 | 0 | |||||
| 2025-08-06 | 13F | Commonwealth Equity Services, Llc | 12,391 | 36.69 | 2 | 0.00 | ||||
| 2025-07-18 | 13F | Bartlett & Co. Wealth Management Llc | 570 | 0.00 | 71 | 9.23 | ||||
| 2025-08-14 | 13F | Goldman Sachs Group Inc | 0 | -100.00 | 0 | |||||
| 2025-08-18 | 13F | Geneos Wealth Management Inc. | 100 | 0.00 | 12 | 9.09 | ||||
| 2025-07-23 | 13F | Traphagen Investment Advisors Llc | 2,108 | -8.39 | 263 | 0.38 | ||||
| 2025-04-23 | 13F | Financial Life Planners | 0 | -100.00 | 0 | |||||
| 2025-05-08 | 13F | Us Financial Advisors, Llc | 4,363 | 4.68 | 498 | 3.11 | ||||
| 2025-08-12 | 13F | Proequities, Inc. | 0 | 0 | ||||||
| 2025-08-14 | 13F | UBS Group AG | 23,194 | -10.63 | 2,895 | -2.26 | ||||
| 2025-07-31 | 13F | Cambridge Investment Research Advisors, Inc. | 7,497 | 8.75 | 1 | |||||
| 2025-07-29 | 13F | Private Trust Co Na | 1,146 | 0.00 | 143 | 10.00 | ||||
| 2025-07-21 | 13F | Ameritas Advisory Services, LLC | 214 | 27 | ||||||
| 2025-08-14 | 13F | Aprio Wealth Management, LLC | 2,793 | -5.93 | 349 | 2.96 | ||||
| 2025-08-19 | 13F | Asset Dedication, LLC | 12 | 0.00 | 1 | 0.00 | ||||
| 2025-07-24 | 13F | Blair William & Co/il | 1,894 | -94.66 | 236 | -94.17 | ||||
| 2025-08-14 | 13F | Mercer Global Advisors Inc /adv | 2,995 | -2.06 | 374 | 6.88 | ||||
| 2025-08-14 | 13F | Marshall Investment Management, Llc | 0 | -100.00 | 0 | |||||
| 2025-08-01 | 13F | Envestnet Asset Management Inc | 4,509 | -2.82 | 563 | 6.24 | ||||
| 2025-08-05 | 13F | Bank Of Montreal /can/ | 700 | 0.00 | 87 | 10.13 | ||||
| 2025-08-14 | 13F | Camden Capital, LLC | 3,429 | 0.32 | 428 | 9.74 | ||||
| 2025-07-10 | 13F | Global Financial Private Client, LLC | 0 | -100.00 | 0 | |||||
| 2025-08-14 | 13F | Ameriprise Financial Inc | 5,132 | 32.17 | 640 | 33.13 | ||||
| 2025-07-30 | 13F | Princeton Global Asset Management LLC | 523 | 0.38 | 65 | 10.17 | ||||
| 2025-08-14 | 13F | AllSquare Wealth Management LLC | 47 | 0.00 | 6 | 0.00 | ||||
| 2025-07-10 | 13F | CWC Advisors, LLC. | 3,257 | -0.25 | 407 | 9.14 | ||||
| 2025-08-05 | 13F | Bank of New York Mellon Corp | 3,651 | -0.03 | 456 | 9.38 | ||||
| 2025-08-08 | 13F | Laurel Wealth Planning LLC | 5,371 | 2.27 | 670 | 11.85 | ||||
| 2025-07-28 | 13F | Harbour Investments, Inc. | 162 | 0.00 | 20 | 11.11 | ||||
| 2025-07-23 | 13F | Valmark Advisers, Inc. | 2,352 | 4.30 | 294 | 14.01 | ||||
| 2025-08-11 | 13F | Citigroup Inc | 3,852 | -1.83 | 481 | 7.38 | ||||
| 2025-07-28 | 13F | BRYN MAWR TRUST Co | 6,088 | -0.07 | 760 | 9.21 | ||||
| 2025-08-12 | 13F | Steward Partners Investment Advisory, Llc | 460 | 0.00 | 57 | 9.62 | ||||
| 2025-07-17 | 13F | Vermillion Wealth Management, Inc. | 975 | 0.21 | 122 | 9.01 | ||||
| 2025-08-15 | 13F | Kestra Advisory Services, LLC | 5,934 | -2.45 | 741 | 6.63 | ||||
| 2025-08-13 | 13F | Russell Investments Group, Ltd. | 429 | 0.00 | 54 | 10.42 | ||||
| 2025-08-14 | 13F | Comerica Bank | 609 | 0.33 | 76 | 10.14 | ||||
| 2025-09-04 | 13F/A | Advisor Group Holdings, Inc. | 6,587 | -18.12 | 822 | -10.46 | ||||
| 2025-07-25 | 13F | Mitchell Sinkler & Starr/pa | 2,625 | 0.00 | 328 | 9.36 | ||||
| 2025-07-31 | 13F | CVA Family Office, LLC | 8 | 1 | ||||||
| 2025-07-17 | 13F | Wolff Wiese Magana Llc | 5 | 1 | ||||||
| 2025-08-13 | 13F | Twin Peaks Wealth Advisors, LLC | 80 | 10 | ||||||
| 2025-08-13 | 13F | KilterHowling LLC | 2,126 | 0.33 | 265 | 7.72 | ||||
| 2025-08-06 | 13F | Golden State Wealth Management, LLC | 175 | 0.00 | 22 | 10.53 | ||||
| 2025-08-14 | 13F | Bank Of America Corp /de/ | 52,785 | 13.66 | 6,589 | 24.30 | ||||
| 2025-08-14 | 13F | Colony Group, LLC | 3,538 | 442 | ||||||
| 2025-08-26 | 13F/A | Thrivent Financial For Lutherans | 2,180 | 0 | ||||||
| 2025-07-11 | 13F | Caldwell Securities, Inc | 18 | 0.00 | 2 | 0.00 | ||||
| 2025-07-29 | 13F | Mattson Financial Services, LLC | 0 | -100.00 | 0 | |||||
| 2025-08-12 | 13F | MAI Capital Management | 657 | 42.83 | 82 | 57.69 | ||||
| 2025-08-12 | 13F | O'shaughnessy Asset Management, Llc | 0 | -100.00 | 0 | |||||
| 2025-08-04 | 13F | Bristlecone Advisors, LLC | 487 | 0.00 | 61 | 9.09 | ||||
| 2025-08-12 | 13F | Howe & Rusling Inc | 1,562 | 0.00 | 195 | 8.99 | ||||
| 2025-08-12 | 13F | Jpmorgan Chase & Co | 40,949 | -0.07 | 5,111 | 9.28 | ||||
| 2025-07-08 | 13F | Gradient Investments LLC | 6,312 | -19.44 | 788 | -11.97 | ||||
| 2025-07-31 | 13F | Buckingham Strategic Partners | 3,225 | 30.20 | 403 | 42.55 | ||||
| 2025-08-08 | 13F | SBI Securities Co., Ltd. | 108 | 0.00 | 13 | 8.33 | ||||
| 2025-08-12 | 13F | Wood Tarver Financial Group, LLC | 1,687 | 0.00 | 0 | -100.00 | ||||
| 2025-07-10 | 13F | Atticus Wealth Management, Llc | 886 | 0.34 | 111 | 10.00 | ||||
| 2025-08-14 | 13F | Abound Financial, Llc | 1,958 | -13.59 | 244 | -5.43 | ||||
| 2025-08-01 | 13F | Rossby Financial, LCC | 156 | 0.00 | 19 | 11.76 | ||||
| 2025-08-13 | 13F | Jones Financial Companies Lllp | 4,523 | 9.54 | 560 | 19.66 | ||||
| 2025-03-12 | 13F/A | Private Capital Management Llc | 0 | -100.00 | 0 | |||||
| 2025-08-12 | 13F | Franklin Resources Inc | 210 | 0.00 | 26 | 13.04 | ||||
| 2025-08-04 | 13F | Assetmark, Inc | 2,421 | 302 | ||||||
| 2025-08-11 | 13F | Principal Securities, Inc. | 69 | 0.00 | 9 | 14.29 | ||||
| 2025-08-14 | 13F | Betterment LLC | 37,319 | 1.51 | 5 | 0.00 | ||||
| 2025-07-08 | 13F | Parallel Advisors, LLC | 11 | 1 | ||||||
| 2025-08-14 | 13F | Sei Investments Co | 6,501 | -3.89 | 811 | 5.05 | ||||
| 2025-08-14 | 13F | Guardian Wealth Advisors, Llc / Nc | 59 | 0.00 | 7 | 16.67 | ||||
| 2025-08-15 | 13F | Morgan Stanley | 95,528 | -1.67 | 11,924 | 7.54 | ||||
| 2025-07-18 | 13F/A | MJT & Associates Financial Advisory Group, Inc. | 1,062 | -15.91 | 133 | -8.33 | ||||
| 2025-07-11 | 13F | Farther Finance Advisors, LLC | 1 | 0.00 | 0 | |||||
| 2025-08-07 | 13F | Allworth Financial LP | 7 | -41.67 | 1 | -100.00 | ||||
| 2025-08-11 | 13F | HighTower Advisors, LLC | 2,202 | 0.00 | 275 | 9.16 | ||||
| 2025-05-05 | 13F | Lindbrook Capital, Llc | 250 | 0.00 | 29 | 0.00 | ||||
| 2025-07-17 | 13F | Albion Financial Group /ut | 35,429 | 0.39 | 4,422 | 9.81 | ||||
| 2025-07-29 | 13F | Mountain Capital Investment Advisors, Inc | 3,543 | -2.80 | 443 | 8.85 | ||||
| 2025-08-14 | 13F | Clifford Group, LLC | 1,675 | 209 | ||||||
| 2025-07-25 | 13F | Stephens Consulting, LLC | 1,542 | -24.49 | 192 | -17.60 | ||||
| 2025-08-05 | 13F | Huntington National Bank | 0 | |||||||
| 2025-08-12 | 13F | Ameritas Investment Partners, Inc. | 682 | 0.29 | 85 | 10.39 | ||||
| 2025-08-08 | 13F | TD Capital Management LLC | 191 | 0.53 | 24 | 9.52 | ||||
| 2025-08-12 | 13F | Global Retirement Partners, LLC | 22 | -38.89 | 3 | -50.00 | ||||
| 2025-08-29 | 13F | Centaurus Financial, Inc. | 864 | 0 | ||||||
| 2025-07-18 | 13F | PFG Investments, LLC | 2,371 | 0.21 | 296 | 9.26 | ||||
| 2025-07-22 | 13F | Berkshire Money Management, Inc. | 456 | 57 | ||||||
| 2025-05-15 | 13F | Tower Research Capital LLC (TRC) | 0 | -100.00 | 0 | |||||
| 2025-07-14 | 13F | Sowell Financial Services LLC | 2,421 | -6.63 | 302 | 2.37 | ||||
| 2025-08-13 | 13F | Northwestern Mutual Wealth Management Co | 1,289 | -8.97 | 161 | -0.62 | ||||
| 2025-08-14 | 13F | Wells Fargo & Company/mn | 11,872 | -12.47 | 1,482 | -4.33 | ||||
| 2025-08-12 | 13F | LPL Financial LLC | 115,068 | 5.79 | 14,363 | 15.69 | ||||
| 2025-07-10 | 13F | Wealth Enhancement Advisory Services, Llc | 5,283 | -0.36 | 666 | 9.92 | ||||
| 2025-08-08 | 13F | Creative Planning | 1,959 | 0.26 | 245 | 9.42 | ||||
| 2025-08-14 | 13F | Fmr Llc | 2,552 | 142.13 | 319 | 165.00 | ||||
| 2025-08-08 | 13F | Cetera Investment Advisers | 29,387 | 0.01 | 3,668 | 9.39 | ||||
| 2025-08-08 | 13F | Pnc Financial Services Group, Inc. | 282 | 0.00 | 35 | 9.38 | ||||
| 2025-08-14 | 13F | Federation des caisses Desjardins du Quebec | 115 | 0.00 | 14 | 7.69 | ||||
| 2025-08-04 | 13F | Simon Quick Advisors, Llc | 3,000 | 0.00 | 374 | 9.36 | ||||
| 2025-04-23 | 13F | Security National Bank | 0 | -100.00 | 0 | |||||
| 2025-08-14 | 13F | Citadel Advisors Llc | 0 | -100.00 | 0 | |||||
| 2025-08-14 | 13F | Royal Bank Of Canada | 12,296 | -15.37 | 1,535 | -7.42 | ||||
| 2025-08-14 | 13F | Susquehanna International Group, Llp | 11,107 | 52.32 | 1,386 | 66.59 | ||||
| 2025-07-29 | 13F | Sincerus Advisory, LLC | 1,587 | 201 | ||||||
| 2025-08-12 | 13F | Pathstone Holdings, LLC | 1,841 | 0.00 | 230 | 9.05 | ||||
| 2025-08-11 | 13F | Bell Investment Advisors, Inc | 6,663 | 0.41 | 832 | 9.78 | ||||
| 2025-05-13 | 13F | Rock Creek Group, LP | 0 | -100.00 | 0 | |||||
| 2025-07-25 | 13F | Cwm, Llc | 2,352 | -70.65 | 0 | |||||
| 2025-07-14 | 13F | Sentinel Pension Advisors Inc | 0 | -100.00 | 0 | |||||
| 2025-08-13 | 13F | Congress Wealth Management LLC / DE / | 5,049 | 14.18 | 630 | 25.00 | ||||
| 2025-08-14 | 13F | Raymond James Financial Inc | 10,314 | 16.89 | 1,287 | 27.81 | ||||
| 2025-08-14 | 13F | Glenmede Investment Management, LP | 92 | 11 | ||||||
| 2025-08-15 | 13F | Captrust Financial Advisors | 3,878 | 0.00 | 484 | 9.50 | ||||
| 2025-07-15 | 13F | Compagnie Lombard Odier SCmA | 0 | -100.00 | 0 | |||||
| 2025-07-11 | 13F | Grove Bank & Trust | 1,886 | 0.00 | 235 | 9.30 | ||||
| 2025-07-31 | 13F | Wealthfront Advisers Llc | 6,083 | 2.51 | 759 | 12.11 | ||||
| 2025-08-06 | 13F | AE Wealth Management LLC | 17 | 0.00 | 2 | 100.00 | ||||
| 2025-08-11 | 13F | Aptus Capital Advisors, LLC | 533 | 2.11 | 67 | 11.86 |
Other Listings
| MX:SHE |