Mga Batayang Estadistika
| Pemilik Institusional | 115 total, 115 long only, 0 short only, 0 long/short - change of -4.13% MRQ |
| Alokasi Portofolio Rata-rata | 0.1871 % - change of -9.68% MRQ |
| Saham Institusional (Jangka Panjang) | 2,846,934 (ex 13D/G) - change of 0.09MM shares 3.10% MRQ |
| Nilai Institusional (Jangka Panjang) | $ 122,018 USD ($1000) |
Kepemilikan Institusional dan Pemegang Saham
Invesco Exchange-Traded Fund Trust II - Invesco S&P SmallCap Low Volatility ETF (US:XSLV) memiliki 115 pemilik institusional dan pemegang saham yang telah mengajukan formulir 13D/G atau 13F kepada Komisi Bursa Efek (Securities Exchange Commission/SEC). Lembaga-lembaga ini memegang total 2,846,934 saham. Pemegang saham terbesar meliputi Venturi Wealth Management, LLC, LPL Financial LLC, Armbruster Capital Management, Inc., UBS Group AG, Bank Of America Corp /de/, Brookstone Capital Management, Morgan Stanley, Commonwealth Equity Services, Llc, Wells Fargo & Company/mn, and Eagle Bluffs Wealth Management LLC .
Struktur kepemilikan institusional Invesco Exchange-Traded Fund Trust II - Invesco S&P SmallCap Low Volatility ETF (ARCA:XSLV) menunjukkan posisi terkini di perusahaan oleh institusi dan dana, serta perubahan terbaru dalam ukuran posisi. Pemegang saham utama dapat mencakup investor individu, reksa dana, dana lindung nilai, atau institusi. Jadwal 13D menunjukkan bahwa investor memegang (atau pernah memegang) lebih dari 5% saham perusahaan dan bermaksud (atau pernah bermaksud) untuk secara aktif mengejar perubahan strategi bisnis. Jadwal 13G menunjukkan investasi pasif lebih dari 5%.
The share price as of September 9, 2025 is 47.37 / share. Previously, on September 9, 2024, the share price was 46.46 / share. This represents an increase of 1.97% over that period.

Skor Sentimen Dana
Skor Sentimen Dana (sebelumnya dikenal sebagai Skor Akumulasi Kepemilikan) menemukan saham-saham yang paling banyak dibeli oleh dana. Ini adalah hasil dari model kuantitatif multi-faktor yang canggih yang mengidentifikasi perusahaan dengan tingkat akumulasi institusional tertinggi. Model penilaian menggunakan kombinasi dari total peningkatan pemilik yang diungkapkan, perubahan dalam alokasi portofolio pada pemilik tersebut, dan metrik lainnya. Angka berkisar dari 0 hingga 100, dengan angka yang lebih tinggi menunjukkan tingkat akumulasi yang lebih tinggi dibandingkan dengan perusahaan sejenisnya, dan 50 adalah rata-ratanya.
Frekuensi Pembaruan: Setiap Hari
Lihat Ownership Explorer, yang menyediakan daftar perusahaan dengan peringkat tertinggi.
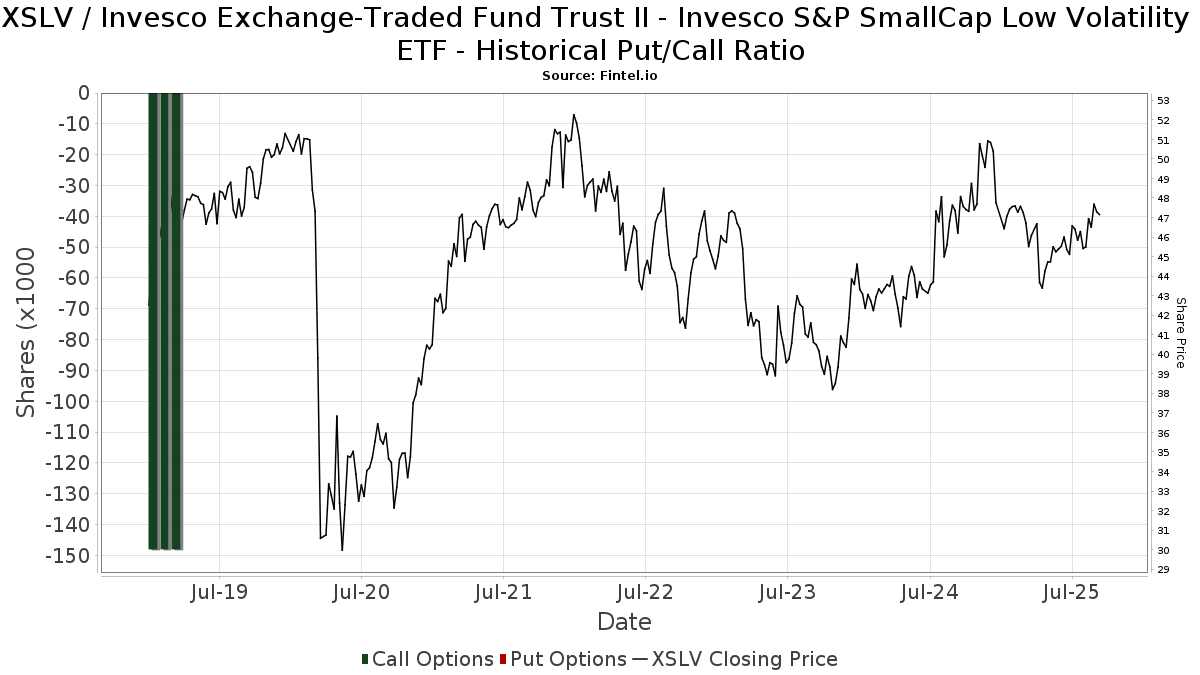
Rasio Put/Call Institusional
Selain melaporkan isu ekuitas dan utang standar, institusi dengan aset di bawah manajemen lebih dari 100 juta dolar AS juga harus mengungkapkan kepemilikan opsi put dan call mereka. Karena opsi put umumnya menunjukkan sentimen negatif, dan opsi call menunjukkan sentimen positif, kita dapat mengetahui sentimen institusional secara keseluruhan dengan memplot rasio put terhadap call. Grafik di sebelah kanan memplot rasio put/call historis untuk instrumen ini.
Menggunakan Rasio Put/Call sebagai indikator sentimen investor mengatasi salah satu kekurangan utama dari penggunaan total kepemilikan institusional, yaitu sejumlah besar aset yang dikelola diinvestasikan secara pasif untuk melacak indeks. Dana yang dikelola secara pasif biasanya tidak membeli opsi, sehingga indikator rasio put/call lebih akurat dalam melacak sentimen dana yang dikelola secara aktif.
Pengajuan 13F dan NPORT
Detail pada pengajuan 13F tersedia gratis. Detail pada pengajuan NP memerlukan keanggotaan premium. Baris berwarna hijau menunjukkan posisi baru. Baris berwarna merah menunjukkan posisi yang sudah ditutup. Klik tautan ini ikon untuk melihat riwayat transaksi selengkapnya.
Tingkatkan
untuk membuka data premium dan mengekspor ke Excel ![]() .
.
| Tanggal File | Sumber | Investor | Ketik | Presyo ng Avg (Silangan) |
Saham | Δ Saham (%) |
Dilaporkan Nilai ($1000) |
Nilai Δ (%) |
Alokasi Port (%) |
|
|---|---|---|---|---|---|---|---|---|---|---|
| 2025-07-22 | 13F | Legacy Trust | 0 | -100.00 | 0 | |||||
| 2025-08-14 | 13F | Harwood Advisory Group, LLC | 121 | -47.84 | 6 | -50.00 | ||||
| 2025-07-18 | 13F | Truist Financial Corp | 17,412 | 0.95 | 793 | -0.38 | ||||
| 2025-07-24 | 13F | Baldwin Brothers Inc/ma | 16,586 | 0.01 | 755 | -1.31 | ||||
| 2025-08-14 | 13F | Goldman Sachs Group Inc | 12,841 | 48.55 | 585 | 46.37 | ||||
| 2025-07-17 | 13F | Janney Montgomery Scott LLC | 6,833 | -1.71 | 0 | |||||
| 2025-08-14 | 13F | Citadel Advisors Llc | 16,808 | 16.88 | 766 | 15.21 | ||||
| 2025-05-14 | 13F | Flow Traders U.s. Llc | 0 | -100.00 | 0 | |||||
| 2025-08-06 | 13F | Commonwealth Equity Services, Llc | 116,830 | -4.28 | 5 | 0.00 | ||||
| 2025-05-08 | 13F | Endeavor Private Wealth, Inc. | 0 | -100.00 | 0 | |||||
| 2025-08-14 | 13F | Qube Research & Technologies Ltd | 90 | 0.00 | 4 | 0.00 | ||||
| 2025-07-23 | 13F | Eagle Strategies LLC | 13,128 | 7.71 | 598 | 6.23 | ||||
| 2025-07-21 | 13F | Ameritas Advisory Services, LLC | 113 | 5 | ||||||
| 2025-07-25 | 13F | Hazlett, Burt & Watson, Inc. | 415 | -68.30 | 0 | |||||
| 2025-07-24 | 13F | Jfs Wealth Advisors, Llc | 158 | 0.00 | 7 | 0.00 | ||||
| 2025-08-14 | 13F | Warren Averett Asset Management, LLC | 4,881 | -2.01 | 222 | -3.06 | ||||
| 2025-08-08 | 13F | Capital Investment Advisory Services, LLC | 270 | 0.00 | 12 | 0.00 | ||||
| 2025-08-01 | 13F | Gwn Securities Inc. | 0 | -100.00 | 0 | |||||
| 2025-07-10 | 13F | Wealth Enhancement Advisory Services, Llc | 45,455 | -5.61 | 2,128 | -4.32 | ||||
| 2025-07-22 | 13F | Accel Wealth Management | 6,678 | 0.77 | 304 | -0.33 | ||||
| 2025-06-24 | NP | TNQIX - 1290 Retirement 2055 Fund Class I | 2,033 | 0.00 | 91 | -6.25 | ||||
| 2025-05-15 | 13F | Harvest Investment Services, LLC | 0 | -100.00 | 0 | |||||
| 2025-07-23 | 13F | Steel Peak Wealth Management LLC | 14,608 | 9.10 | 665 | 7.61 | ||||
| 2025-07-14 | 13F | Painted Porch Advisors LLC | 2,004 | -9.32 | 91 | -10.78 | ||||
| 2025-07-21 | 13F | Future Financial Wealth Managment LLC | 228 | 0.00 | 10 | 0.00 | ||||
| 2025-07-10 | 13F | American Financial Advisors, LLC | 9,447 | -4.62 | 430 | -5.91 | ||||
| 2025-04-11 | 13F | Procyon Private Wealth Partners, LLC | 0 | -100.00 | 0 | |||||
| 2025-08-14 | 13F | Raymond James Financial Inc | 27,028 | 2.68 | 1,231 | 1.32 | ||||
| 2025-07-24 | 13F | Blair William & Co/il | 42 | 0.00 | 2 | 0.00 | ||||
| 2025-07-30 | 13F | IMG Wealth Management, Inc. | 832 | 0.00 | 38 | -2.63 | ||||
| 2025-08-14 | 13F | Fmr Llc | 46 | -93.64 | 2 | -93.94 | ||||
| 2025-07-28 | 13F | Harbour Investments, Inc. | 58,431 | 1.74 | 2,662 | 0.38 | ||||
| 2025-08-05 | 13F | GHP Investment Advisors, Inc. | 200 | 0.00 | 9 | 0.00 | ||||
| 2025-09-04 | 13F/A | Advisor Group Holdings, Inc. | 21,925 | -10.39 | 999 | -11.59 | ||||
| 2025-08-07 | 13F | Allworth Financial LP | 19 | 0.00 | 1 | |||||
| 2025-06-24 | NP | TNWIX - 1290 Retirement 2050 Fund Class I | 1,982 | 0.00 | 89 | -6.38 | ||||
| 2025-05-01 | 13F | Quest 10 Wealth Builders, Inc. | 0 | -100.00 | 0 | |||||
| 2025-08-12 | 13F | Jpmorgan Chase & Co | 0 | -100.00 | 0 | |||||
| 2025-08-12 | 13F | AlphaCore Capital LLC | 150 | 7 | ||||||
| 2025-08-14 | 13F | Sunbelt Securities, Inc. | 5 | 0.00 | 0 | |||||
| 2025-08-14 | 13F | GWM Advisors LLC | 7,841 | 0.19 | 357 | -1.11 | ||||
| 2025-04-17 | 13F | Pacific Sun Financial Corp | 0 | -100.00 | 0 | |||||
| 2025-07-07 | 13F | Roxbury Financial LLC | 164 | 0.61 | 7 | 0.00 | ||||
| 2025-08-18 | 13F | Geneos Wealth Management Inc. | 6,026 | -1.16 | 274 | -2.49 | ||||
| 2025-08-15 | 13F | Kestra Advisory Services, LLC | 6,036 | -20.25 | 275 | -21.49 | ||||
| 2025-08-15 | 13F | Equitable Holdings, Inc. | 0 | -100.00 | 0 | |||||
| 2025-08-14 | 13F | Comerica Bank | 2,719 | 0.00 | 124 | -1.60 | ||||
| 2025-08-08 | 13F | Pnc Financial Services Group, Inc. | 761 | -72.78 | 35 | -73.64 | ||||
| 2025-08-12 | 13F | SRS Capital Advisors, Inc. | 473 | 0.42 | 22 | 0.00 | ||||
| 2025-08-14 | 13F | 10Elms LLP | 708 | -30.31 | 32 | -30.43 | ||||
| 2025-07-31 | 13F | Sage Mountain Advisors LLC | 6,750 | 0.00 | 307 | -1.29 | ||||
| 2025-08-11 | 13F | Wbi Investments, Inc. | 8,492 | 18.72 | 387 | 16.97 | ||||
| 2025-05-15 | 13F | Two Sigma Securities, Llc | 0 | -100.00 | 0 | |||||
| 2025-06-24 | NP | TNIIX - 1290 Retirement 2020 Fund Class I | 231 | 0.00 | 10 | -9.09 | ||||
| 2025-08-04 | 13F | HBK Sorce Advisory LLC | 6,675 | -30.76 | 304 | -31.69 | ||||
| 2025-07-10 | 13F | Sovran Advisors, LLC | 5,314 | 246 | ||||||
| 2025-06-24 | NP | TNLIX - 1290 Retirement 2035 Fund Class I | 757 | 0.00 | 34 | -8.33 | ||||
| 2025-08-12 | 13F | Global Retirement Partners, LLC | 4,540 | 0.73 | 207 | -2.83 | ||||
| 2025-05-16 | 13F/A | Kestra Investment Management, LLC | 0 | -100.00 | 0 | |||||
| 2025-08-12 | 13F | Steward Partners Investment Advisory, Llc | 1,685 | -5.60 | 77 | -7.32 | ||||
| 2025-08-14 | 13F | Mercer Global Advisors Inc /adv | 42,623 | -9.07 | 1,941 | -10.30 | ||||
| 2025-07-22 | 13F | McNaughton Wealth Management, LLC | 6,569 | 0.00 | 299 | -1.32 | ||||
| 2025-07-30 | 13F | Brookstone Capital Management | 201,484 | -5.40 | 9,178 | -6.68 | ||||
| 2025-08-13 | 13F | Rsm Us Wealth Management Llc | 5,463 | -17.20 | 249 | -18.42 | ||||
| 2025-08-14 | 13F | Snowden Capital Advisors LLC | 24,143 | 3.14 | 1,100 | 1.76 | ||||
| 2025-08-14 | 13F | Avant Capital LLC | 5,669 | -0.79 | 258 | -1.90 | ||||
| 2025-08-14 | 13F | Bank Of America Corp /de/ | 202,000 | 86.61 | 9,201 | 84.09 | ||||
| 2025-04-22 | 13F/A | NorthRock Partners, LLC | 0 | -100.00 | 0 | -100.00 | ||||
| 2025-08-12 | 13F | LPL Financial LLC | 239,598 | 4.32 | 10,914 | 2.90 | ||||
| 2025-08-13 | 13F | Russell Investments Group, Ltd. | 28 | 1 | ||||||
| 2025-08-14 | 13F | Mariner, LLC | 7,684 | 1.04 | 350 | -0.57 | ||||
| 2025-08-06 | 13F | AE Wealth Management LLC | 71 | 208.70 | 3 | 200.00 | ||||
| 2025-05-16 | 13F | Laidlaw Wealth Management LLC | 0 | -100.00 | 0 | |||||
| 2025-07-17 | 13F | Eagle Bluffs Wealth Management LLC | 86,617 | 0.99 | 3,945 | -0.38 | ||||
| 2025-07-11 | 13F | Farther Finance Advisors, LLC | 1,543 | 1.45 | 70 | 0.00 | ||||
| 2025-08-06 | 13F | Destiny Capital Corp/CO | 5,476 | 0.00 | 249 | -1.19 | ||||
| 2025-08-13 | 13F | Transce3nd, LLC | 825 | -4.73 | 38 | -5.13 | ||||
| 2025-07-14 | 13F | Southland Equity Partners LLC | 0 | -100.00 | 0 | |||||
| 2025-08-12 | 13F | SlateStone Wealth, LLC | 7,196 | -3.18 | 0 | |||||
| 2025-08-13 | 13F | SageView Advisory Group, LLC | 4,606 | -0.90 | 210 | -2.34 | ||||
| 2025-07-25 | 13F | Sequoia Financial Advisors, LLC | 30,985 | -66.46 | 1,411 | -66.92 | ||||
| 2025-08-12 | 13F | Jaffetilchin Investment Partners, LLC | 4,646 | 0.67 | 212 | -0.94 | ||||
| 2025-07-25 | 13F | Cwm, Llc | 2,574 | -12.75 | 0 | |||||
| 2025-08-14 | 13F | Wells Fargo & Company/mn | 109,954 | -4.58 | 5,008 | -5.86 | ||||
| 2025-08-13 | 13F | Jones Financial Companies Lllp | 44,536 | 32.74 | 2,031 | 32.16 | ||||
| 2025-05-08 | 13F | BRYN MAWR TRUST Co | 0 | -100.00 | 0 | |||||
| 2025-08-13 | 13F | Northwestern Mutual Wealth Management Co | 15,005 | 18.09 | 683 | 16.55 | ||||
| 2025-08-12 | 13F | Virtu Financial LLC | 21,747 | 1 | ||||||
| 2025-06-24 | NP | TNJIX - 1290 Retirement 2025 Fund Class I | 49 | -14.04 | 2 | 0.00 | ||||
| 2025-07-23 | 13F | Armbruster Capital Management, Inc. | 223,270 | 5.97 | 10,170 | 4.53 | ||||
| 2025-08-14 | 13F | Ameriprise Financial Inc | 21,411 | 12.40 | 975 | 10.92 | ||||
| 2025-07-17 | 13F | Symmetry Partners, LLC | 7,380 | 36.44 | 336 | 34.94 | ||||
| 2025-08-14 | 13F | Stifel Financial Corp | 5,022 | 13.47 | 229 | 11.76 | ||||
| 2025-07-17 | 13F | Sound Income Strategies, LLC | 12 | -72.73 | 1 | -100.00 | ||||
| 2025-08-11 | 13F | Citigroup Inc | 0 | -100.00 | 0 | |||||
| 2025-06-24 | NP | TNKIX - 1290 Retirement 2030 Fund Class I | 620 | 0.00 | 28 | -6.90 | ||||
| 2025-05-06 | 13F | Assetmark, Inc | 0 | -100.00 | 0 | |||||
| 2025-07-24 | 13F | Ronald Blue Trust, Inc. | 37 | 0.00 | 2 | 0.00 | ||||
| 2025-08-08 | 13F | Sculati Wealth Management, LLC | 64,571 | -67.44 | 2,941 | -67.88 | ||||
| 2025-08-14 | 13F | Royal Bank Of Canada | 67,496 | -1.24 | 3,074 | -2.60 | ||||
| 2025-08-14 | 13F | Susquehanna International Group, Llp | 22,028 | 1,003 | ||||||
| 2025-07-31 | 13F | Cambridge Investment Research Advisors, Inc. | 11,873 | -0.53 | 1 | |||||
| 2025-08-06 | 13F | Adviser Investments LLC | 0 | -100.00 | 0 | |||||
| 2025-06-24 | NP | TNOIX - 1290 Retirement 2045 Fund Class I | 1,785 | 0.00 | 80 | -7.06 | ||||
| 2025-08-12 | 13F | PSI Advisors, LLC | 0 | -100.00 | 0 | |||||
| 2025-07-17 | 13F | Vermillion Wealth Management, Inc. | 36 | 0.00 | 2 | 0.00 | ||||
| 2025-08-01 | 13F | Envestnet Asset Management Inc | 56,910 | 1.53 | 2,592 | 0.15 | ||||
| 2025-08-08 | 13F | Larson Financial Group LLC | 21 | 0.00 | 1 | |||||
| 2025-08-06 | 13F | Golden State Wealth Management, LLC | 180 | -20.35 | 8 | -20.00 | ||||
| 2025-07-16 | 13F/A | CX Institutional | 316 | 0.00 | 0 | |||||
| 2025-07-31 | 13F | Jackson Hole Capital Partners, LLC | 1,922 | 0.00 | 88 | -1.14 | ||||
| 2025-08-12 | 13F | O'shaughnessy Asset Management, Llc | 1 | 0.00 | 0 | |||||
| 2025-05-16 | 13F | Coppell Advisory Solutions LLC | 0 | -100.00 | 0 | |||||
| 2025-07-23 | 13F | Venturi Wealth Management, LLC | 245,703 | 11,192 | ||||||
| 2025-08-08 | 13F | Cetera Investment Advisers | 35,384 | 1.91 | 1,612 | 0.50 | ||||
| 2025-08-12 | 13F | Proequities, Inc. | 0 | 0 | ||||||
| 2025-08-18 | 13F | Front Row Advisors LLC | 225 | 0.00 | 10 | 0.00 | ||||
| 2025-07-07 | 13F | RDA Financial Network | 5,803 | -19.41 | 264 | -20.48 | ||||
| 2025-07-21 | 13F | DHJJ Financial Advisors, Ltd. | 36 | 0.00 | 2 | 0.00 | ||||
| 2025-08-13 | 13F | Invesco Ltd. | 6,782 | 14.25 | 309 | 12.41 | ||||
| 2025-08-14 | 13F | Hrt Financial Lp | 0 | -100.00 | 0 | |||||
| 2025-05-20 | 13F | Belpointe Asset Management LLC | 0 | -100.00 | 0 | -100.00 | ||||
| 2025-07-11 | 13F | Pinnacle Bancorp, Inc. | 0 | -100.00 | 0 | |||||
| 2025-08-11 | 13F | Private Advisor Group, LLC | 29,657 | -2.79 | 1,351 | -4.12 | ||||
| 2025-08-14 | 13F | Two Sigma Investments, Lp | 61,300 | 68.87 | 2,792 | 66.59 | ||||
| 2025-07-14 | 13F | Ridgewood Investments LLC | 2,866 | 0.00 | 131 | -1.52 | ||||
| 2025-07-14 | 13F | U.S. Capital Wealth Advisors, LLC | 45,387 | 26.31 | 2,067 | 24.59 | ||||
| 2025-08-04 | 13F | Spire Wealth Management | 0 | -100.00 | 0 | |||||
| 2025-08-14 | 13F | UBS Group AG | 222,473 | 4.23 | 10,134 | 2.82 | ||||
| 2025-08-04 | 13F | Arkadios Wealth Advisors | 12,063 | -1.55 | 549 | -2.83 | ||||
| 2025-06-24 | NP | TNNIX - 1290 Retirement 2040 Fund Class I | 1,577 | 0.00 | 71 | -6.67 | ||||
| 2025-07-31 | 13F | City State Bank | 426 | 0.00 | 19 | 0.00 | ||||
| 2025-08-05 | 13F | Huntington National Bank | 0 | |||||||
| 2025-05-05 | 13F | Lindbrook Capital, Llc | 167 | 0.00 | 8 | 0.00 | ||||
| 2025-07-29 | 13F | Private Trust Co Na | 2,709 | 0.00 | 123 | -1.60 | ||||
| 2025-08-12 | 13F | Laurel Wealth Advisors LLC | 593 | 4,461.54 | 0 | |||||
| 2025-08-15 | 13F | Morgan Stanley | 131,701 | -2.47 | 5,999 | -3.79 | ||||
| 2025-04-14 | 13F | Miracle Mile Advisors, LLC | 0 | -100.00 | 0 | -100.00 | ||||
| 2025-08-12 | 13F | MAI Capital Management | 377 | 0.00 | 17 | 0.00 | ||||
| 2025-08-14 | 13F | Mml Investors Services, Llc | 0 | -100.00 | 0 | |||||
| 2025-08-08 | 13F | Avantax Advisory Services, Inc. | 18,576 | 0.56 | 846 | -0.82 | ||||
| 2025-08-14 | 13F | Jane Street Group, Llc | 0 | -100.00 | 0 | |||||
| 2025-07-30 | 13F | Bogart Wealth, LLC | 73 | 1.39 | 3 | 0.00 | ||||
| 2025-04-28 | 13F | Strategic Financial Concepts, LLC | 0 | -100.00 | 0 | -100.00 | ||||
| 2025-08-08 | 13F | Kingsview Wealth Management, LLC | 10,136 | -2.65 | 462 | -3.96 | ||||
| 2025-08-08 | 13F | Cedar Wealth Management, LLC | 167 | 0.00 | 8 | 0.00 |