Mga Batayang Estadistika
| Pemilik Institusional | 94 total, 94 long only, 0 short only, 0 long/short - change of -5.05% MRQ |
| Harga Saham | 4.44 |
| Alokasi Portofolio Rata-rata | 0.2274 % - change of 3.57% MRQ |
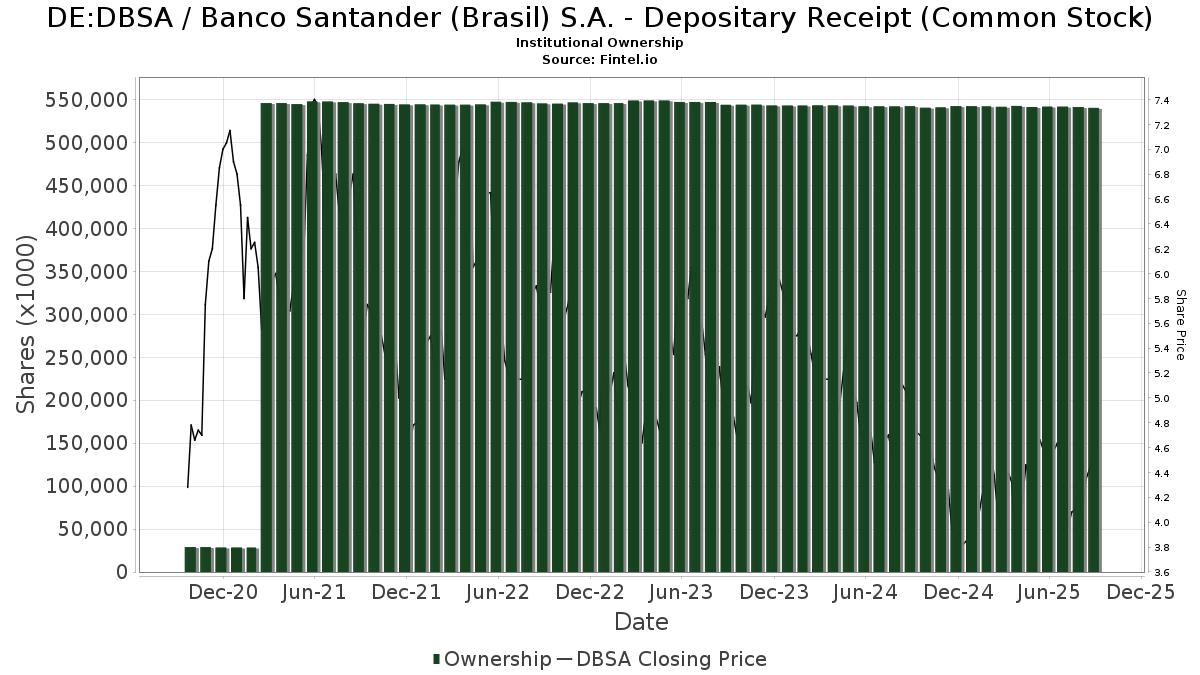
| Saham Institusional (Jangka Panjang) | 540,309,402 (ex 13D/G) - change of -1.44MM shares -0.27% MRQ |
| Nilai Institusional (Jangka Panjang) | $ 2,942,782 USD ($1000) |
Kepemilikan Institusional dan Pemegang Saham
Banco Santander (Brasil) S.A. - Depositary Receipt (Common Stock) (DE:DBSA) memiliki 94 pemilik institusional dan pemegang saham yang telah mengajukan formulir 13D/G atau 13F kepada Komisi Bursa Efek (Securities Exchange Commission/SEC). Lembaga-lembaga ini memegang total 540,309,402 saham. Pemegang saham terbesar meliputi Banco Santander, S.A., Macquarie Group Ltd, Vanguard Group Inc, VEIEX - Vanguard Emerging Markets Stock Index Fund Investor Shares, DEMAX - Delaware Emerging Markets Fund Class A, Arrowstreet Capital, Limited Partnership, FRDM - Freedom 100 Emerging Markets ETF, BlackRock, Inc., Morgan Stanley, and Wellington Management Group Llp .
Struktur kepemilikan institusional Banco Santander (Brasil) S.A. - Depositary Receipt (Common Stock) (DB:DBSA) menunjukkan posisi terkini di perusahaan oleh institusi dan dana, serta perubahan terbaru dalam ukuran posisi. Pemegang saham utama dapat mencakup investor individu, reksa dana, dana lindung nilai, atau institusi. Jadwal 13D menunjukkan bahwa investor memegang (atau pernah memegang) lebih dari 5% saham perusahaan dan bermaksud (atau pernah bermaksud) untuk secara aktif mengejar perubahan strategi bisnis. Jadwal 13G menunjukkan investasi pasif lebih dari 5%.
The share price as of September 5, 2025 is 4.44 / share. Previously, on September 6, 2024, the share price was 5.10 / share. This represents a decline of 12.94% over that period.
Skor Sentimen Dana
Skor Sentimen Dana (sebelumnya dikenal sebagai Skor Akumulasi Kepemilikan) menemukan saham-saham yang paling banyak dibeli oleh dana. Ini adalah hasil dari model kuantitatif multi-faktor yang canggih yang mengidentifikasi perusahaan dengan tingkat akumulasi institusional tertinggi. Model penilaian menggunakan kombinasi dari total peningkatan pemilik yang diungkapkan, perubahan dalam alokasi portofolio pada pemilik tersebut, dan metrik lainnya. Angka berkisar dari 0 hingga 100, dengan angka yang lebih tinggi menunjukkan tingkat akumulasi yang lebih tinggi dibandingkan dengan perusahaan sejenisnya, dan 50 adalah rata-ratanya.
Frekuensi Pembaruan: Setiap Hari
Lihat Ownership Explorer, yang menyediakan daftar perusahaan dengan peringkat tertinggi.
Pengajuan 13F dan NPORT
Detail pada pengajuan 13F tersedia gratis. Detail pada pengajuan NP memerlukan keanggotaan premium. Baris berwarna hijau menunjukkan posisi baru. Baris berwarna merah menunjukkan posisi yang sudah ditutup. Klik tautan ini ikon untuk melihat riwayat transaksi selengkapnya.
Tingkatkan
untuk membuka data premium dan mengekspor ke Excel ![]() .
.
| Tanggal File | Sumber | Investor | Ketik | Presyo ng Avg (Silangan) |
Saham | Δ Saham (%) |
Dilaporkan Nilai ($1000) |
Nilai Δ (%) |
Alokasi Port (%) |
|
|---|---|---|---|---|---|---|---|---|---|---|
| 2025-08-04 | 13F | Spire Wealth Management | 2,046 | 0.00 | 11 | 22.22 | ||||
| 2025-08-14 | 13F | Aqr Capital Management Llc | 16,121 | 88 | ||||||
| 2025-08-14 | 13F | Verition Fund Management LLC | 71,540 | 390 | ||||||
| 2025-07-07 | 13F | Northwest & Ethical Investments L.P. | 0 | -100.00 | 0 | -100.00 | ||||
| 2025-08-14 | 13F | Two Sigma Investments, Lp | 118,202 | -71.62 | 644 | -67.18 | ||||
| 2025-07-28 | NP | AVSE - Avantis Responsible Emerging Markets Equity ETF | 9,393 | 68.12 | 49 | 100.00 | ||||
| 2025-08-14 | 13F | Engineers Gate Manager LP | 18,910 | 40.91 | 103 | 63.49 | ||||
| 2025-08-13 | 13F | EverSource Wealth Advisors, LLC | 2,789 | 4,792.98 | 15 | |||||
| 2025-08-12 | 13F | MAI Capital Management | 927 | 5 | ||||||
| 2025-07-30 | NP | APIE - ActivePassive International Equity ETF | 13,823 | 72 | ||||||
| 2025-08-05 | 13F | Simplex Trading, Llc | Call | 100 | -90.00 | 0 | ||||
| 2025-06-26 | NP | DFAE - Dimensional Emerging Core Equity Market ETF | 7,200 | 0.00 | 38 | 15.63 | ||||
| 2025-08-05 | 13F | NewSquare Capital LLC | 134 | 0.00 | 1 | |||||
| 2025-07-14 | 13F | GAMMA Investing LLC | 20,256 | 27.52 | 110 | 48.65 | ||||
| 2025-05-14 | 13F | EntryPoint Capital, LLC | 0 | -100.00 | 0 | |||||
| 2025-07-24 | 13F | Us Bancorp \de\ | 2,602 | 0.00 | 14 | 16.67 | ||||
| 2025-07-21 | 13F | Mirae Asset Global Investments Co., Ltd. | 13,126 | 8.18 | 72 | 24.56 | ||||
| 2025-08-12 | 13F | SRS Capital Advisors, Inc. | 149 | 0.00 | 1 | |||||
| 2025-08-14 | 13F | Hrt Financial Lp | 0 | -100.00 | 0 | |||||
| 2025-08-12 | 13F | Dimensional Fund Advisors Lp | 112,963 | 56.13 | 616 | 80.88 | ||||
| 2025-08-13 | 13F | Invesco Ltd. | 206,851 | 9.71 | 1,127 | 26.91 | ||||
| 2025-05-15 | 13F | Qube Research & Technologies Ltd | 0 | -100.00 | 0 | |||||
| 2025-08-26 | NP | Delaware Vip Trust - Delaware Vip Emerging Markets Series Standard Class | 153,366 | 0.00 | 836 | 15.65 | ||||
| 2025-08-08 | 13F | SBI Securities Co., Ltd. | 1,587 | -71.07 | 9 | -68.00 | ||||
| 2025-05-14 | 13F | Banco BTG Pactual S.A. | 0 | -100.00 | 0 | -100.00 | ||||
| 2025-08-01 | 13F | Banco Santander, S.A. | 520,218,168 | 0.00 | 2,835,189 | 15.71 | ||||
| 2025-08-14 | 13F | Citadel Advisors Llc | Call | 0 | -100.00 | 0 | ||||
| 2025-05-14 | 13F | Itau Unibanco Holding S.A. | 0 | -100.00 | 0 | |||||
| 2025-05-15 | 13F | Jain Global LLC | 0 | -100.00 | 0 | |||||
| 2025-08-14 | 13F | Two Sigma Securities, Llc | 16,320 | 89 | ||||||
| 2025-06-26 | NP | DFSE - Dimensional Emerging Markets Sustainability Core 1 ETF | 12,532 | 0.00 | 66 | 16.07 | ||||
| 2025-08-01 | 13F | May Hill Capital, LLC | 0 | -100.00 | 0 | |||||
| 2025-08-11 | 13F | Vanguard Group Inc | 3,101,965 | 0.00 | 16,906 | 15.71 | ||||
| 2025-08-14 | 13F/A | Skopos Labs, Inc. | 7,958 | -47.42 | 43 | -39.44 | ||||
| 2025-07-30 | 13F | Drive Wealth Management, Llc | 14,270 | 8.92 | 78 | 26.23 | ||||
| 2025-06-25 | NP | IEMGX - Voya Multi-Manager Emerging Markets Equity Fund Class I | 51,776 | -11.46 | 272 | 3.42 | ||||
| 2025-08-15 | 13F | Morgan Stanley | 848,263 | 684.12 | 4,623 | 808.25 | ||||
| 2025-08-08 | 13F | Pnc Financial Services Group, Inc. | 229 | -67.88 | 1 | -66.67 | ||||
| 2025-07-31 | 13F | R Squared Ltd | 21,000 | -14.60 | 114 | -0.87 | ||||
| 2025-08-11 | 13F | Principal Securities, Inc. | 0 | -100.00 | 0 | |||||
| 2025-08-13 | 13F | Quadrant Capital Group Llc | 0 | -100.00 | 0 | |||||
| 2025-08-13 | 13F | Northern Trust Corp | 23,987 | 13.65 | 131 | 31.31 | ||||
| 2025-08-12 | 13F | Deutsche Bank Ag\ | 260,000 | 0.00 | 1,417 | 15.77 | ||||
| 2025-08-14 | 13F | VPR Management LLC | 157,930 | 0.00 | 861 | 15.75 | ||||
| 2025-05-13 | 13F | Russell Investments Group, Ltd. | 0 | -100.00 | 0 | |||||
| 2025-08-14 | 13F | Vident Advisory, LLC | 0 | -100.00 | 0 | |||||
| 2025-08-14 | 13F | Bnp Paribas Arbitrage, Sa | 57,974 | 3,302.23 | 316 | 3,837.50 | ||||
| 2025-08-14 | 13F | Millennium Management Llc | 11,781 | 64 | ||||||
| 2025-06-26 | NP | DFEM - Dimensional Emerging Markets Core Equity 2 ETF | 3,112 | 0.00 | 16 | 14.29 | ||||
| 2025-08-12 | 13F | Jpmorgan Chase & Co | 642 | -99.81 | 4 | -99.81 | ||||
| 2025-08-13 | 13F | Marshall Wace, Llp | 0 | -100.00 | 0 | |||||
| 2025-08-06 | 13F | Savant Capital, LLC | 22,507 | 123 | ||||||
| 2025-08-29 | NP | MPLAX - Praxis International Index Fund Class A | 65,143 | 0.00 | 355 | 16.01 | ||||
| 2025-07-25 | NP | DEMAX - Delaware Emerging Markets Fund Class A | 2,751,128 | 0.00 | 14,306 | 19.27 | ||||
| 2025-08-07 | 13F | Connor, Clark & Lunn Investment Management Ltd. | 12,759 | 70 | ||||||
| 2025-08-14 | 13F | Mariner, LLC | 118,671 | 43.58 | 647 | 66.07 | ||||
| 2025-08-14 | 13F/A | Barclays Plc | 45,798 | 0 | ||||||
| 2025-07-24 | 13F | Jfs Wealth Advisors, Llc | 521 | 25.85 | 3 | 100.00 | ||||
| 2025-08-13 | 13F | Townsquare Capital Llc | 0 | -100.00 | 0 | |||||
| 2025-06-25 | NP | VVIFX - Voya VACS Series EME Fund | 64,528 | 0.00 | 339 | 16.49 | ||||
| 2025-07-08 | 13F | Parallel Advisors, LLC | 0 | -100.00 | 0 | |||||
| 2025-08-06 | 13F | Prospera Financial Services Inc | 127,365 | -2.35 | 694 | 13.03 | ||||
| 2025-08-13 | 13F | Guggenheim Capital Llc | 14,835 | -1.39 | 81 | 14.29 | ||||
| 2025-08-13 | 13F/A | StoneX Group Inc. | 0 | -100.00 | 0 | -100.00 | ||||
| 2025-07-28 | NP | AVEM - Avantis Emerging Markets Equity ETF This fund is a listed as child fund of American Century Companies Inc and if that institution has disclosed ownership in this security, then these positions will not be double counted when calculating total shares and total value | 678,222 | 24.58 | 3,527 | 48.59 | ||||
| 2025-08-14 | 13F | Goldman Sachs Group Inc | 201,989 | -16.52 | 1,101 | -3.42 | ||||
| 2025-07-28 | NP | AVXC - Avantis Emerging Markets ex-China Equity ETF | 7,129 | 37.49 | 37 | 68.18 | ||||
| 2025-07-15 | 13F | Public Employees Retirement System Of Ohio | 11,617 | 48.86 | 63 | 75.00 | ||||
| 2025-08-13 | 13F | Jump Financial, LLC | 41,907 | -43.62 | 228 | -34.86 | ||||
| 2025-08-15 | 13F | Tower Research Capital LLC (TRC) | 453 | -91.73 | 2 | -92.00 | ||||
| 2025-08-14 | 13F | Schonfeld Strategic Advisors LLC | 0 | -100.00 | 0 | |||||
| 2025-08-11 | 13F | Bell Investment Advisors, Inc | 2,568 | 43.95 | 14 | 62.50 | ||||
| 2025-08-12 | 13F | Rhumbline Advisers | 15,917 | 819.00 | 87 | 975.00 | ||||
| 2025-08-13 | 13F | Arrowstreet Capital, Limited Partnership | 2,526,757 | 5.06 | 13,771 | 21.57 | ||||
| 2025-08-14 | 13F | Bank Of America Corp /de/ | 291,643 | 50.51 | 1,589 | 74.23 | ||||
| 2025-07-28 | NP | AVEEX - Avantis Emerging Markets Equity Fund Institutional Class This fund is a listed as child fund of American Century Companies Inc and if that institution has disclosed ownership in this security, then these positions will not be double counted when calculating total shares and total value | 28,959 | 0.00 | 151 | 19.05 | ||||
| 2025-08-14 | 13F | Group One Trading, L.p. | 0 | -100.00 | 0 | |||||
| 2025-08-12 | 13F | O'shaughnessy Asset Management, Llc | 23,200 | 126 | ||||||
| 2025-08-14 | 13F | Sei Investments Co | 24,222 | 0.00 | 132 | 15.79 | ||||
| 2025-08-14 | 13F | Group One Trading, L.p. | Call | 0 | -100.00 | 0 | ||||
| 2025-08-12 | 13F | BlackRock, Inc. | 910,754 | 10.96 | 4,964 | 28.41 | ||||
| 2025-05-05 | 13F | Lindbrook Capital, Llc | 2,963 | 370.32 | 14 | 550.00 | ||||
| 2025-08-14 | 13F | Cubist Systematic Strategies, LLC | 0 | -100.00 | 0 | |||||
| 2025-08-14 | 13F | State Street Corp | 12,700 | 0.00 | 69 | 16.95 | ||||
| 2025-08-13 | 13F | Provida Pension Fund Administrator | 0 | -100.00 | 0 | -100.00 | ||||
| 2025-08-13 | 13F | Northwestern Mutual Wealth Management Co | 960 | 5 | ||||||
| 2025-08-14 | 13F | Wells Fargo & Company/mn | 4,725 | -31.85 | 26 | -21.87 | ||||
| 2025-08-04 | 13F | Hantz Financial Services, Inc. | 6,997 | 553.93 | 0 | |||||
| 2025-04-25 | NP | VCGEX - Emerging Economies Fund | 104,334 | 3.53 | 455 | 8.35 | ||||
| 2025-06-26 | NP | DEXC - Dimensional Emerging Markets ex China Core Equity ETF | 26,100 | 44.20 | 137 | 69.14 | ||||
| 2025-08-12 | 13F | Longfellow Investment Management Co Llc | 0 | -100.00 | 0 | |||||
| 2025-08-12 | 13F | American Century Companies Inc | 744,630 | 21.22 | 4,058 | 40.27 | ||||
| 2025-08-14 | 13F | Alliancebernstein L.p. | 163,947 | 894 | ||||||
| 2025-05-07 | 13F | LPL Financial LLC | 0 | -100.00 | 0 | |||||
| 2025-08-14 | 13F | Point72 Asset Management, L.P. | 261,860 | 120.42 | 1,427 | 155.28 | ||||
| 2025-06-30 | NP | VEIEX - Vanguard Emerging Markets Stock Index Fund Investor Shares | 3,101,965 | 0.00 | 16,316 | 16.63 | ||||
| 2025-08-14 | 13F | UBS Group AG | 118,100 | 147.72 | 644 | 187.05 | ||||
| 2025-05-14 | 13F | Hsbc Holdings Plc | 0 | -100.00 | 0 | |||||
| 2025-08-14 | 13F | Macquarie Group Ltd | 3,561,512 | -0.49 | 19,410 | 15.14 | ||||
| 2025-05-06 | 13F | Advisors Preferred, LLC | 0 | -100.00 | 0 | |||||
| 2025-07-18 | 13F | Robeco Institutional Asset Management B.V. | 0 | -100.00 | 0 | |||||
| 2025-08-12 | 13F | SPX Equities Gestao de Recursos Ltda | 0 | -100.00 | 0 | |||||
| 2025-08-04 | 13F | Assetmark, Inc | 14 | 0 | ||||||
| 2025-05-15 | 13F | Citadel Advisors Llc | Put | 0 | -100.00 | 0 | -100.00 | |||
| 2025-08-13 | 13F | Cerity Partners LLC | 16,354 | -46.58 | 89 | -38.19 | ||||
| 2025-08-13 | 13F | Renaissance Technologies Llc | 0 | -100.00 | 0 | |||||
| 2025-07-22 | 13F | Checchi Capital Advisers, LLC | 14,796 | 0.00 | 81 | 15.94 | ||||
| 2025-04-30 | 13F | Allworth Financial LP | 0 | -100.00 | 0 | |||||
| 2025-06-26 | NP | DFEV - Dimensional Emerging Markets Value ETF | 600 | 0.00 | 3 | 50.00 | ||||
| 2025-08-11 | 13F | Cordatus Wealth Management LLC | 126,733 | -2.36 | 1 | |||||
| 2025-08-14 | 13F | Jane Street Group, Llc | 0 | -100.00 | 0 | |||||
| 2025-08-14 | 13F | Citadel Advisors Llc | 19,934 | -89.88 | 109 | -88.35 | ||||
| 2025-08-29 | NP | FRDM - Freedom 100 Emerging Markets ETF | 1,276,577 | 16.76 | 6,957 | 35.11 | ||||
| 2025-08-14 | 13F | Headlands Technologies LLC | 232 | -27.27 | 1 | 0.00 | ||||
| 2025-08-14 | 13F | Aquatic Capital Management LLC | 84,539 | 82.86 | 461 | 111.98 | ||||
| 2025-07-11 | 13F | Farther Finance Advisors, LLC | 325 | 0.93 | 2 | 0.00 | ||||
| 2025-07-14 | 13F | UMA Financial Services, Inc. | 252 | 0.00 | 1 | 0.00 | ||||
| 2025-07-16 | 13F | Signaturefd, Llc | 10,140 | 2.71 | 55 | 19.57 | ||||
| 2025-08-14 | 13F | Wellington Management Group Llp | 749,206 | -53.35 | 4,083 | -46.02 | ||||
| 2025-07-31 | 13F | Caitong International Asset Management Co., Ltd | 733 | -2.79 | 4 | 0.00 | ||||
| 2025-08-14 | 13F | Two Sigma Advisers, Lp | 39,600 | -85.56 | 216 | -83.35 | ||||
| 2025-08-07 | 13F | Vise Technologies, Inc. | 17,253 | 94 | ||||||
| 2025-08-14 | 13F | Susquehanna International Group, Llp | 0 | -100.00 | 0 | |||||
| 2025-08-08 | 13F | Larson Financial Group LLC | 506 | 3 | ||||||
| 2025-05-21 | 13F | Acadian Asset Management Llc | 0 | -100.00 | 0 | -100.00 | ||||
| 2025-05-29 | 13F/A | Legal & General Group Plc | 76,800 | 0.00 | 380 | -13.47 | ||||
| 2025-08-12 | 13F | Proequities, Inc. | Put | 0 | 0 | |||||
| 2025-08-12 | 13F | Proequities, Inc. | Call | 0 | 0 | |||||
| 2025-08-12 | 13F | Proequities, Inc. | 0 | 0 | ||||||
| 2025-07-28 | NP | NSI - National Security Emerging Markets Index ETF | 3,017 | 38.59 | 16 | 66.67 | ||||
| 2025-09-04 | 13F/A | Advisor Group Holdings, Inc. | 1,660 | 9 | ||||||
| 2025-08-12 | 13F | XTX Topco Ltd | 0 | -100.00 | 0 |