Mga Batayang Estadistika
| Pemilik Institusional | 154 total, 154 long only, 0 short only, 0 long/short - change of 1.30% MRQ |
| Alokasi Portofolio Rata-rata | 0.3494 % - change of -34.53% MRQ |
| Saham Institusional (Jangka Panjang) | 66,144,575 (ex 13D/G) - change of 8.73MM shares 15.21% MRQ |
| Nilai Institusional (Jangka Panjang) | $ 1,345,479 USD ($1000) |
Kepemilikan Institusional dan Pemegang Saham
abrdn ETFs - abrdn Bloomberg All Commodity Strategy K-1 Free ETF (US:BCI) memiliki 154 pemilik institusional dan pemegang saham yang telah mengajukan formulir 13D/G atau 13F kepada Komisi Bursa Efek (Securities Exchange Commission/SEC). Lembaga-lembaga ini memegang total 66,144,575 saham. Pemegang saham terbesar meliputi Wells Fargo & Company/mn, Sei Investments Co, Metis Global Partners, LLC, Bank Of America Corp /de/, Morgan Stanley, Nepc Llc, Northwestern Mutual Wealth Management Co, Royal Bank Of Canada, Great Lakes Advisors, Llc, and Lockheed Martin Investment Management Co .
Struktur kepemilikan institusional abrdn ETFs - abrdn Bloomberg All Commodity Strategy K-1 Free ETF (ARCA:BCI) menunjukkan posisi terkini di perusahaan oleh institusi dan dana, serta perubahan terbaru dalam ukuran posisi. Pemegang saham utama dapat mencakup investor individu, reksa dana, dana lindung nilai, atau institusi. Jadwal 13D menunjukkan bahwa investor memegang (atau pernah memegang) lebih dari 5% saham perusahaan dan bermaksud (atau pernah bermaksud) untuk secara aktif mengejar perubahan strategi bisnis. Jadwal 13G menunjukkan investasi pasif lebih dari 5%.
The share price as of September 5, 2025 is 20.99 / share. Previously, on September 9, 2024, the share price was 19.16 / share. This represents an increase of 9.52% over that period.

Skor Sentimen Dana
Skor Sentimen Dana (sebelumnya dikenal sebagai Skor Akumulasi Kepemilikan) menemukan saham-saham yang paling banyak dibeli oleh dana. Ini adalah hasil dari model kuantitatif multi-faktor yang canggih yang mengidentifikasi perusahaan dengan tingkat akumulasi institusional tertinggi. Model penilaian menggunakan kombinasi dari total peningkatan pemilik yang diungkapkan, perubahan dalam alokasi portofolio pada pemilik tersebut, dan metrik lainnya. Angka berkisar dari 0 hingga 100, dengan angka yang lebih tinggi menunjukkan tingkat akumulasi yang lebih tinggi dibandingkan dengan perusahaan sejenisnya, dan 50 adalah rata-ratanya.
Frekuensi Pembaruan: Setiap Hari
Lihat Ownership Explorer, yang menyediakan daftar perusahaan dengan peringkat tertinggi.
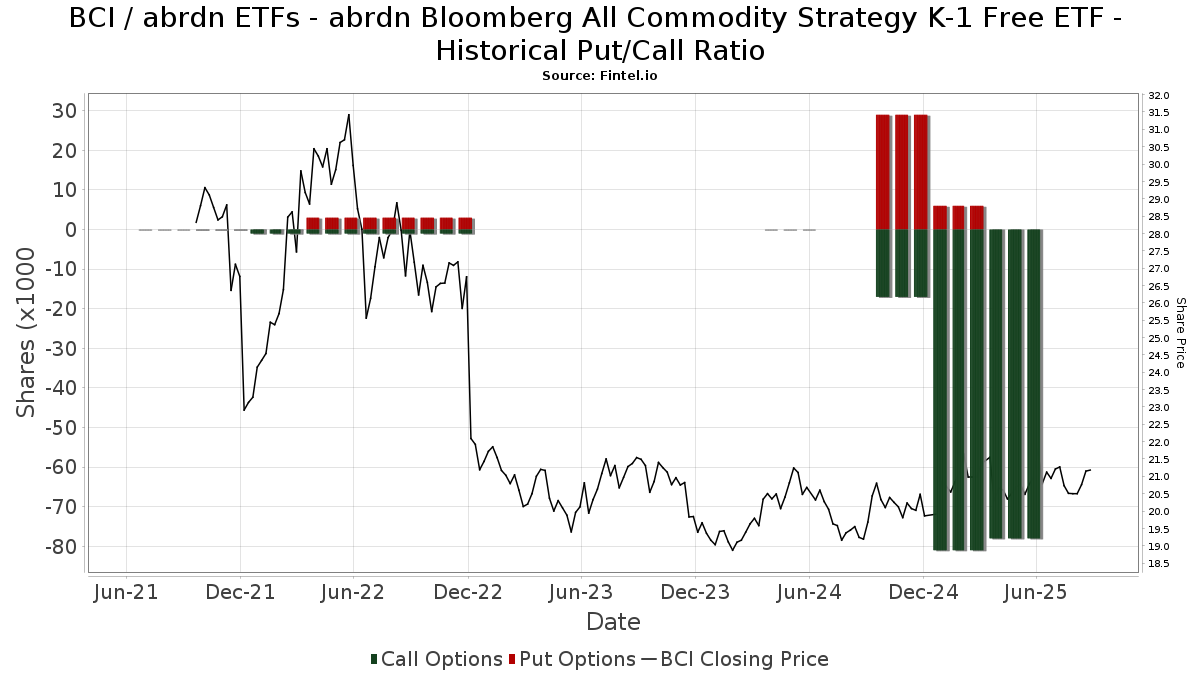
Rasio Put/Call Institusional
Selain melaporkan isu ekuitas dan utang standar, institusi dengan aset di bawah manajemen lebih dari 100 juta dolar AS juga harus mengungkapkan kepemilikan opsi put dan call mereka. Karena opsi put umumnya menunjukkan sentimen negatif, dan opsi call menunjukkan sentimen positif, kita dapat mengetahui sentimen institusional secara keseluruhan dengan memplot rasio put terhadap call. Grafik di sebelah kanan memplot rasio put/call historis untuk instrumen ini.
Menggunakan Rasio Put/Call sebagai indikator sentimen investor mengatasi salah satu kekurangan utama dari penggunaan total kepemilikan institusional, yaitu sejumlah besar aset yang dikelola diinvestasikan secara pasif untuk melacak indeks. Dana yang dikelola secara pasif biasanya tidak membeli opsi, sehingga indikator rasio put/call lebih akurat dalam melacak sentimen dana yang dikelola secara aktif.
Pengajuan 13F dan NPORT
Detail pada pengajuan 13F tersedia gratis. Detail pada pengajuan NP memerlukan keanggotaan premium. Baris berwarna hijau menunjukkan posisi baru. Baris berwarna merah menunjukkan posisi yang sudah ditutup. Klik tautan ini ikon untuk melihat riwayat transaksi selengkapnya.
Tingkatkan
untuk membuka data premium dan mengekspor ke Excel ![]() .
.
| Tanggal File | Sumber | Investor | Ketik | Presyo ng Avg (Silangan) |
Saham | Δ Saham (%) |
Dilaporkan Nilai ($1000) |
Nilai Δ (%) |
Alokasi Port (%) |
|
|---|---|---|---|---|---|---|---|---|---|---|
| 2025-08-25 | NP | NDAA - Ned Davis Research 360 Dynamic Allocation ETF | 6,163 | -72.10 | 128 | -72.94 | ||||
| 2025-08-12 | 13F | Aldebaran Capital, Llc | 150,053 | -1.55 | 3,117 | -4.71 | ||||
| 2025-08-12 | 13F | Steward Partners Investment Advisory, Llc | 5,094 | 950.31 | 106 | 950.00 | ||||
| 2025-08-25 | NP | MAINSTAY VP FUNDS TRUST - MainStay VP IQ Hedge Multi-Strategy Portfolio Initial Class | 26,687 | 554 | ||||||
| 2025-07-28 | 13F | Kiker Wealth Management, LLC | 300 | 0.00 | 6 | 0.00 | ||||
| 2025-08-14 | 13F | Smartleaf Asset Management LLC | 2,509 | 52 | ||||||
| 2025-08-14 | 13F | Susquehanna International Group, Llp | 0 | -100.00 | 0 | |||||
| 2025-08-12 | 13F | Accredited Wealth Management, LLC | 22,472 | 467 | ||||||
| 2025-05-05 | 13F | Private Advisor Group, LLC | 0 | -100.00 | 0 | |||||
| 2025-08-13 | 13F | Quadrature Capital Ltd | 207,686 | 4,313 | ||||||
| 2025-08-06 | 13F | Black Swift Group, LLC | 0 | -100.00 | 0 | |||||
| 2025-06-10 | NP | LFTEX - Lincoln Inflation Plus Fund Class I | 36,700 | 0.00 | 747 | -0.80 | ||||
| 2025-06-25 | NP | QAI - IQ Hedge Multi-Strategy Tracker ETF | 88,275 | 1,796 | ||||||
| 2025-08-14 | 13F | Sunbelt Securities, Inc. | 2,493 | 0.00 | 49 | -7.55 | ||||
| 2025-08-19 | NP | NORTHWESTERN MUTUAL SERIES FUND INC - Balanced Portfolio | 258,400 | 0.00 | 5,367 | -3.23 | ||||
| 2025-08-04 | 13F | AlphaStar Capital Management, LLC | 164,769 | 3,422 | ||||||
| 2025-08-08 | 13F | Hartland & Co., LLC | 300 | 0.00 | 6 | 0.00 | ||||
| 2025-07-25 | 13F | Concurrent Investment Advisors, LLC | 11,382 | 236 | ||||||
| 2025-07-22 | 13F | MBL Wealth, LLC | 17,424 | -7.22 | 362 | -10.20 | ||||
| 2025-08-07 | 13F | Fund Evaluation Group, LLC | 20,786 | 0.00 | 432 | -3.36 | ||||
| 2025-08-14 | 13F | Ancora Advisors, LLC | 14,700 | 0.00 | 305 | -3.17 | ||||
| 2025-08-07 | 13F | Cahill Financial Advisors Inc | 24,077 | -14.95 | 500 | -17.63 | ||||
| 2025-08-18 | 13F | Hollencrest Capital Management | 28,091 | -2.96 | 583 | -6.12 | ||||
| 2025-08-11 | 13F | United Advisor Group, LLC | 16,704 | 347 | ||||||
| 2025-08-06 | 13F | Csenge Advisory Group | 38,379 | 15.32 | 779 | 13.06 | ||||
| 2025-08-08 | 13F | Creative Planning | 46,137 | -0.19 | 958 | -3.43 | ||||
| 2025-08-14 | 13F | Mml Investors Services, Llc | 30,236 | 35.11 | 1 | |||||
| 2025-08-14 | 13F | UBS Group AG | 5,644 | -34.65 | 117 | -36.76 | ||||
| 2025-08-19 | NP | NORTHWESTERN MUTUAL SERIES FUND INC - Asset Allocation Portfolio | 46,500 | 0.00 | 966 | -3.21 | ||||
| 2025-08-14 | 13F | Wells Fargo & Company/mn | 25,317,919 | 37.02 | 525,853 | 32.61 | ||||
| 2025-04-30 | 13F | Allworth Financial LP | 0 | -100.00 | 0 | |||||
| 2025-07-25 | 13F | Cwm, Llc | 2,272 | 0.00 | 0 | |||||
| 2025-05-15 | 13F/A | Orion Portfolio Solutions, LLC | 97,847 | -5.49 | 2,100 | 2.69 | ||||
| 2025-09-04 | 13F/A | Advisor Group Holdings, Inc. | 3,071 | -29.47 | 64 | -32.26 | ||||
| 2025-08-18 | 13F | Geneos Wealth Management Inc. | 86,201 | -7.94 | 1,790 | -10.90 | ||||
| 2025-07-07 | 13F | Thurston, Springer, Miller, Herd & Titak, Inc. | 4,432 | 19.98 | 92 | 16.46 | ||||
| 2025-07-16 | 13F | ORG Partners LLC | 295 | 6 | ||||||
| 2025-08-07 | 13F | Vise Technologies, Inc. | 189,276 | -1.00 | 3,931 | 4.10 | ||||
| 2025-07-24 | 13F | Ronald Blue Trust, Inc. | 255,394 | 1.79 | 5,305 | -1.49 | ||||
| 2025-07-31 | 13F | Leavell Investment Management, Inc. | 229,861 | 8.39 | 4,774 | 4.90 | ||||
| 2025-08-04 | 13F | Center for Financial Planning, Inc. | 0 | -100.00 | 0 | |||||
| 2025-08-14 | 13F | Royal Bank Of Canada | 1,461,283 | 8.43 | 30,352 | 4.94 | ||||
| 2025-05-05 | 13F | Creekmur Asset Management LLC | 0 | -100.00 | 0 | |||||
| 2025-07-11 | 13F | Farther Finance Advisors, LLC | 1,742 | 97.95 | 36 | 100.00 | ||||
| 2025-04-14 | 13F | Park Avenue Securities Llc | 0 | -100.00 | 0 | |||||
| 2025-04-21 | 13F | Envestnet Portfolio Solutions, Inc. | 0 | -100.00 | 0 | |||||
| 2025-08-26 | NP | TBFC - The Brinsmere Fund - Conservative ETF | 226,990 | 2.68 | 4,715 | -0.63 | ||||
| 2025-07-21 | 13F | Abundance Wealth Counselors | 595,964 | -0.20 | 12 | 0.00 | ||||
| 2025-08-05 | 13F | Verity Asset Management, Inc. | 0 | -100.00 | 0 | |||||
| 2025-08-08 | 13F | Cetera Investment Advisers | 81,527 | -0.83 | 1,693 | -4.02 | ||||
| 2025-08-04 | 13F | Lockheed Martin Investment Management Co | 938,100 | -5.06 | 19,484 | -8.11 | ||||
| 2025-08-13 | 13F | Victory Financial Group, Llc | 38,298 | 5.23 | 795 | 1.53 | ||||
| 2025-07-30 | 13F | Exencial Wealth Advisors, Llc | 28,548 | -18.81 | 593 | -21.49 | ||||
| 2025-08-01 | 13F | Envestnet Asset Management Inc | 349,752 | -11.45 | 7,264 | -14.30 | ||||
| 2025-08-11 | 13F | Principal Securities, Inc. | 8,832 | -9.11 | 183 | -4.19 | ||||
| 2025-07-14 | 13F | GAMMA Investing LLC | 2,090 | 0.00 | 43 | -2.27 | ||||
| 2025-08-14 | 13F | Citadel Advisors Llc | Call | 78,500 | -3.80 | 1,630 | -6.91 | |||
| 2025-07-08 | 13F | Nbc Securities, Inc. | 4,278 | 1,577.65 | 0 | |||||
| 2025-08-13 | 13F | Truvestments Capital Llc | 0 | -100.00 | 0 | |||||
| 2025-05-06 | 13F | Lifeworks Advisors, LLC | 0 | -100.00 | 0 | -100.00 | ||||
| 2025-08-14 | 13F | Atomi Financial Group, Inc. | 13,801 | -35.06 | 287 | -37.28 | ||||
| 2025-08-07 | 13F | Winthrop Capital Management, LLC | 22,654 | 0 | ||||||
| 2025-07-16 | 13F | Diversified Enterprises, LLC | 13,028 | -14.88 | 271 | -17.68 | ||||
| 2025-08-08 | 13F | Crossmark Global Holdings, Inc. | 45,662 | -4.55 | 947 | -7.52 | ||||
| 2025-08-14 | 13F | Disciplina Capital Management LLC | 394,947 | 46.20 | 8,203 | 41.50 | ||||
| 2025-08-08 | 13F | Avantax Advisory Services, Inc. | 12,704 | -34.29 | 264 | -36.47 | ||||
| 2025-08-13 | 13F | Flow Traders U.s. Llc | 0 | -100.00 | 0 | |||||
| 2025-07-29 | 13F | Werba Rubin Papier Wealth Management | 42,484 | 14.83 | 882 | 11.22 | ||||
| 2025-08-08 | 13F | Mason Street Advisors, Llc | 304,900 | 0.00 | 6,333 | -3.22 | ||||
| 2025-08-13 | 13F | Russell Investments Group, Ltd. | 0 | 0 | ||||||
| 2025-08-06 | 13F | First Horizon Advisors, Inc. | 0 | -100.00 | 0 | |||||
| 2025-07-31 | 13F | Resonant Capital Advisors, LLC | 237,666 | -0.13 | 4,936 | -3.35 | ||||
| 2025-08-01 | 13F | Rossby Financial, LCC | 0 | -100.00 | 0 | |||||
| 2025-08-14 | 13F | Raymond James Financial Inc | 321,984 | 702.15 | 6,688 | 676.66 | ||||
| 2025-05-14 | 13F | Huntington National Bank | 5 | -33.33 | ||||||
| 2025-08-14 | 13F | Evergreen Wealth Solutions, LLC | 273,489 | 3.11 | 5,680 | -0.19 | ||||
| 2025-04-23 | 13F | Continuum Advisory, LLC | 0 | -100.00 | 0 | |||||
| 2025-08-08 | 13F | Cornerstone Advisors Asset Management, Inc | 22,712 | -21.21 | 472 | -23.79 | ||||
| 2025-08-14 | 13F | Wiley Bros.-aintree Capital, Llc | 17,770 | -0.79 | 363 | -4.99 | ||||
| 2025-07-24 | 13F | Us Bancorp \de\ | 1,176 | 115.78 | 24 | 118.18 | ||||
| 2025-07-18 | 13F | Truist Financial Corp | 254,562 | -12.82 | 5,287 | -15.62 | ||||
| 2025-08-13 | 13F | Renaissance Technologies Llc | 59,300 | 1,232 | ||||||
| 2025-08-12 | 13F | Global Retirement Partners, LLC | 41 | -91.13 | 1 | -100.00 | ||||
| 2025-08-14 | 13F | CoreCap Advisors, LLC | 9 | -87.84 | 0 | -100.00 | ||||
| 2025-08-27 | 13F/A | Brinker Capital Investments, LLC | 91,922 | -6.06 | 1,909 | -9.05 | ||||
| 2025-08-13 | 13F | Mount Yale Investment Advisors, LLC | 12,525 | 260 | ||||||
| 2025-08-05 | 13F | C2P Capital Advisory Group, LLC d.b.a. Prosperity Capital Advisors | 0 | -100.00 | 0 | |||||
| 2025-07-23 | 13F | Austin Asset Management Co Inc | 29,638 | -0.10 | 616 | -3.30 | ||||
| 2025-08-13 | 13F | Financial & Tax Architects, LLC | 0 | -100.00 | 0 | |||||
| 2025-08-13 | 13F | Avestar Capital, LLC | 103,914 | 20.73 | 2,158 | 16.84 | ||||
| 2025-04-17 | 13F | Rs Crum Inc. | 156,425 | 3,357 | ||||||
| 2025-08-13 | 13F | Leuthold Group, Llc | 36,609 | 0.00 | 760 | -3.18 | ||||
| 2025-08-11 | 13F | Rothschild Investment Llc | 92 | 0.00 | 2 | 0.00 | ||||
| 2025-07-02 | 13F | Boston Standard Wealth Management, LLC | 40,047 | 29.55 | 832 | 32.48 | ||||
| 2025-07-17 | 13F | Keystone Global Partners, LLC | 0 | -100.00 | 0 | |||||
| 2025-08-14 | 13F | Fmr Llc | 267 | 1,113.64 | 6 | |||||
| 2025-08-05 | 13F | Advisors Preferred, LLC | 0 | -100.00 | 0 | |||||
| 2025-08-12 | 13F | Twin Focus Capital Partners, Llc | 0 | -100.00 | 0 | |||||
| 2025-08-13 | 13F | Cresset Asset Management, LLC | 705,422 | 6.35 | 14,652 | 2.92 | ||||
| 2025-08-14 | 13F | Stifel Financial Corp | 486,767 | -3.08 | 10,110 | -6.19 | ||||
| 2025-07-10 | 13F | Signal Advisors Wealth, LLC | 30,806 | 640 | ||||||
| 2025-08-15 | 13F | Morgan Stanley | 2,244,727 | 92.00 | 46,623 | 85.83 | ||||
| 2025-07-31 | 13F | Whipplewood Advisors, LLC | 1,114 | -90.58 | 23 | -14.81 | ||||
| 2025-08-08 | 13F | Empower Advisory Group, LLC | 20,115 | 418 | ||||||
| 2025-08-13 | 13F | Aristides Capital LLC | 30,000 | 0.00 | 623 | -3.11 | ||||
| 2025-07-16 | 13F | Perigon Wealth Management, LLC | 24,492 | -17.55 | 509 | -20.25 | ||||
| 2025-08-14 | 13F | Toroso Investments, LLC | 0 | -100.00 | 0 | |||||
| 2025-08-08 | 13F | MTM Investment Management, LLC | 4,980 | 103 | ||||||
| 2025-07-14 | 13F | AdvisorNet Financial, Inc | 4,371 | 7.77 | 91 | 3.45 | ||||
| 2025-07-31 | 13F | Cambridge Investment Research Advisors, Inc. | 33,156 | -23.53 | 1 | |||||
| 2025-07-10 | 13F | Wealth Enhancement Advisory Services, Llc | 149,107 | -8.26 | 3,143 | -9.87 | ||||
| 2025-07-30 | 13F | Whittier Trust Co | 1,080 | 22 | ||||||
| 2025-07-22 | 13F | Merit Financial Group, LLC | 54,268 | 37.80 | 1,127 | 33.37 | ||||
| 2025-08-14 | 13F | Macquarie Group Ltd | 147,001 | -11.30 | 3,053 | -14.15 | ||||
| 2025-08-19 | 13F | Cape Investment Advisory, Inc. | 581 | -22.84 | 12 | -25.00 | ||||
| 2025-07-30 | 13F | D.a. Davidson & Co. | 11,827 | -37.05 | 246 | -39.21 | ||||
| 2025-08-14 | 13F | Nepc Llc | 2,175,486 | 18.55 | 45,185 | 14.73 | ||||
| 2025-08-11 | 13F | Anfield Capital Management, LLC | 1,021 | 186.80 | 21 | 200.00 | ||||
| 2025-08-11 | 13F | Wealthspire Advisors, LLC | 21,115 | 0.00 | 439 | -3.31 | ||||
| 2025-08-06 | 13F | Walkner Condon Financial Advisors LLC | 30,713 | -16.29 | 638 | -18.93 | ||||
| 2025-08-04 | 13F | Spire Wealth Management | 0 | -100.00 | 0 | |||||
| 2025-08-14 | 13F | Sei Investments Co | 7,953,374 | -17.00 | 165,189 | -19.67 | ||||
| 2025-07-07 | 13F | Upper Left Wealth Management, LLC | 296,586 | 4.50 | 6,160 | 1.15 | ||||
| 2025-05-08 | NP | QALTX - Quantified Alternative Investment Fund Investor Class Shares | 7,900 | 170 | ||||||
| 2025-07-21 | 13F | Ameritas Advisory Services, LLC | 349 | 7 | ||||||
| 2025-05-09 | 13F | Atria Wealth Solutions, Inc. | 0 | -100.00 | 0 | |||||
| 2025-08-14 | 13F | Bank Of America Corp /de/ | 2,577,292 | 34.95 | 53,530 | 30.62 | ||||
| 2025-08-14 | 13F | Mariner, LLC | 29,191 | 606 | ||||||
| 2025-07-29 | 13F | Stratos Wealth Partners, LTD. | 0 | -100.00 | 0 | |||||
| 2025-04-29 | 13F | Td Private Client Wealth Llc | 0 | -100.00 | 0 | |||||
| 2025-08-11 | 13F | Compass Capital Corp /ma/ /adv | 0 | -100.00 | 0 | |||||
| 2025-08-19 | 13F | Advisory Services Network, LLC | 64,723 | 0.36 | 1,336 | -3.47 | ||||
| 2025-08-11 | 13F | Aspen Investment Management Inc | 33,885 | -11.03 | 1 | |||||
| 2025-07-10 | 13F | Oliver Lagore Vanvalin Investment Group | 75 | 2 | ||||||
| 2025-05-14 | 13F | Congress Wealth Management LLC / DE / | 0 | -100.00 | 0 | |||||
| 2025-08-05 | 13F | Sigma Planning Corp | 9,866 | 0.00 | 205 | -3.32 | ||||
| 2025-08-01 | 13F | New York Life Investment Management Llc | 121,072 | 2,515 | ||||||
| 2025-07-30 | 13F | Whittier Trust Co Of Nevada Inc | 2,131 | 0.00 | 44 | -2.22 | ||||
| 2025-08-19 | 13F | Wealth Group, Ltd. | 0 | -100.00 | 0 | |||||
| 2025-08-05 | 13F | Key FInancial Inc | 17 | 0.00 | 0 | |||||
| 2025-04-30 | 13F | Ramiah Investment Group | 50,804 | 38.51 | 1,090 | 53.52 | ||||
| 2025-07-24 | 13F | Callan Family Office, LLC | 13,577 | 0.00 | 282 | -3.44 | ||||
| 2025-08-06 | 13F | Commonwealth Equity Services, Llc | 12,917 | 5.91 | 0 | |||||
| 2025-05-15 | 13F | Fullerton Fund Management Co Ltd | 0 | -100.00 | 0 | |||||
| 2025-08-11 | 13F | HighTower Advisors, LLC | 43,254 | 13.81 | 898 | 10.18 | ||||
| 2025-08-14 | 13F | Vident Advisory, LLC | 22,445 | 91.17 | 466 | 85.66 | ||||
| 2025-07-30 | 13F | Cullen/frost Bankers, Inc. | 0 | -100.00 | 0 | |||||
| 2025-05-15 | 13F | Tower Research Capital LLC (TRC) | 0 | -100.00 | 0 | |||||
| 2025-08-14 | 13F | IHT Wealth Management, LLC | 11,175 | -28.01 | 232 | -30.33 | ||||
| 2025-05-28 | 13F/A | Modern Wealth Management, LLC | 12,301 | 238 | ||||||
| 2025-08-14 | 13F | Bnp Paribas Arbitrage, Sa | 4,698 | 98 | ||||||
| 2025-08-14 | 13F | Alliancebernstein L.p. | 174,950 | 3,634 | ||||||
| 2025-07-11 | 13F | Pinnacle Bancorp, Inc. | 256 | 0.00 | 5 | 0.00 | ||||
| 2025-07-24 | 13F | Comprehensive Money Management Services LLC | 57,211 | -2.78 | 1,188 | -5.86 | ||||
| 2025-08-13 | 13F | Transce3nd, LLC | 13 | 0.00 | 0 | |||||
| 2025-05-08 | 13F | Parkside Financial Bank & Trust | 0 | -100.00 | 0 | -100.00 | ||||
| 2025-07-22 | 13F | Marks Group Wealth Management, Inc | 0 | -100.00 | 0 | |||||
| 2025-08-14 | 13F | GWM Advisors LLC | 50,578 | -17.79 | 1,051 | -20.45 | ||||
| 2025-04-10 | 13F | Retirement Planning Group | 0 | -100.00 | 0 | |||||
| 2025-08-14 | 13F | Comerica Bank | 18,594 | 57.80 | 386 | 53.17 | ||||
| 2025-08-13 | 13F | Jones Financial Companies Lllp | 0 | -100.00 | 0 | |||||
| 2025-07-08 | 13F | Braun-Bostich & Associates Inc. | 0 | -100.00 | 0 | |||||
| 2025-08-08 | 13F | Principal Financial Group Inc | 285,250 | 5,925 | ||||||
| 2025-08-11 | 13F | Citigroup Inc | 9 | 0 | ||||||
| 2025-08-01 | 13F | American Financial & Tax Strategies Inc | 130,550 | -11.82 | 2,712 | -14.67 | ||||
| 2025-07-11 | 13F | Williams Financial, LLC | 0 | -100.00 | 0 | |||||
| 2025-08-06 | 13F | Penserra Capital Management LLC | 598,877 | 2.59 | 12 | 0.00 | ||||
| 2025-07-28 | 13F | Harbour Investments, Inc. | 1,210 | 0.08 | 25 | 0.00 | ||||
| 2025-08-14 | 13F | Citadel Advisors Llc | Put | 0 | -100.00 | 0 | ||||
| 2025-08-06 | 13F | Metis Global Partners, LLC | 7,925,004 | 27.74 | 164,602 | 23.63 | ||||
| 2025-08-14 | 13F | Cohen & Steers, Inc. | 35,159 | -12.70 | 1 | |||||
| 2025-08-04 | 13F | Creative Financial Designs Inc /adv | 150 | 0.00 | 3 | 0.00 | ||||
| 2025-08-04 | 13F | Assetmark, Inc | 330 | 3,566.67 | 7 | |||||
| 2025-07-07 | 13F | Versant Capital Management, Inc | 20 | 0.00 | 0 | |||||
| 2025-07-18 | 13F | SigFig Wealth Management, LLC | 191,010 | 15.87 | 3,988 | 13.59 | ||||
| 2025-04-30 | 13F | ARGI Investment Services, LLC | 0 | -100.00 | 0 | |||||
| 2025-07-24 | 13F | IFP Advisors, Inc | 0 | -100.00 | 0 | |||||
| 2025-05-08 | 13F | Banque Cantonale Vaudoise | 0 | -100.00 | 0 | |||||
| 2025-07-09 | 13F | Bruce G. Allen Investments, LLC | 30,065 | -0.43 | 624 | -3.55 | ||||
| 2025-07-10 | 13F | Stewardship Advisors, LLC | 13,438 | -18.63 | 279 | -21.19 | ||||
| 2025-07-17 | 13F | K2 Financial Inc. | 78,706 | 5.81 | 1,661 | 8.07 | ||||
| 2025-08-11 | 13F | WPG Advisers, LLC | 4,629 | -23.73 | 96 | -26.15 | ||||
| 2025-08-12 | 13F | Rock Creek Group, LP | 0 | -100.00 | 0 | |||||
| 2025-08-12 | 13F | Proequities, Inc. | 0 | 0 | ||||||
| 2025-08-12 | 13F | Jpmorgan Chase & Co | 30 | -93.42 | 1 | -100.00 | ||||
| 2025-08-11 | 13F | Brown Brothers Harriman & Co | 1,900 | 39 | ||||||
| 2025-07-15 | 13F | MCF Advisors LLC | 935,435 | 1.03 | 19,429 | -2.22 | ||||
| 2025-06-05 | 13F | Cim, Llc | 0 | -100.00 | 0 | |||||
| 2025-08-08 | 13F | Pnc Financial Services Group, Inc. | 970 | 0.00 | 20 | 0.00 | ||||
| 2025-07-07 | 13F | Bangor Savings Bank | 2,280 | 0.00 | 47 | -2.08 | ||||
| 2025-06-25 | NP | DPREX - Delaware Global Listed Real Assets Fund CLASS A | 152,691 | -10.44 | 3,107 | -11.13 | ||||
| 2025-08-26 | NP | TBFG - The Brinsmere Fund - Growth ETF | 371,887 | 2.54 | 7,724 | -0.76 | ||||
| 2025-08-13 | 13F | Northwestern Mutual Wealth Management Co | 2,018,914 | 22.64 | 41,933 | 18.70 | ||||
| 2025-08-14 | 13F | Ambassador Advisors, LLC | 22,979 | 2.80 | 477 | -0.42 | ||||
| 2025-08-11 | 13F | Aptus Capital Advisors, LLC | 11,545 | 0.00 | 240 | -3.24 | ||||
| 2025-08-19 | 13F/A | Pitcairn Co | 187,136 | 0.00 | 3,887 | -3.21 | ||||
| 2025-08-11 | 13F | Great Lakes Advisors, Llc | 1,454,571 | -6.30 | 30,211 | -9.31 | ||||
| 2025-08-12 | 13F | LPL Financial LLC | 144,921 | 11.20 | 3,010 | 7.65 | ||||
| 2025-08-15 | 13F | Captrust Financial Advisors | 43,885 | 39.43 | 911 | 34.96 | ||||
| 2025-08-22 | 13F | Carter Financial Group, INC. | 47,380 | 35.50 | 984 | -1.99 |