Mga Batayang Estadistika
| Pemilik Institusional | 134 total, 134 long only, 0 short only, 0 long/short - change of 4.65% MRQ |
| Alokasi Portofolio Rata-rata | 0.1246 % - change of 5.06% MRQ |
| Saham Institusional (Jangka Panjang) | 7,001,631 (ex 13D/G) - change of 0.18MM shares 2.67% MRQ |
| Nilai Institusional (Jangka Panjang) | $ 247,379 USD ($1000) |
Kepemilikan Institusional dan Pemegang Saham
BlackRock Science and Technology Trust (US:BST) memiliki 134 pemilik institusional dan pemegang saham yang telah mengajukan formulir 13D/G atau 13F kepada Komisi Bursa Efek (Securities Exchange Commission/SEC). Lembaga-lembaga ini memegang total 7,001,631 saham. Pemegang saham terbesar meliputi Morgan Stanley, Raymond James Financial Inc, Ameriprise Financial Inc, Invesco Ltd., PCEF - Invesco CEF Income Composite ETF, Karpus Management, Inc., Royal Bank Of Canada, 1607 Capital Partners, LLC, LPL Financial LLC, and Wedbush Securities Inc .
Struktur kepemilikan institusional BlackRock Science and Technology Trust (NYSE:BST) menunjukkan posisi terkini di perusahaan oleh institusi dan dana, serta perubahan terbaru dalam ukuran posisi. Pemegang saham utama dapat mencakup investor individu, reksa dana, dana lindung nilai, atau institusi. Jadwal 13D menunjukkan bahwa investor memegang (atau pernah memegang) lebih dari 5% saham perusahaan dan bermaksud (atau pernah bermaksud) untuk secara aktif mengejar perubahan strategi bisnis. Jadwal 13G menunjukkan investasi pasif lebih dari 5%.
The share price as of September 2, 2025 is 39.27 / share. Previously, on September 3, 2024, the share price was 34.27 / share. This represents an increase of 14.59% over that period.

Skor Sentimen Dana
Skor Sentimen Dana (sebelumnya dikenal sebagai Skor Akumulasi Kepemilikan) menemukan saham-saham yang paling banyak dibeli oleh dana. Ini adalah hasil dari model kuantitatif multi-faktor yang canggih yang mengidentifikasi perusahaan dengan tingkat akumulasi institusional tertinggi. Model penilaian menggunakan kombinasi dari total peningkatan pemilik yang diungkapkan, perubahan dalam alokasi portofolio pada pemilik tersebut, dan metrik lainnya. Angka berkisar dari 0 hingga 100, dengan angka yang lebih tinggi menunjukkan tingkat akumulasi yang lebih tinggi dibandingkan dengan perusahaan sejenisnya, dan 50 adalah rata-ratanya.
Frekuensi Pembaruan: Setiap Hari
Lihat Ownership Explorer, yang menyediakan daftar perusahaan dengan peringkat tertinggi.
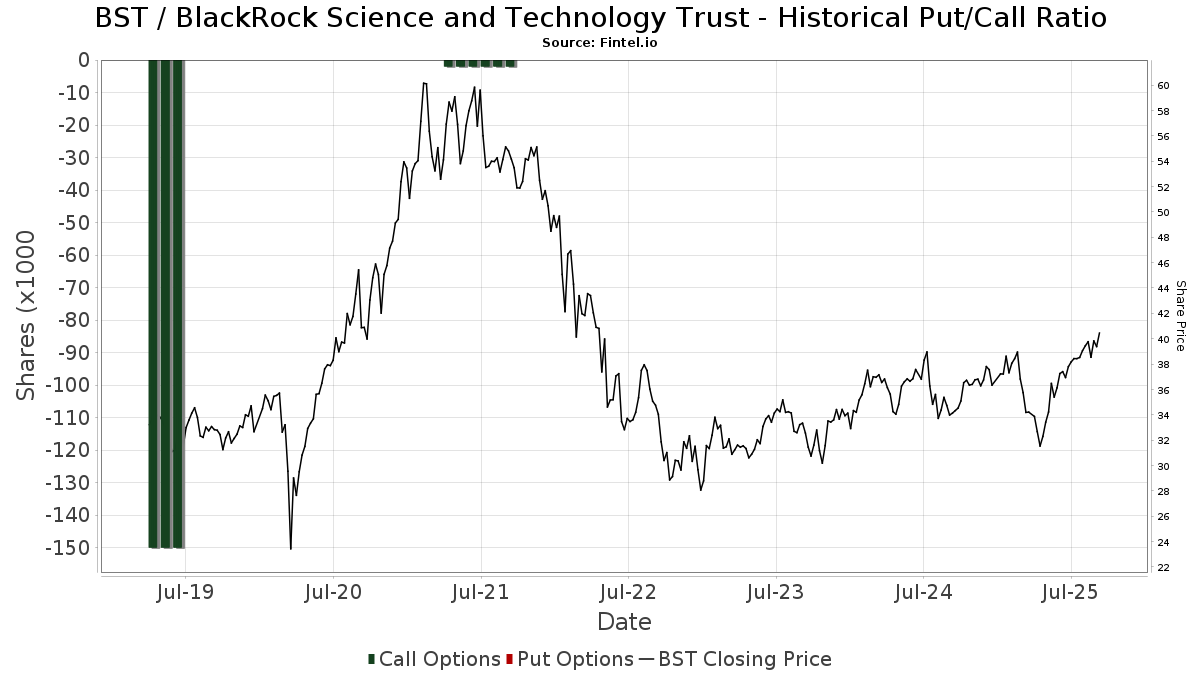
Rasio Put/Call Institusional
Selain melaporkan isu ekuitas dan utang standar, institusi dengan aset di bawah manajemen lebih dari 100 juta dolar AS juga harus mengungkapkan kepemilikan opsi put dan call mereka. Karena opsi put umumnya menunjukkan sentimen negatif, dan opsi call menunjukkan sentimen positif, kita dapat mengetahui sentimen institusional secara keseluruhan dengan memplot rasio put terhadap call. Grafik di sebelah kanan memplot rasio put/call historis untuk instrumen ini.
Menggunakan Rasio Put/Call sebagai indikator sentimen investor mengatasi salah satu kekurangan utama dari penggunaan total kepemilikan institusional, yaitu sejumlah besar aset yang dikelola diinvestasikan secara pasif untuk melacak indeks. Dana yang dikelola secara pasif biasanya tidak membeli opsi, sehingga indikator rasio put/call lebih akurat dalam melacak sentimen dana yang dikelola secara aktif.
Pengajuan 13F dan NPORT
Detail pada pengajuan 13F tersedia gratis. Detail pada pengajuan NP memerlukan keanggotaan premium. Baris berwarna hijau menunjukkan posisi baru. Baris berwarna merah menunjukkan posisi yang sudah ditutup. Klik tautan ini ikon untuk melihat riwayat transaksi selengkapnya.
Tingkatkan
untuk membuka data premium dan mengekspor ke Excel ![]() .
.
| Tanggal File | Sumber | Investor | Ketik | Presyo ng Avg (Silangan) |
Saham | Δ Saham (%) |
Dilaporkan Nilai ($1000) |
Nilai Δ (%) |
Alokasi Port (%) |
|
|---|---|---|---|---|---|---|---|---|---|---|
| 2025-07-08 | 13F | Parallel Advisors, LLC | 721 | 8.26 | 28 | 28.57 | ||||
| 2025-07-10 | 13F | Focus Financial Network, Inc. | 15,773 | 9.37 | 602 | 26.74 | ||||
| 2025-08-05 | 13F | Westside Investment Management, Inc. | 700 | 0.00 | 27 | 13.04 | ||||
| 2025-08-04 | 13F | Creative Financial Designs Inc /adv | 313 | 0.00 | 12 | 10.00 | ||||
| 2025-08-14 | 13F | Federation des caisses Desjardins du Quebec | 970 | 0.00 | 37 | 15.63 | ||||
| 2025-08-14 | 13F | Stifel Financial Corp | 59,465 | 8.80 | 2,270 | 25.85 | ||||
| 2025-07-18 | 13F | Consolidated Portfolio Review Corp | 6,901 | -1.16 | 263 | 14.35 | ||||
| 2025-08-13 | 13F | Capital Analysts, Inc. | 660 | 0.00 | 0 | |||||
| 2025-08-14 | 13F | Goldman Sachs Group Inc | 8,347 | 35.79 | 319 | 57.43 | ||||
| 2025-08-14 | 13F | Royal Bank Of Canada | 296,112 | -0.24 | 11,303 | 15.44 | ||||
| 2025-05-13 | 13F | NINE MASTS CAPITAL Ltd | 0 | -100.00 | 0 | |||||
| 2025-08-12 | 13F | LPL Financial LLC | 260,467 | 4.24 | 9,942 | 20.61 | ||||
| 2025-08-08 | 13F | Larson Financial Group LLC | 1,115 | 0.00 | 43 | 16.67 | ||||
| 2025-08-14 | 13F | Comerica Bank | 2,330 | 8.47 | 89 | 25.71 | ||||
| 2025-08-08 | 13F | Calamos Advisors LLC | 8,586 | 1.11 | 328 | 16.79 | ||||
| 2025-07-25 | 13F | Cwm, Llc | 3,336 | -2.54 | 0 | |||||
| 2025-08-05 | 13F | EPG Wealth Management LLC | 0 | -100.00 | 0 | |||||
| 2025-08-14 | 13F | Hilltop Holdings Inc. | 14,988 | 5.39 | 572 | 21.96 | ||||
| 2025-05-15 | 13F | Parvin Asset Management, LLC | 0 | -100.00 | 0 | |||||
| 2025-08-12 | 13F | Jpmorgan Chase & Co | 3,859 | 36.55 | 147 | 58.06 | ||||
| 2025-07-22 | 13F | Kessler Investment Group, LLC | 7 | 0.00 | 0 | |||||
| 2025-08-08 | 13F | Cetera Investment Advisers | 49,871 | 3.68 | 1,904 | 19.99 | ||||
| 2025-08-04 | 13F | Spire Wealth Management | 180 | -79.82 | 7 | -79.31 | ||||
| 2025-08-12 | 13F | Global Retirement Partners, LLC | 1,096 | 0.00 | 42 | 2.50 | ||||
| 2025-08-13 | 13F | Advisor Group Holdings, Inc. | 120,777 | -10.74 | 4,428 | -0.81 | ||||
| 2025-07-11 | 13F | Farther Finance Advisors, LLC | 9 | 0.00 | 0 | |||||
| 2025-07-24 | 13F | JNBA Financial Advisors | 359 | 0.00 | 14 | 18.18 | ||||
| 2025-08-07 | 13F | Mosaic Financial Group, Llc | 0 | -100.00 | 0 | |||||
| 2025-08-04 | 13F | Arkadios Wealth Advisors | 7,297 | -10.40 | 279 | 3.73 | ||||
| 2025-07-10 | 13F | Stolper Co | 18,390 | 4.78 | 1 | |||||
| 2025-08-27 | NP | RYMSX - Guggenheim Multi-Hedge Strategies Fund Class P | 13 | -91.28 | 0 | -100.00 | ||||
| 2025-07-07 | 13F | Investors Research Corp | 250 | 10 | ||||||
| 2025-07-31 | 13F | Cambridge Investment Research Advisors, Inc. | 46,043 | -28.85 | 2 | -50.00 | ||||
| 2025-07-16 | 13F | Perigon Wealth Management, LLC | 6,826 | -11.42 | 261 | 2.36 | ||||
| 2025-07-17 | 13F | Janney Montgomery Scott LLC | 148,438 | 0.41 | 6 | 25.00 | ||||
| 2025-08-14 | 13F | Ameriprise Financial Inc | 434,074 | -2.22 | 16,576 | 13.19 | ||||
| 2025-08-14 | 13F | Great Valley Advisor Group, Inc. | 9,980 | 0.00 | 381 | 15.50 | ||||
| 2025-05-12 | 13F | Fmr Llc | 0 | -100.00 | 0 | |||||
| 2025-08-14 | 13F | UBS Group AG | 123,252 | 7.50 | 4,705 | 24.38 | ||||
| 2025-08-27 | NP | RYDEX VARIABLE TRUST - Multi-Hedge Strategies Fund Variable Annuity | 22 | -78.85 | 1 | -100.00 | ||||
| 2025-07-28 | 13F | BRYN MAWR TRUST Co | 2,150 | 0.00 | 82 | 17.14 | ||||
| 2025-08-12 | 13F | J.w. Cole Advisors, Inc. | 32,451 | 13.47 | 1,239 | 31.28 | ||||
| 2025-08-15 | 13F | Kestra Advisory Services, LLC | 21,646 | 3.90 | 826 | 20.23 | ||||
| 2025-05-16 | 13F | Arete Wealth Advisors, LLC | 0 | -100.00 | 0 | |||||
| 2025-07-18 | 13F | TruNorth Capital Management, LLC | 100 | 2.04 | 4 | 0.00 | ||||
| 2025-08-06 | 13F | Prospera Financial Services Inc | 14,685 | 0.44 | 561 | 16.18 | ||||
| 2025-08-14 | 13F | Balyasny Asset Management Llc | 37,096 | 1,416 | ||||||
| 2025-07-08 | 13F | Next Level Private LLC | 9,521 | 1.31 | 363 | 17.10 | ||||
| 2025-08-01 | 13F | Boyd Watterson Asset Management Llc/oh | 96 | 0.00 | 4 | 0.00 | ||||
| 2025-08-12 | 13F | NWF Advisory Services Inc. | 75,000 | 2,474 | ||||||
| 2025-07-31 | 13F | Oppenheimer & Co Inc | 44,407 | 3.72 | 1,695 | 20.04 | ||||
| 2025-08-14 | 13F/A | Rockefeller Capital Management L.P. | 10,133 | 0.66 | 387 | 16.27 | ||||
| 2025-07-08 | 13F | Nbc Securities, Inc. | 16,431 | -0.02 | 1 | |||||
| 2025-08-05 | 13F | Huntington National Bank | 80 | 15.94 | ||||||
| 2025-07-18 | 13F | Truist Financial Corp | 32,373 | 8.09 | 1,236 | 25.00 | ||||
| 2025-08-19 | 13F | National Asset Management, Inc. | 9,834 | 15.68 | 375 | 20.97 | ||||
| 2025-08-06 | 13F | Wedbush Securities Inc | 220,815 | -8.97 | 8 | 0.00 | ||||
| 2025-08-04 | 13F | Bay Colony Advisory Group, Inc d/b/a Bay Colony Advisors | 8,221 | 2.57 | 314 | 16.79 | ||||
| 2025-08-14 | 13F | Jane Street Group, Llc | 10,777 | -48.48 | 411 | -40.43 | ||||
| 2025-08-14 | 13F | Polar Asset Management Partners Inc. | 14,730 | 1.47 | 562 | 17.57 | ||||
| 2025-07-14 | 13F | AdvisorNet Financial, Inc | 1,363 | 83.69 | 52 | 116.67 | ||||
| 2025-08-05 | 13F | Claro Advisors LLC | 8,594 | 1.17 | 328 | 17.14 | ||||
| 2025-08-12 | 13F | NFP Retirement, Inc. | 58,527 | -1.91 | 2,234 | 13.47 | ||||
| 2025-07-25 | 13F | Atria Wealth Solutions, Inc. | 12,482 | 477 | ||||||
| 2025-07-14 | 13F | Armstrong Advisory Group, Inc | 352 | 13 | ||||||
| 2025-07-18 | 13F | Trust Co Of Vermont | 1,500 | 0.00 | 57 | 16.33 | ||||
| 2025-08-01 | 13F | Envestnet Asset Management Inc | 27,410 | 2.53 | 1,046 | 18.73 | ||||
| 2025-07-29 | 13F | International Assets Investment Management, Llc | 13,652 | 2.32 | 521 | 18.41 | ||||
| 2025-08-07 | 13F | Readystate Asset Management Lp | 8,971 | 342 | ||||||
| 2025-08-13 | 13F | Northwestern Mutual Wealth Management Co | 7,210 | 11.80 | 275 | 29.72 | ||||
| 2025-07-25 | NP | FCEF - First Trust CEF Income Opportunity ETF This fund is a listed as child fund of First Trust Advisors Lp and if that institution has disclosed ownership in this security, then these positions will not be double counted when calculating total shares and total value | 35,204 | 10.38 | 1,284 | 10.32 | ||||
| 2025-07-14 | 13F | UMA Financial Services, Inc. | 307 | 0.00 | 12 | 10.00 | ||||
| 2025-08-08 | 13F | Kingsview Wealth Management, LLC | 24,453 | 0.00 | 933 | 15.76 | ||||
| 2025-08-12 | 13F | Walled Lake Planning & Wealth Management, Llc | 8,591 | 2.10 | 328 | 18.05 | ||||
| 2025-08-12 | 13F | Virtu Financial LLC | 0 | -100.00 | 0 | |||||
| 2025-07-21 | 13F | Future Financial Wealth Managment LLC | 14,000 | 0.00 | 534 | 15.84 | ||||
| 2025-07-09 | 13F | Mirador Capital Partners LP | 7,597 | 0.73 | 290 | 16.53 | ||||
| 2025-08-13 | 13F | First Trust Advisors Lp | 70,663 | -0.80 | 2,697 | 14.81 | ||||
| 2025-07-23 | 13F | Abel Hall, LLC | 13,000 | 496 | ||||||
| 2025-07-29 | 13F | Stephens Inc /ar/ | 16,485 | 3.13 | 629 | 19.35 | ||||
| 2025-08-19 | 13F | Newbridge Financial Services Group, Inc. | 68,399 | 2,611 | ||||||
| 2025-04-29 | 13F | Hm Payson & Co | 600 | 0.00 | 20 | -9.52 | ||||
| 2025-08-08 | 13F | Capital Investment Advisory Services, LLC | 6,447 | 6.00 | 246 | 23.00 | ||||
| 2025-06-27 | NP | Calamos ETF Trust - Calamos CEF Income & Arbitrage ETF | 7,812 | -34.79 | 261 | -42.38 | ||||
| 2025-08-14 | 13F | Monetary Management Group Inc | 445 | 0.00 | 17 | 14.29 | ||||
| 2025-08-13 | 13F | Level Four Advisory Services, Llc | 5,776 | -17.69 | 220 | -4.76 | ||||
| 2025-08-12 | 13F | Steward Partners Investment Advisory, Llc | 169,148 | -0.34 | 6,456 | 15.31 | ||||
| 2025-07-31 | 13F | Anchor Capital Management Group Inc | 18,000 | 0.00 | 687 | 15.85 | ||||
| 2025-08-13 | 13F | Invesco Ltd. | 432,215 | -12.41 | 16,498 | 1.34 | ||||
| 2025-07-16 | 13F | ORG Partners LLC | 1,033 | -26.42 | 39 | -17.02 | ||||
| 2025-07-28 | 13F | SFG Wealth Management, LLC. | 20,552 | 0.00 | 784 | 15.63 | ||||
| 2025-07-28 | 13F | Mission Hills Financial Advisory, LLC | 13,402 | 512 | ||||||
| 2025-07-24 | 13F | Aurora Private Wealth, Inc. | 8,808 | 1.46 | 0 | |||||
| 2025-08-14 | 13F | MGB Wealth Management, LLC | 0 | -100.00 | 0 | |||||
| 2025-08-12 | 13F | MAI Capital Management | 1,162 | 0.17 | 44 | 15.79 | ||||
| 2025-06-26 | NP | ATCAX - Anchor Risk Managed Credit Strategies Fund Advisor Class Shares | 18,000 | 0.00 | 656 | 0.00 | ||||
| 2025-07-25 | 13F | Apollon Wealth Management, LLC | 17,980 | 20.24 | 686 | 39.15 | ||||
| 2025-08-06 | 13F | New Millennium Group LLC | 1 | 0 | ||||||
| 2025-08-14 | 13F | Karpus Management, Inc. | 322,983 | 7.39 | 12,328 | 24.25 | ||||
| 2025-07-15 | 13F | Wealth Effects Llc | 14,685 | -14.42 | 561 | -1.06 | ||||
| 2025-08-14 | 13F | Raymond James Financial Inc | 1,045,902 | 2.38 | 39,922 | 18.46 | ||||
| 2025-08-14 | 13F | Herold Advisors, Inc. | 6,233 | 1.65 | 238 | 17.33 | ||||
| 2025-07-24 | 13F | Ronald Blue Trust, Inc. | 100 | 4 | ||||||
| 2025-08-14 | 13F | 1607 Capital Partners, LLC | 284,950 | -8.54 | 10,877 | 5.82 | ||||
| 2025-07-24 | 13F | Jfs Wealth Advisors, Llc | 383 | 0.00 | 15 | 16.67 | ||||
| 2025-08-07 | 13F | Vista Investment Partners Ii, Llc | 6,762 | 0.43 | 258 | 16.22 | ||||
| 2025-05-16 | 13F | Coordinated Financial Services, Inc./CO | 0 | -100.00 | 0 | |||||
| 2025-08-11 | 13F | Principal Securities, Inc. | 2,074 | 12.90 | 79 | 17.91 | ||||
| 2025-08-14 | 13F | Sunbelt Securities, Inc. | 11,435 | 97.16 | 418 | 118.85 | ||||
| 2025-08-07 | 13F | Allworth Financial LP | 7 | 16.67 | 0 | |||||
| 2025-08-08 | 13F | Pnc Financial Services Group, Inc. | 7,840 | -33.50 | 299 | -22.94 | ||||
| 2025-08-05 | 13F | Shaker Financial Services, LLC | 36,014 | 313.15 | 1,375 | 378.75 | ||||
| 2025-08-11 | 13F | Tidemark, LLC | 42 | 0.00 | 2 | 0.00 | ||||
| 2025-08-22 | NP | Cornerstone Strategic Value Fund Inc | 59,383 | 5.85 | 2,267 | 22.49 | ||||
| 2025-08-05 | 13F | Scarborough Advisors, LLC | 259 | 10 | ||||||
| 2025-08-11 | 13F | Elequin Capital Lp | 13,024 | 2,059.87 | 497 | 2,515.79 | ||||
| 2025-08-04 | 13F | Pensionmark Financial Group, Llc | 5,367 | 205 | ||||||
| 2025-07-28 | NP | PCEF - Invesco CEF Income Composite ETF This fund is a listed as child fund of Invesco Ltd. and if that institution has disclosed ownership in this security, then these positions will not be double counted when calculating total shares and total value | 418,145 | -5.67 | 15,246 | -5.70 | ||||
| 2025-07-09 | 13F | David J Yvars Group | 28,045 | 0.57 | 1,071 | 16.03 | ||||
| 2025-08-14 | 13F | GWM Advisors LLC | 820 | 1.61 | 31 | 19.23 | ||||
| 2025-08-12 | 13F | Proequities, Inc. | 0 | 0 | ||||||
| 2025-08-06 | 13F | Commonwealth Equity Services, Llc | 39,897 | -1.40 | 2 | 0.00 | ||||
| 2025-08-13 | 13F | EverSource Wealth Advisors, LLC | 710 | 0.00 | 27 | 17.39 | ||||
| 2025-08-12 | 13F | BlackRock, Inc. | 0 | -100.00 | 0 | |||||
| 2025-08-12 | 13F | Park Square Financial Group, LLC | 44 | 0.00 | 2 | 0.00 | ||||
| 2025-05-06 | 13F | Venturi Wealth Management, LLC | 0 | -100.00 | 0 | |||||
| 2025-08-04 | 13F | Wolverine Asset Management Llc | 13,153 | 502 | ||||||
| 2025-08-13 | 13F | Smith, Moore & Co. | 15,173 | 0.33 | 579 | 16.27 | ||||
| 2025-08-14 | 13F | Wells Fargo & Company/mn | 67,218 | 242.04 | 2,566 | 295.83 | ||||
| 2025-04-21 | 13F | Nelson, Van Denburg & Campbell Wealth Management Group, LLC | 0 | -100.00 | 0 | |||||
| 2025-08-13 | 13F | Keystone Financial Group | 6,734 | 0.00 | 257 | 15.77 | ||||
| 2025-08-04 | 13F | Daymark Wealth Partners, Llc | 5,975 | 228 | ||||||
| 2025-08-14 | 13F | Atomi Financial Group, Inc. | 11,765 | -9.33 | 449 | 4.91 | ||||
| 2025-08-22 | NP | Cornerstone Total Return Fund Inc | 28,142 | 0.00 | 1,074 | 15.73 | ||||
| 2025-08-08 | 13F | Cornerstone Advisors, LLC | 87,525 | 3.90 | 3,341 | 20.19 | ||||
| 2025-08-08 | 13F | Symphony Financial Services, Inc. | 6,311 | -0.71 | 241 | 14.83 | ||||
| 2025-07-01 | 13F | Harbor Investment Advisory, Llc | 3,163 | -9.40 | 121 | 4.35 | ||||
| 2025-07-30 | 13F | D.a. Davidson & Co. | 15,340 | 23.35 | 586 | 42.68 | ||||
| 2025-07-24 | 13F | Us Bancorp \de\ | 0 | -100.00 | 0 | |||||
| 2025-08-14 | 13F | Wealth Preservation Advisors, LLC | 0 | -100.00 | 0 | |||||
| 2025-07-28 | 13F | Mutual Advisors, LLC | 14,245 | 5.40 | 555 | 22.84 | ||||
| 2025-08-14 | 13F | Colony Group, LLC | 0 | -100.00 | 0 | |||||
| 2025-08-14 | 13F | Ambassador Advisors, LLC | 8,673 | 0.91 | 331 | 16.96 | ||||
| 2025-08-15 | 13F | Morgan Stanley | 1,281,194 | -1.47 | 48,903 | 14.00 | ||||
| 2025-08-14 | 13F | Bank Of America Corp /de/ | 192,302 | 1.32 | 7,340 | 17.23 | ||||
| 2025-07-28 | 13F | Harbour Investments, Inc. | 1,455 | 0.00 | 56 | 14.58 | ||||
| 2025-08-11 | 13F | HighTower Advisors, LLC | 35,413 | 1.49 | 1,352 | 17.38 | ||||
| 2025-08-12 | 13F | Boreal Capital Management LLC | 600 | 23 | ||||||
| 2025-08-14 | 13F | IHT Wealth Management, LLC | 0 | -100.00 | 0 | |||||
| 2025-08-15 | 13F | Captrust Financial Advisors | 5,856 | 224 | ||||||
| 2025-05-14 | 13F | Van Hulzen Asset Management, LLC | 0 | -100.00 | 0 | -100.00 | ||||
| 2025-08-14 | 13F | Mercer Global Advisors Inc /adv | 7,449 | 12.74 | 284 | 30.88 | ||||
| 2025-08-14 | 13F | Wiley Bros.-aintree Capital, Llc | 10,056 | 0.26 | 384 | 14.33 |