Mga Batayang Estadistika
| Pemilik Institusional | 122 total, 122 long only, 0 short only, 0 long/short - change of 2.52% MRQ |
| Alokasi Portofolio Rata-rata | 0.0685 % - change of -1.24% MRQ |
| Saham Institusional (Jangka Panjang) | 17,956,886 (ex 13D/G) - change of 0.26MM shares 1.47% MRQ |
| Nilai Institusional (Jangka Panjang) | $ 162,656 USD ($1000) |
Kepemilikan Institusional dan Pemegang Saham
Companhia Paranaense de Energia - COPEL - Depositary Receipt (Common Stock) (US:ELP) memiliki 122 pemilik institusional dan pemegang saham yang telah mengajukan formulir 13D/G atau 13F kepada Komisi Bursa Efek (Securities Exchange Commission/SEC). Lembaga-lembaga ini memegang total 17,956,886 saham. Pemegang saham terbesar meliputi Letko, Brosseau & Associates Inc, Vanguard Group Inc, VEIEX - Vanguard Emerging Markets Stock Index Fund Investor Shares, BlackRock, Inc., Goldman Sachs Group Inc, Morgan Stanley, SPX Equities Gestao de Recursos Ltda, Bank Of America Corp /de/, Optiver Holding B.V., and Robeco Institutional Asset Management B.V. .
Struktur kepemilikan institusional Companhia Paranaense de Energia - COPEL - Depositary Receipt (Common Stock) (NYSE:ELP) menunjukkan posisi terkini di perusahaan oleh institusi dan dana, serta perubahan terbaru dalam ukuran posisi. Pemegang saham utama dapat mencakup investor individu, reksa dana, dana lindung nilai, atau institusi. Jadwal 13D menunjukkan bahwa investor memegang (atau pernah memegang) lebih dari 5% saham perusahaan dan bermaksud (atau pernah bermaksud) untuk secara aktif mengejar perubahan strategi bisnis. Jadwal 13G menunjukkan investasi pasif lebih dari 5%.
The share price as of September 5, 2025 is 9.12 / share. Previously, on September 6, 2024, the share price was 7.73 / share. This represents an increase of 17.98% over that period.

Skor Sentimen Dana
Skor Sentimen Dana (sebelumnya dikenal sebagai Skor Akumulasi Kepemilikan) menemukan saham-saham yang paling banyak dibeli oleh dana. Ini adalah hasil dari model kuantitatif multi-faktor yang canggih yang mengidentifikasi perusahaan dengan tingkat akumulasi institusional tertinggi. Model penilaian menggunakan kombinasi dari total peningkatan pemilik yang diungkapkan, perubahan dalam alokasi portofolio pada pemilik tersebut, dan metrik lainnya. Angka berkisar dari 0 hingga 100, dengan angka yang lebih tinggi menunjukkan tingkat akumulasi yang lebih tinggi dibandingkan dengan perusahaan sejenisnya, dan 50 adalah rata-ratanya.
Frekuensi Pembaruan: Setiap Hari
Lihat Ownership Explorer, yang menyediakan daftar perusahaan dengan peringkat tertinggi.
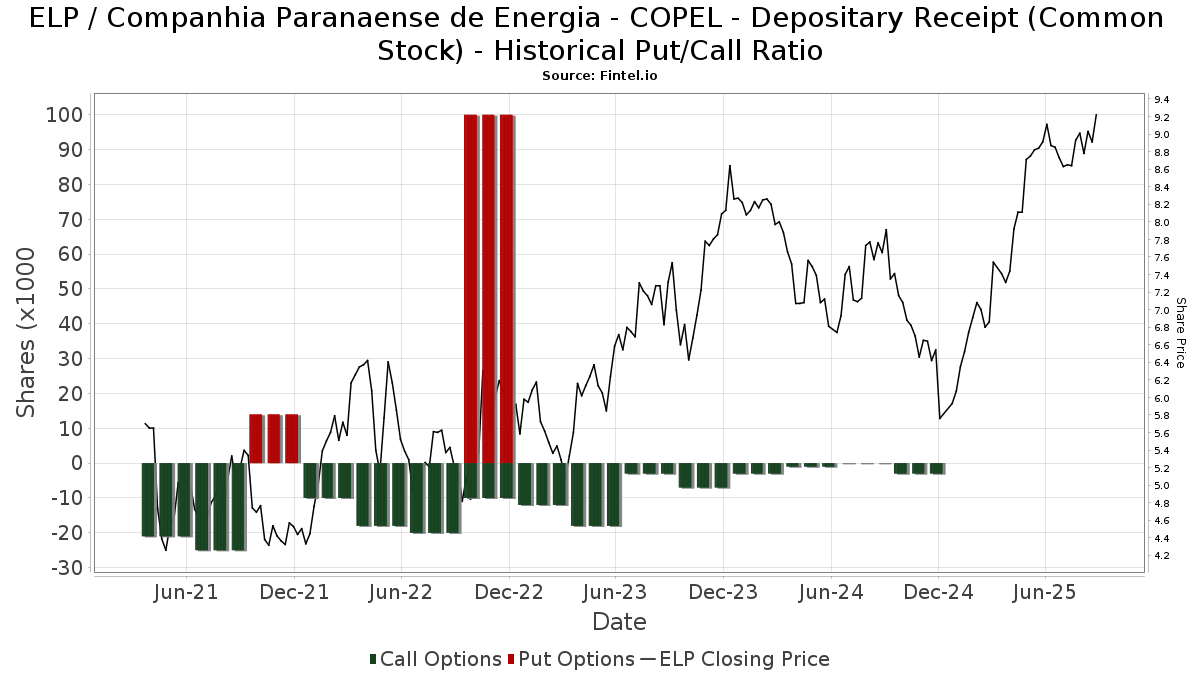
Rasio Put/Call Institusional
Selain melaporkan isu ekuitas dan utang standar, institusi dengan aset di bawah manajemen lebih dari 100 juta dolar AS juga harus mengungkapkan kepemilikan opsi put dan call mereka. Karena opsi put umumnya menunjukkan sentimen negatif, dan opsi call menunjukkan sentimen positif, kita dapat mengetahui sentimen institusional secara keseluruhan dengan memplot rasio put terhadap call. Grafik di sebelah kanan memplot rasio put/call historis untuk instrumen ini.
Menggunakan Rasio Put/Call sebagai indikator sentimen investor mengatasi salah satu kekurangan utama dari penggunaan total kepemilikan institusional, yaitu sejumlah besar aset yang dikelola diinvestasikan secara pasif untuk melacak indeks. Dana yang dikelola secara pasif biasanya tidak membeli opsi, sehingga indikator rasio put/call lebih akurat dalam melacak sentimen dana yang dikelola secara aktif.
Pengajuan 13F dan NPORT
Detail pada pengajuan 13F tersedia gratis. Detail pada pengajuan NP memerlukan keanggotaan premium. Baris berwarna hijau menunjukkan posisi baru. Baris berwarna merah menunjukkan posisi yang sudah ditutup. Klik tautan ini ikon untuk melihat riwayat transaksi selengkapnya.
Tingkatkan
untuk membuka data premium dan mengekspor ke Excel ![]() .
.
| Tanggal File | Sumber | Investor | Ketik | Presyo ng Avg (Silangan) |
Saham | Δ Saham (%) |
Dilaporkan Nilai ($1000) |
Nilai Δ (%) |
Alokasi Port (%) |
|
|---|---|---|---|---|---|---|---|---|---|---|
| 2025-08-14 | 13F | Ameriprise Financial Inc | 54,281 | 0.82 | 496 | 25.95 | ||||
| 2025-08-06 | 13F | SOUTH STATE Corp | 0 | -100.00 | 0 | |||||
| 2025-08-14 | 13F | Goldman Sachs Group Inc | 1,170,772 | 0.07 | 10,689 | 24.99 | ||||
| 2025-08-14 | 13F | Fmr Llc | 13,832 | 22.73 | 126 | 53.66 | ||||
| 2025-06-30 | NP | VEIEX - Vanguard Emerging Markets Stock Index Fund Investor Shares | 1,528,503 | -7.92 | 12,396 | 12.13 | ||||
| 2025-08-14 | 13F | Barometer Capital Management Inc. | 0 | -100.00 | 0 | |||||
| 2025-07-08 | 13F | Parallel Advisors, LLC | 4,932 | 1.23 | 45 | 28.57 | ||||
| 2025-08-13 | 13F | Quadrant Capital Group Llc | 29,483 | 1.26 | 269 | 26.89 | ||||
| 2025-08-14 | 13F | Aquatic Capital Management LLC | 46,230 | 58.50 | 422 | 98.12 | ||||
| 2025-08-13 | 13F | Guggenheim Capital Llc | 36,963 | -4.79 | 337 | 19.08 | ||||
| 2025-08-13 | 13F | Northwestern Mutual Wealth Management Co | 1,049 | -4.64 | 10 | 12.50 | ||||
| 2025-08-07 | 13F | Allworth Financial LP | 13,227 | 6,683.08 | 121 | 11,900.00 | ||||
| 2025-08-07 | 13F | Connor, Clark & Lunn Investment Management Ltd. | 54,449 | 0.00 | 497 | 24.87 | ||||
| 2025-08-13 | 13F | Grantham, Mayo, Van Otterloo & Co. LLC | 83,173 | 0.00 | 759 | 25.04 | ||||
| 2025-08-14 | 13F | Quantinno Capital Management LP | 118,059 | 53.68 | 1,078 | 91.98 | ||||
| 2025-08-14 | 13F | Optiver Holding B.V. | 541,587 | 0.00 | 4,945 | 24.88 | ||||
| 2025-06-26 | NP | DFEM - Dimensional Emerging Markets Core Equity 2 ETF | 21,675 | 10.73 | 176 | 34.62 | ||||
| 2025-08-28 | NP | CNRG - SPDR S&P Kensho Clean Power ETF This fund is a listed as child fund of State Street Corp and if that institution has disclosed ownership in this security, then these positions will not be double counted when calculating total shares and total value | 60,901 | -50.52 | 556 | -38.15 | ||||
| 2025-08-14 | 13F | Jane Street Group, Llc | 0 | -100.00 | 0 | |||||
| 2025-07-16 | 13F | Signaturefd, Llc | 15,509 | 14.94 | 142 | 43.88 | ||||
| 2025-07-18 | 13F | Robeco Institutional Asset Management B.V. | 479,169 | -46.48 | 4,375 | -33.16 | ||||
| 2025-08-14 | 13F | Bank Of America Corp /de/ | 544,714 | 97.65 | 4,973 | 146.92 | ||||
| 2025-07-24 | 13F | PDS Planning, Inc | 23,064 | 2.61 | 211 | 28.05 | ||||
| 2025-05-15 | 13F | Citadel Advisors Llc | Call | 0 | -100.00 | 0 | -100.00 | |||
| 2025-08-19 | 13F | Asset Dedication, LLC | 922 | 0.00 | 8 | 33.33 | ||||
| 2025-07-30 | 13F | FNY Investment Advisers, LLC | 0 | -100.00 | 0 | |||||
| 2025-05-15 | 13F | Citadel Advisors Llc | Put | 0 | -100.00 | 0 | -100.00 | |||
| 2025-08-06 | 13F | True Wealth Design, LLC | 20 | 0.00 | 0 | |||||
| 2025-04-11 | 13F | First Affirmative Financial Network | 16,663 | 53.42 | 122 | 89.06 | ||||
| 2025-08-12 | 13F | BlackRock, Inc. | 1,235,793 | 4.35 | 11,283 | 30.32 | ||||
| 2025-05-05 | 13F | Eagle Bay Advisors LLC | 0 | -100.00 | 0 | -100.00 | ||||
| 2025-08-12 | 13F | SPX Equities Gestao de Recursos Ltda | 916,030 | -17.54 | 8,363 | 2.99 | ||||
| 2025-06-30 | NP | VGTSX - Vanguard Total International Stock Index Fund Investor Shares | 8,914 | 0.00 | 72 | 22.03 | ||||
| 2025-08-04 | 13F | Assetmark, Inc | 15 | 0 | ||||||
| 2025-08-13 | 13F | West Family Investments, Inc. | 13,105 | 0.00 | 120 | 25.26 | ||||
| 2025-08-14 | 13F | Vident Advisory, LLC | 102,641 | -3.12 | 937 | 21.06 | ||||
| 2025-08-14 | 13F | UBS Group AG | 17,957 | -54.90 | 164 | -43.99 | ||||
| 2025-08-12 | 13F | Clear Street Markets Llc | 0 | -100.00 | 0 | |||||
| 2025-09-04 | 13F/A | Advisor Group Holdings, Inc. | 402 | 332.26 | 4 | |||||
| 2025-07-24 | 13F | Jfs Wealth Advisors, Llc | 94 | 49.21 | 1 | |||||
| 2025-08-18 | 13F/A | National Bank Of Canada /fi/ | 405 | 4 | ||||||
| 2025-07-24 | 13F | Ronald Blue Trust, Inc. | 10,183 | -7.63 | 93 | 15.00 | ||||
| 2025-08-08 | 13F | Letko, Brosseau & Associates Inc | 6,704,446 | -0.15 | 61,212 | 24.71 | ||||
| 2025-08-13 | 13F | Hsbc Holdings Plc | 109,561 | 24.94 | 973 | 51.79 | ||||
| 2025-07-30 | NP | BRAZ - Global X Brazil Active ETF | 12,002 | 26.34 | 108 | 69.84 | ||||
| 2025-08-13 | 13F | Marshall Wace, Llp | 134,477 | 1,228 | ||||||
| 2025-07-29 | 13F | Wealthstream Advisors, Inc. | 13,590 | 29.79 | 124 | 63.16 | ||||
| 2025-08-08 | 13F | Larson Financial Group LLC | 24 | 0 | ||||||
| 2025-08-12 | 13F | SRS Capital Advisors, Inc. | 1,303 | 2.12 | 12 | 22.22 | ||||
| 2025-08-13 | 13F | Walleye Capital LLC | 12,092 | 110 | ||||||
| 2025-08-12 | 13F | Jpmorgan Chase & Co | 10,151 | 4,094.63 | 93 | 9,100.00 | ||||
| 2025-08-14 | 13F | Citadel Advisors Llc | 27,972 | 255 | ||||||
| 2025-06-26 | NP | DFSE - Dimensional Emerging Markets Sustainability Core 1 ETF | 11,475 | 13.33 | 93 | 38.81 | ||||
| 2025-08-21 | NP | SMOG - VanEck Vectors Low Carbon Energy ETF | 75,659 | -6.13 | 691 | 17.15 | ||||
| 2025-08-12 | 13F | CIBC Private Wealth Group, LLC | 391 | 4 | ||||||
| 2025-08-13 | 13F | Invesco Ltd. | 33,755 | 53.38 | 308 | 92.50 | ||||
| 2025-08-11 | 13F | Vanguard Group Inc | 1,767,272 | 0.00 | 16,135 | 24.90 | ||||
| 2025-08-13 | 13F | EverSource Wealth Advisors, LLC | 4,318 | 279.10 | 39 | 387.50 | ||||
| 2025-07-11 | 13F | Farther Finance Advisors, LLC | 318 | 1.60 | 3 | 0.00 | ||||
| 2025-04-29 | 13F | Lee Danner & Bass Inc | 0 | -100.00 | 0 | -100.00 | ||||
| 2025-05-28 | NP | EMIF - iShares Emerging Markets Infrastructure ETF | 20,452 | 0.41 | 150 | 24.17 | ||||
| 2025-08-11 | 13F | Banque Cantonale Vaudoise | 4,828 | 0.00 | 0 | |||||
| 2025-06-11 | NP | SLANX - DWS Latin America Equity Fund Class A | 29,109 | 185.97 | 236 | 252.24 | ||||
| 2025-06-26 | NP | DEXC - Dimensional Emerging Markets ex China Core Equity ETF | 12,051 | 21.10 | 98 | 46.97 | ||||
| 2025-06-30 | NP | VEU - Vanguard FTSE All-World ex-US Index Fund ETF Shares | 112,597 | 0.00 | 913 | 21.90 | ||||
| 2025-08-14 | 13F | Two Sigma Advisers, Lp | 80,420 | -54.16 | 734 | -42.75 | ||||
| 2025-06-26 | NP | Dfa Investment Trust Co - The Emerging Markets Series This fund is a listed as child fund of Dimensional Fund Advisors Lp and if that institution has disclosed ownership in this security, then these positions will not be double counted when calculating total shares and total value | 17,400 | 0.00 | 141 | 22.61 | ||||
| 2025-08-08 | 13F | Creative Planning | 121,104 | 18.43 | 1,106 | 47.93 | ||||
| 2025-08-08 | 13F | Pnc Financial Services Group, Inc. | 18,923 | 16.08 | 173 | 44.54 | ||||
| 2025-08-14 | 13F | State Street Corp | 60,901 | -50.52 | 556 | -38.15 | ||||
| 2025-08-14 | 13F | Raymond James Financial Inc | 108,577 | 91.22 | 991 | 138.80 | ||||
| 2025-08-12 | 13F | LPL Financial LLC | 26,909 | 99.25 | 246 | 150.00 | ||||
| 2025-08-12 | 13F | Dimensional Fund Advisors Lp | 174,232 | 15.69 | 1,586 | 44.18 | ||||
| 2025-08-14 | 13F | Cubist Systematic Strategies, LLC | 39,628 | 54.35 | 362 | 93.05 | ||||
| 2025-08-14 | 13F | Mercer Global Advisors Inc /adv | 11,729 | -1.78 | 107 | 22.99 | ||||
| 2025-08-14 | 13F | MIRAE ASSET GLOBAL ETFS HOLDINGS Ltd. | 15,852 | 87.60 | 145 | 136.07 | ||||
| 2025-08-14 | 13F | Van Eck Associates Corp | 75,659 | -6.13 | 1 | |||||
| 2025-08-14 | 13F | Ieq Capital, Llc | 13,670 | 125 | ||||||
| 2025-07-18 | 13F | PFG Investments, LLC | 10,202 | 93 | ||||||
| 2025-08-13 | 13F | Renaissance Technologies Llc | 381,718 | 131.62 | 3,485 | 189.45 | ||||
| 2025-08-14 | 13F | Mariner, LLC | 35,690 | 33.22 | 326 | 66.67 | ||||
| 2025-08-12 | 13F | Clearbridge Investments, LLC | 20,152 | 61.09 | 184 | 101.10 | ||||
| 2025-05-15 | 13F | Manufacturers Life Insurance Company, The | 0 | -100.00 | 0 | |||||
| 2025-08-04 | 13F | Hantz Financial Services, Inc. | 11,730 | 876.69 | 0 | |||||
| 2025-08-14 | 13F | Prelude Capital Management, Llc | 38,000 | -15.56 | 347 | 5.49 | ||||
| 2025-07-30 | 13F | Ethic Inc. | 39,022 | 7.36 | 348 | 28.52 | ||||
| 2025-08-07 | 13F | Sierra Ocean, Llc | 170 | 0.00 | 2 | 0.00 | ||||
| 2025-07-28 | NP | AVEEX - Avantis Emerging Markets Equity Fund Institutional Class This fund is a listed as child fund of American Century Companies Inc and if that institution has disclosed ownership in this security, then these positions will not be double counted when calculating total shares and total value | 14,158 | 0.00 | 127 | 35.11 | ||||
| 2025-08-14 | 13F | Boston Private Wealth Llc | 0 | -100.00 | 0 | |||||
| 2025-07-24 | 13F | Us Bancorp \de\ | 18,985 | 3.66 | 173 | 30.08 | ||||
| 2025-05-15 | 13F | Qube Research & Technologies Ltd | 0 | -100.00 | 0 | |||||
| 2025-08-14 | 13F | Royal Bank Of Canada | 1,922 | -75.17 | 18 | -67.86 | ||||
| 2025-07-25 | 13F | JustInvest LLC | 23,650 | 1.06 | 216 | 25.73 | ||||
| 2025-08-12 | 13F | Coldstream Capital Management Inc | 0 | -100.00 | 0 | |||||
| 2025-08-12 | 13F | Proequities, Inc. | 0 | 0 | ||||||
| 2025-08-14 | 13F | Millennium Management Llc | 104,417 | 953 | ||||||
| 2025-08-15 | 13F | Tower Research Capital LLC (TRC) | 3,116 | 36.25 | 28 | 75.00 | ||||
| 2025-08-05 | 13F | NewSquare Capital LLC | 188 | 261.54 | 2 | |||||
| 2025-07-14 | 13F | GAMMA Investing LLC | 10,968 | 40.71 | 100 | 78.57 | ||||
| 2025-07-31 | 13F | R Squared Ltd | 14,375 | 3.40 | 131 | 29.70 | ||||
| 2025-08-13 | 13F | Russell Investments Group, Ltd. | 31,980 | 0.00 | 292 | 24.89 | ||||
| 2025-06-18 | NP | RTXAX - Tax-Managed Real Assets Fund Class A | 31,980 | 0.00 | 259 | 22.17 | ||||
| 2025-08-14 | 13F | Aqr Capital Management Llc | 42,350 | -14.63 | 387 | 6.63 | ||||
| 2025-08-13 | 13F | Jones Financial Companies Lllp | 166 | 1 | ||||||
| 2025-08-11 | 13F | Citigroup Inc | 32,566 | -14.11 | 297 | 7.22 | ||||
| 2025-08-12 | 13F | O'shaughnessy Asset Management, Llc | 11,414 | -10.25 | 104 | 13.04 | ||||
| 2025-08-14 | 13F | Two Sigma Investments, Lp | 122,422 | -36.32 | 1,118 | -20.50 | ||||
| 2025-07-25 | 13F | Cwm, Llc | 6,063 | 9.03 | 0 | |||||
| 2025-08-12 | 13F | Atlas Capital Advisors Llc | 5,177 | 0.00 | 47 | 27.03 | ||||
| 2025-07-15 | 13F | Ballentine Partners, LLC | 29,435 | -7.06 | 269 | 16.02 | ||||
| 2025-08-14 | 13F | Wetherby Asset Management Inc | 26,191 | 20.27 | 239 | 85.27 | ||||
| 2025-05-07 | 13F | Sheaff Brock Investment Advisors, LLC | 13,000 | 0.00 | 95 | 23.38 | ||||
| 2025-08-11 | 13F | Bell Investment Advisors, Inc | 257 | 0.00 | 2 | 100.00 | ||||
| 2025-08-15 | 13F | Morgan Stanley | 1,017,792 | 8.83 | 9,292 | 35.93 | ||||
| 2025-07-21 | 13F | Mirae Asset Global Investments Co., Ltd. | 14,171 | 68.92 | 129 | 111.48 | ||||
| 2025-08-14 | 13F | Bnp Paribas Arbitrage, Sa | 25,876 | 185.10 | 236 | 257.58 | ||||
| 2025-08-12 | 13F | XTX Topco Ltd | 0 | -100.00 | 0 | |||||
| 2025-08-08 | 13F | SBI Securities Co., Ltd. | 151 | -1.31 | 1 | 0.00 | ||||
| 2025-08-08 | NP | QGBLX - Quantified Global Fund Investor Class | 37,017 | 338 | ||||||
| 2025-08-13 | 13F | Cerity Partners LLC | 13,402 | -3.07 | 122 | 20.79 | ||||
| 2025-07-28 | NP | NSI - National Security Emerging Markets Index ETF | 1,552 | 38.32 | 14 | 85.71 | ||||
| 2025-07-31 | 13F | Caitong International Asset Management Co., Ltd | 58 | -84.07 | 1 | -100.00 | ||||
| 2025-05-05 | 13F | Lindbrook Capital, Llc | 10,187 | 6.05 | 74 | 32.14 | ||||
| 2025-07-25 | 13F | Wealth Architects, LLC | 24,326 | -1.15 | 222 | 24.02 | ||||
| 2025-08-12 | 13F | American Century Companies Inc | 200,887 | -3.35 | 1,834 | 20.74 | ||||
| 2025-05-15 | 13F | Point72 Asset Management, L.P. | 0 | -100.00 | 0 | |||||
| 2025-08-13 | 13F | OMERS ADMINISTRATION Corp | 0 | -100.00 | 0 | |||||
| 2025-08-13 | 13F | First Trust Advisors Lp | 15,744 | -23.61 | 144 | -4.67 | ||||
| 2025-08-12 | 13F | MAI Capital Management | 658 | -64.39 | 6 | -53.85 | ||||
| 2025-08-27 | 13F/A | Squarepoint Ops LLC | 0 | -100.00 | 0 | -100.00 | ||||
| 2025-07-28 | NP | AVEM - Avantis Emerging Markets Equity ETF This fund is a listed as child fund of American Century Companies Inc and if that institution has disclosed ownership in this security, then these positions will not be double counted when calculating total shares and total value | 187,574 | 0.00 | 1,684 | 34.83 | ||||
| 2025-06-26 | NP | DFAE - Dimensional Emerging Core Equity Market ETF | 67,550 | 32.32 | 548 | 61.36 | ||||
| 2025-07-28 | 13F | Harbour Investments, Inc. | 96 | 0.00 | 1 | |||||
| 2025-08-11 | 13F | Trium Capital LLP | 0 | -100.00 | 0 | |||||
| 2025-08-14 | 13F | Federation des caisses Desjardins du Quebec | 1,200 | 11 | ||||||
| 2025-08-14 | 13F/A | Skopos Labs, Inc. | 18,893 | 199.22 | 172 | 273.91 | ||||
| 2025-04-22 | NP | APIE - ActivePassive International Equity ETF | 0 | -100.00 | 0 | -100.00 | ||||
| 2025-08-14 | 13F | Wells Fargo & Company/mn | 1,492 | 14 | ||||||
| 2025-07-28 | NP | AVSE - Avantis Responsible Emerging Markets Equity ETF | 6,581 | 13.25 | 59 | 55.26 | ||||
| 2025-08-13 | 13F | Twin Peaks Wealth Advisors, LLC | 304 | 3 | ||||||
| 2025-08-12 | 13F | Rhumbline Advisers | 47,395 | 0.60 | 433 | 25.58 | ||||
| 2025-08-14 | 13F | Brevan Howard Capital Management LP | 85,000 | 768 | ||||||
| 2025-05-15 | 13F | Engineers Gate Manager LP | 0 | -100.00 | 0 |