Mga Batayang Estadistika
| Pemilik Institusional | 128 total, 128 long only, 0 short only, 0 long/short - change of 15.32% MRQ |
| Alokasi Portofolio Rata-rata | 0.1469 % - change of -7.28% MRQ |
| Saham Institusional (Jangka Panjang) | 11,857,578 (ex 13D/G) - change of -1.38MM shares -10.41% MRQ |
| Nilai Institusional (Jangka Panjang) | $ 813,008 USD ($1000) |
Kepemilikan Institusional dan Pemegang Saham
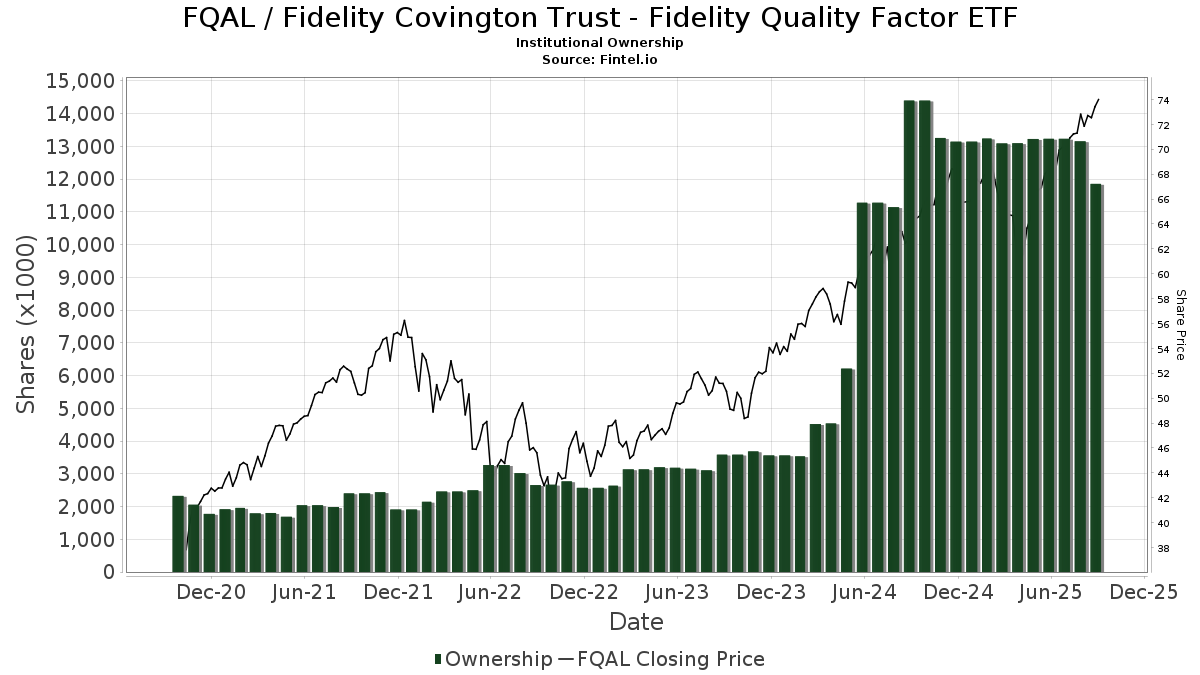
Fidelity Covington Trust - Fidelity Quality Factor ETF (US:FQAL) memiliki 128 pemilik institusional dan pemegang saham yang telah mengajukan formulir 13D/G atau 13F kepada Komisi Bursa Efek (Securities Exchange Commission/SEC). Lembaga-lembaga ini memegang total 11,857,578 saham. Pemegang saham terbesar meliputi Fmr Llc, Envestnet Asset Management Inc, Orgel Wealth Management, LLC, Kestra Advisory Services, LLC, High Probability Advisors, LLC, Great Lakes Retirement, Inc., Smith Chas P & Associates Pa Cpas, Jpmorgan Chase & Co, Commonwealth Equity Services, Llc, and Beacon Financial Group .
Struktur kepemilikan institusional Fidelity Covington Trust - Fidelity Quality Factor ETF (ARCA:FQAL) menunjukkan posisi terkini di perusahaan oleh institusi dan dana, serta perubahan terbaru dalam ukuran posisi. Pemegang saham utama dapat mencakup investor individu, reksa dana, dana lindung nilai, atau institusi. Jadwal 13D menunjukkan bahwa investor memegang (atau pernah memegang) lebih dari 5% saham perusahaan dan bermaksud (atau pernah bermaksud) untuk secara aktif mengejar perubahan strategi bisnis. Jadwal 13G menunjukkan investasi pasif lebih dari 5%.
The share price as of September 5, 2025 is 72.79 / share. Previously, on September 6, 2024, the share price was 61.27 / share. This represents an increase of 18.80% over that period.
Skor Sentimen Dana
Skor Sentimen Dana (sebelumnya dikenal sebagai Skor Akumulasi Kepemilikan) menemukan saham-saham yang paling banyak dibeli oleh dana. Ini adalah hasil dari model kuantitatif multi-faktor yang canggih yang mengidentifikasi perusahaan dengan tingkat akumulasi institusional tertinggi. Model penilaian menggunakan kombinasi dari total peningkatan pemilik yang diungkapkan, perubahan dalam alokasi portofolio pada pemilik tersebut, dan metrik lainnya. Angka berkisar dari 0 hingga 100, dengan angka yang lebih tinggi menunjukkan tingkat akumulasi yang lebih tinggi dibandingkan dengan perusahaan sejenisnya, dan 50 adalah rata-ratanya.
Frekuensi Pembaruan: Setiap Hari
Lihat Ownership Explorer, yang menyediakan daftar perusahaan dengan peringkat tertinggi.
Rasio Put/Call Institusional
Selain melaporkan isu ekuitas dan utang standar, institusi dengan aset di bawah manajemen lebih dari 100 juta dolar AS juga harus mengungkapkan kepemilikan opsi put dan call mereka. Karena opsi put umumnya menunjukkan sentimen negatif, dan opsi call menunjukkan sentimen positif, kita dapat mengetahui sentimen institusional secara keseluruhan dengan memplot rasio put terhadap call. Grafik di sebelah kanan memplot rasio put/call historis untuk instrumen ini.
Menggunakan Rasio Put/Call sebagai indikator sentimen investor mengatasi salah satu kekurangan utama dari penggunaan total kepemilikan institusional, yaitu sejumlah besar aset yang dikelola diinvestasikan secara pasif untuk melacak indeks. Dana yang dikelola secara pasif biasanya tidak membeli opsi, sehingga indikator rasio put/call lebih akurat dalam melacak sentimen dana yang dikelola secara aktif.
Pengajuan 13F dan NPORT
Detail pada pengajuan 13F tersedia gratis. Detail pada pengajuan NP memerlukan keanggotaan premium. Baris berwarna hijau menunjukkan posisi baru. Baris berwarna merah menunjukkan posisi yang sudah ditutup. Klik tautan ini ikon untuk melihat riwayat transaksi selengkapnya.
Tingkatkan
untuk membuka data premium dan mengekspor ke Excel ![]() .
.
| Tanggal File | Sumber | Investor | Ketik | Presyo ng Avg (Silangan) |
Saham | Δ Saham (%) |
Dilaporkan Nilai ($1000) |
Nilai Δ (%) |
Alokasi Port (%) |
|
|---|---|---|---|---|---|---|---|---|---|---|
| 2025-08-29 | 13F | Centaurus Financial, Inc. | 2,062 | -3.55 | 0 | |||||
| 2025-08-06 | 13F | True Wealth Design, LLC | 3,524 | -6.92 | 245 | 1.24 | ||||
| 2025-09-04 | 13F/A | Advisor Group Holdings, Inc. | 119,627 | -7.02 | 8,335 | 0.91 | ||||
| 2025-07-09 | 13F | Keystone Wealth Services, LLC | 5,599 | 40.29 | 390 | 51.95 | ||||
| 2025-08-01 | 13F | Envestnet Asset Management Inc | 1,101,814 | 0.03 | 76,719 | 8.55 | ||||
| 2025-07-10 | 13F | Hurlow Wealth Management Group, Inc. | 3,488 | 0.00 | 243 | 8.52 | ||||
| 2025-08-08 | 13F | TD Capital Management LLC | 3,665 | 0.30 | 255 | 8.97 | ||||
| 2025-08-07 | 13F | Nwam Llc | 3,311 | 236 | ||||||
| 2025-05-15 | 13F | Two Sigma Investments, Lp | 0 | -100.00 | 0 | |||||
| 2025-08-15 | 13F | Kestra Advisory Services, LLC | 608,828 | 9.51 | 42,393 | 18.85 | ||||
| 2025-08-11 | 13F | United Capital Financial Advisers, Llc | 3,036 | 211 | ||||||
| 2025-07-25 | 13F | Atria Wealth Solutions, Inc. | 15,449 | -27.76 | 1,076 | -21.65 | ||||
| 2025-08-14 | 13F | Fmr Llc | 6,156,607 | -19.49 | 428,685 | -12.63 | ||||
| 2025-08-18 | 13F/A | Kestra Investment Management, LLC | 3,215 | 224 | ||||||
| 2025-07-18 | 13F | Parsons Capital Management Inc/ri | 3,720 | -1.72 | 259 | 7.02 | ||||
| 2025-07-29 | 13F | Flavin Financial Services, Inc. | 11,025 | -3.17 | 768 | 5.07 | ||||
| 2025-07-17 | 13F | Beacon Capital Management, LLC | 30 | 0.00 | 2 | 100.00 | ||||
| 2025-08-11 | 13F | Aptus Capital Advisors, LLC | 97 | 1.04 | 7 | 0.00 | ||||
| 2025-04-10 | 13F | EWG Elevate Inc. | 0 | -100.00 | 0 | |||||
| 2025-07-23 | 13F | Madden Advisory Services, Inc. | 25,992 | -0.21 | 1,810 | 8.26 | ||||
| 2025-07-24 | 13F | Eastern Bank | 49 | 3 | ||||||
| 2025-07-28 | 13F | Axxcess Wealth Management, Llc | 0 | -100.00 | 0 | |||||
| 2025-08-06 | 13F | Hoxton Planning & Management, LLC | 6,578 | 0.00 | 458 | 8.53 | ||||
| 2025-08-07 | 13F | Kestra Private Wealth Services, Llc | 54,644 | 5.43 | 3,805 | 14.41 | ||||
| 2025-07-08 | 13F | Atlas Brown,Inc. | 7,052 | 0.37 | 491 | 9.11 | ||||
| 2025-07-30 | 13F | Rehmann Capital Advisory Group | 0 | -100.00 | 0 | |||||
| 2025-08-28 | NP | TFAGX - TFA AlphaGen Growth Fund Class I | 3,100 | 216 | ||||||
| 2025-07-25 | 13F | Cwm, Llc | 1,903 | 0 | ||||||
| 2025-08-14 | 13F | Old Mission Capital Llc | 4,885 | 340 | ||||||
| 2025-08-05 | 13F | Plante Moran Financial Advisors, LLC | 299 | 21 | ||||||
| 2025-08-14 | 13F | Qube Research & Technologies Ltd | 1,294 | 37.22 | 90 | 50.00 | ||||
| 2025-07-21 | 13F | Ameritas Advisory Services, LLC | 2,093 | 146 | ||||||
| 2025-07-09 | 13F | Christopher J. Hasenberg, Inc | 22 | 0.00 | 2 | 0.00 | ||||
| 2025-08-12 | 13F | MAI Capital Management | 834 | 0.00 | 58 | 9.43 | ||||
| 2025-04-30 | 13F | Stratos Wealth Partners, LTD. | 0 | -100.00 | 0 | |||||
| 2025-08-14 | 13F | Harwood Advisory Group, LLC | 0 | -100.00 | 0 | -100.00 | ||||
| 2025-08-19 | 13F | National Asset Management, Inc. | 15,500 | -0.55 | 1,079 | 5.89 | ||||
| 2025-08-14 | 13F | Bank Of America Corp /de/ | 46,814 | 3.21 | 3,260 | 11.99 | ||||
| 2025-08-11 | 13F | HighTower Advisors, LLC | 6,902 | -38.41 | 481 | -33.24 | ||||
| 2025-07-25 | 13F | Hobbs Group Advisors, LLC | 11,844 | 0.04 | 825 | 8.56 | ||||
| 2025-08-12 | 13F | J.w. Cole Advisors, Inc. | 7,740 | 539 | ||||||
| 2025-07-10 | 13F | Orgel Wealth Management, LLC | 951,038 | 0.70 | 66,221 | 9.29 | ||||
| 2025-08-06 | 13F | AE Wealth Management LLC | 19,159 | -74.50 | 1,334 | -72.33 | ||||
| 2025-08-12 | 13F | Global Retirement Partners, LLC | 2,087 | 5.62 | 145 | 12.40 | ||||
| 2025-08-14 | 13F | Fwl Investment Management, Llc | 5,563 | -14.24 | 387 | -6.97 | ||||
| 2025-07-30 | 13F | Strategic Blueprint, LLC | 12,493 | 870 | ||||||
| 2025-07-22 | 13F | Iron Horse Wealth Management, LLC | 0 | -100.00 | 0 | |||||
| 2025-07-08 | 13F | Canandaigua National Bank & Trust Co | 3,720 | 259 | ||||||
| 2025-08-08 | 13F | OmniStar Financial Group, Inc. | 25,134 | 1.24 | 1,750 | 9.51 | ||||
| 2025-05-16 | 13F | Jones Financial Companies Lllp | 0 | -100.00 | 0 | |||||
| 2025-08-08 | 13F | Pnc Financial Services Group, Inc. | 2,636 | -5.01 | 184 | 2.81 | ||||
| 2025-08-04 | 13F | Assetmark, Inc | 10 | 0.00 | 1 | |||||
| 2025-07-15 | 13F | Colonial River Wealth Management, LLC | 0 | -100.00 | 0 | |||||
| 2025-07-15 | 13F | LVZ Advisors, Inc. | 25,947 | 1,807 | ||||||
| 2025-07-16 | 13F | Beaumont Financial Advisors, LLC | 0 | -100.00 | 0 | |||||
| 2025-07-31 | 13F | Sequent Asset Management, LLC | 31,571 | -1.75 | 2,198 | 6.65 | ||||
| 2025-08-08 | 13F | Mv Capital Management, Inc. | 4,209 | 0.00 | 293 | 8.52 | ||||
| 2025-08-14 | 13F | Glen Eagle Advisors, LLC | 6,357 | -52.96 | 443 | -49.02 | ||||
| 2025-08-12 | 13F | Jpmorgan Chase & Co | 228,984 | 29.19 | 15,944 | 40.22 | ||||
| 2025-07-10 | 13F | Wealth Enhancement Advisory Services, Llc | 32,903 | -2.48 | 2,317 | 7.02 | ||||
| 2025-07-18 | 13F | Dogwood Wealth Management LLC | 25 | 2 | ||||||
| 2025-08-15 | 13F | Semmax Financial Advisors Inc. | 108 | 0.00 | 8 | 16.67 | ||||
| 2025-08-13 | 13F | Colonial Trust Co / SC | 281 | -85.33 | 19 | -84.30 | ||||
| 2025-08-12 | 13F | PKS Advisory Services, LLC | 19,979 | 5.14 | 1,391 | 14.11 | ||||
| 2025-08-12 | 13F | Steward Partners Investment Advisory, Llc | 465 | -4.12 | 32 | 3.23 | ||||
| 2025-08-08 | 13F | Foundations Investment Advisors, LLC | 17,857 | 28.42 | 1,243 | 39.35 | ||||
| 2025-08-14 | 13F | GWM Advisors LLC | 32,882 | 25.17 | 2,290 | 35.85 | ||||
| 2025-07-29 | 13F | AssuredPartners Investment Advisors, LLC | 7,937 | -13.61 | 553 | -6.28 | ||||
| 2025-08-14 | 13F | Jane Street Group, Llc | 16,967 | 53.09 | 1,181 | 66.10 | ||||
| 2025-07-22 | 13F | Unique Wealth, Llc | 40,950 | -33.59 | 2,851 | -27.93 | ||||
| 2025-07-31 | 13F | Cambridge Investment Research Advisors, Inc. | 3,174 | -89.98 | 0 | -100.00 | ||||
| 2025-08-14 | 13F | Royal Bank Of Canada | 24,409 | 1,076.90 | 1,700 | 1,178.20 | ||||
| 2025-07-23 | 13F | Colony Family Offices, LLC | 3,428 | 239 | ||||||
| 2025-08-28 | NP | TFAFX - Tactical Growth Allocation Fund Class I | 830 | 58 | ||||||
| 2025-07-21 | 13F | Ascent Group, LLC | 3,963 | 2.40 | 276 | 10.89 | ||||
| 2025-07-24 | 13F | Cyndeo Wealth Partners, LLC | 5,847 | 9.99 | 407 | 19.35 | ||||
| 2025-08-14 | 13F | Raymond James Financial Inc | 478 | 33 | ||||||
| 2025-07-31 | 13F | Briaud Financial Planning, Inc | 54 | 0 | ||||||
| 2025-08-08 | 13F | Cetera Investment Advisers | 115,368 | 6.48 | 8,033 | 15.57 | ||||
| 2025-08-05 | 13F | Bank Of Montreal /can/ | 3,764 | 6.03 | 262 | 15.42 | ||||
| 2025-07-25 | 13F | Johnson Investment Counsel Inc | 3,135 | -3.30 | 218 | 4.81 | ||||
| 2025-08-13 | 13F | Northwestern Mutual Wealth Management Co | 26,501 | 1.82 | 1,845 | 10.55 | ||||
| 2025-07-09 | 13F | Beacon Financial Group | 158,907 | -7.78 | 11,065 | 0.08 | ||||
| 2025-08-04 | 13F | Spire Wealth Management | 660 | -72.95 | 46 | -71.15 | ||||
| 2025-07-11 | 13F | SILVER OAK SECURITIES, Inc | 6,471 | -73.90 | 451 | -71.45 | ||||
| 2025-07-28 | 13F | Sagespring Wealth Partners, Llc | 119,494 | 3.91 | 8,320 | 12.77 | ||||
| 2025-08-12 | 13F | O'shaughnessy Asset Management, Llc | 1,465 | 827.22 | 102 | 920.00 | ||||
| 2025-04-21 | 13F | Nelson, Van Denburg & Campbell Wealth Management Group, LLC | 0 | -100.00 | 0 | |||||
| 2025-08-11 | 13F | TD Waterhouse Canada Inc. | 9,879 | 9.18 | 688 | 18.42 | ||||
| 2025-08-08 | 13F | Altfest L J & Co Inc | 8,499 | 0.60 | 592 | 9.04 | ||||
| 2025-08-04 | 13F | Great Lakes Retirement, Inc. | 239,492 | -0.59 | 16,676 | 7.88 | ||||
| 2025-08-14 | 13F | Mariner, LLC | 16,106 | 4.08 | 1,121 | 13.00 | ||||
| 2025-05-02 | 13F | Capital A Wealth Management, LLC | 13 | 0.00 | 1 | |||||
| 2025-07-23 | 13F | Prime Capital Investment Advisors, LLC | 12,619 | -76.83 | 879 | -74.87 | ||||
| 2025-08-07 | 13F | Allworth Financial LP | 38,316 | 0.37 | 2,668 | 11.50 | ||||
| 2025-08-14 | 13F | Goldman Sachs Group Inc | 25,073 | 70.14 | 1,746 | 84.66 | ||||
| 2025-08-12 | 13F | Weaver Consulting Group | 3,757 | 0.00 | 262 | 8.30 | ||||
| 2025-08-13 | 13F | Lido Advisors, LLC | 19,032 | -2.44 | 1,325 | 5.92 | ||||
| 2025-08-05 | 13F | Sigma Planning Corp | 6,606 | 5.98 | 460 | 15.29 | ||||
| 2025-07-29 | 13F | Beverly Hills Private Wealth, LLC | 4,532 | -12.66 | 316 | -5.12 | ||||
| 2025-08-12 | 13F | Proequities, Inc. | 0 | 0 | ||||||
| 2025-08-06 | 13F | Stone House Investment Management, LLC | 6,726 | 469.04 | 468 | 524.00 | ||||
| 2025-08-08 | 13F | Capital Investment Counsel, Inc | 2,570 | 0.00 | 179 | 8.54 | ||||
| 2025-07-15 | 13F | Bfsg, Llc | 401 | 39.72 | 28 | 50.00 | ||||
| 2025-08-13 | 13F | Twin Peaks Wealth Advisors, LLC | 836 | 61 | ||||||
| 2025-08-14 | 13F | UBS Group AG | 0 | -100.00 | 0 | |||||
| 2025-08-06 | 13F | Adviser Investments LLC | 5,690 | -37.15 | 396 | -31.72 | ||||
| 2025-08-04 | 13F | Creekmur Asset Management LLC | 185 | 0.54 | 13 | 9.09 | ||||
| 2025-07-31 | 13F | CNB Bank | 375 | 0.00 | 26 | 8.33 | ||||
| 2025-08-14 | 13F | Susquehanna International Group, Llp | 12,622 | -30.91 | 879 | -25.09 | ||||
| 2025-07-25 | 13F | Almanack Investment Partners, LLC. | 4,940 | 0.00 | 344 | 8.86 | ||||
| 2025-08-08 | 13F | Biondo Investment Advisors, LLC | 24,853 | -0.70 | 1,730 | 7.79 | ||||
| 2025-08-06 | 13F | Golden State Wealth Management, LLC | 121 | 0.00 | 8 | 14.29 | ||||
| 2025-07-29 | 13F | Quotient Wealth Partners, LLC | 39,131 | -8.08 | 2,725 | -0.26 | ||||
| 2025-08-14 | 13F | Mercer Global Advisors Inc /adv | 19,208 | 8.94 | 1,337 | 18.21 | ||||
| 2025-07-23 | 13F | Valmark Advisers, Inc. | 16,283 | 12.37 | 1,134 | 21.96 | ||||
| 2025-07-24 | 13F | Us Bancorp \de\ | 0 | -100.00 | 0 | |||||
| 2025-08-14 | 13F | EP Wealth Advisors, Inc. | 2,328 | 162 | ||||||
| 2025-08-14 | 13F/A | Rockefeller Capital Management L.P. | 44,412 | 8.13 | 3,092 | 17.34 | ||||
| 2025-07-17 | 13F | Sound Income Strategies, LLC | 17 | 1 | ||||||
| 2025-08-01 | 13F | Logan Capital Management Inc | 36 | 0.00 | 3 | 0.00 | ||||
| 2025-08-13 | 13F | Flow Traders U.s. Llc | 3,306 | 0 | ||||||
| 2025-08-08 | 13F | Creative Planning | 3,272 | 228 | ||||||
| 2025-08-13 | 13F | Russell Investments Group, Ltd. | 57 | 4 | ||||||
| 2025-07-30 | 13F | Cullen/frost Bankers, Inc. | 6,558 | 15.15 | 457 | 24.93 | ||||
| 2025-08-12 | 13F | CIBC Private Wealth Group, LLC | 722 | 50 | ||||||
| 2025-08-13 | 13F | First Trust Advisors Lp | 16,054 | 0.44 | 1,118 | 8.98 | ||||
| 2025-08-14 | 13F | Wells Fargo & Company/mn | 1,160 | 8.31 | 81 | 17.65 | ||||
| 2025-08-06 | 13F | Commonwealth Equity Services, Llc | 164,776 | 8.11 | 11 | 22.22 | ||||
| 2025-08-12 | 13F | LPL Financial LLC | 74,392 | 17.01 | 5,180 | 26.97 | ||||
| 2025-08-14 | 13F | Citadel Advisors Llc | 35,716 | 337.80 | 2,487 | 375.33 | ||||
| 2025-08-14 | 13F | Clarity Asset Management, Inc. | 525 | -50.28 | 37 | -46.27 | ||||
| 2025-08-11 | 13F | Lighthouse Financial LLC | 6,000 | 0.00 | 418 | 8.59 | ||||
| 2025-08-14 | 13F | Sunbelt Securities, Inc. | 99,855 | -1.74 | 6,533 | 0.20 | ||||
| 2025-07-09 | 13F | High Probability Advisors, LLC | 294,508 | 4.91 | 20,507 | 13.85 | ||||
| 2025-08-11 | 13F | Independent Advisor Alliance | 18,077 | 0.83 | 1,259 | 9.39 | ||||
| 2025-08-15 | 13F | Morgan Stanley | 63,787 | -0.04 | 4,442 | 8.48 | ||||
| 2025-08-13 | 13F | Cerity Partners LLC | 36,125 | 70.38 | 2,515 | 84.93 | ||||
| 2025-07-17 | 13F | Smith Chas P & Associates Pa Cpas | 233,162 | -2.57 | 16,235 | 5.74 | ||||
| 2025-07-24 | 13F | IFP Advisors, Inc | 923 | 26.61 | 64 | 39.13 | ||||
| 2025-08-11 | 13F | Principal Securities, Inc. | 763 | -2.30 | 53 | 3.92 | ||||
| 2025-07-25 | 13F | Envestnet Portfolio Solutions, Inc. | 23,330 | 11.94 | 1,624 | 21.47 |