Mga Batayang Estadistika
| Pemilik Institusional | 163 total, 163 long only, 0 short only, 0 long/short - change of 13.99% MRQ |
| Alokasi Portofolio Rata-rata | 0.4319 % - change of -6.86% MRQ |
| Saham Institusional (Jangka Panjang) | 39,158,216 (ex 13D/G) - change of 2.69MM shares 7.38% MRQ |
| Nilai Institusional (Jangka Panjang) | $ 961,480 USD ($1000) |
Kepemilikan Institusional dan Pemegang Saham
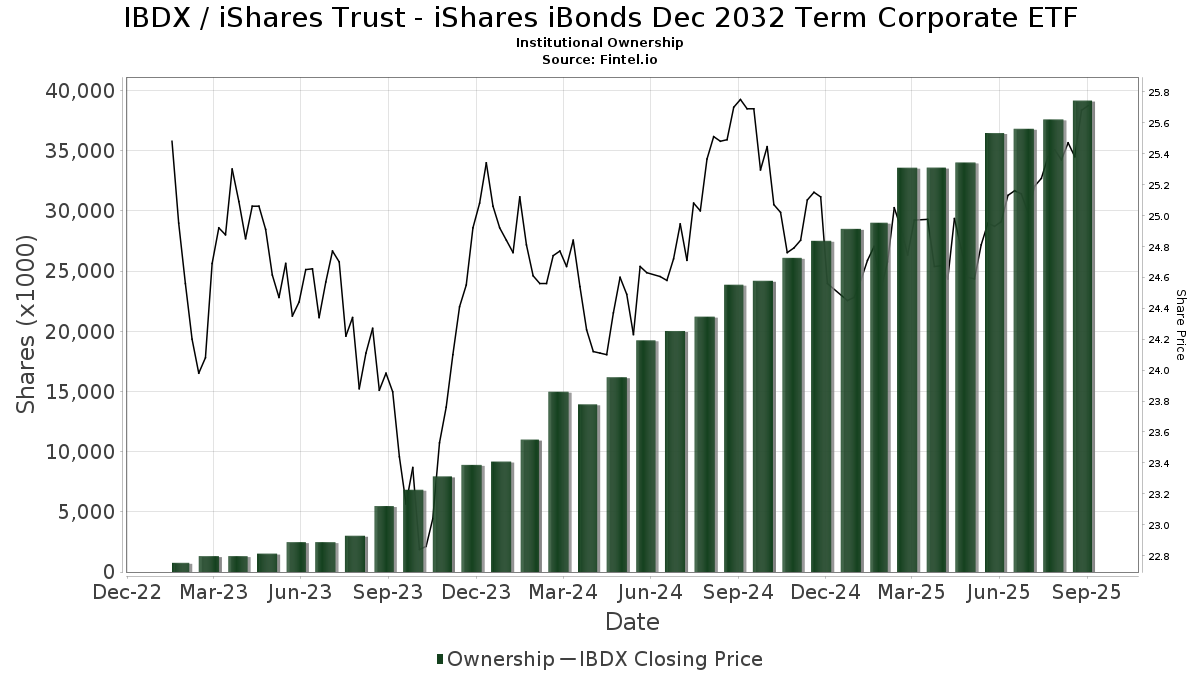
iShares Trust - iShares iBonds Dec 2032 Term Corporate ETF (US:IBDX) memiliki 163 pemilik institusional dan pemegang saham yang telah mengajukan formulir 13D/G atau 13F kepada Komisi Bursa Efek (Securities Exchange Commission/SEC). Lembaga-lembaga ini memegang total 39,158,216 saham. Pemegang saham terbesar meliputi Aptus Capital Advisors, LLC, DRSK - Aptus Defined Risk ETF, Capital Investment Advisors, LLC, Wells Fargo & Company/mn, Bank Of America Corp /de/, First Interstate Bank, Morgan Stanley, Sigma Investment Counselors Inc, Summitry Llc, and Mv Capital Management, Inc. .
Struktur kepemilikan institusional iShares Trust - iShares iBonds Dec 2032 Term Corporate ETF (ARCA:IBDX) menunjukkan posisi terkini di perusahaan oleh institusi dan dana, serta perubahan terbaru dalam ukuran posisi. Pemegang saham utama dapat mencakup investor individu, reksa dana, dana lindung nilai, atau institusi. Jadwal 13D menunjukkan bahwa investor memegang (atau pernah memegang) lebih dari 5% saham perusahaan dan bermaksud (atau pernah bermaksud) untuk secara aktif mengejar perubahan strategi bisnis. Jadwal 13G menunjukkan investasi pasif lebih dari 5%.
The share price as of September 5, 2025 is 25.63 / share. Previously, on September 6, 2024, the share price was 25.58 / share. This represents an increase of 0.20% over that period.
Skor Sentimen Dana
Skor Sentimen Dana (sebelumnya dikenal sebagai Skor Akumulasi Kepemilikan) menemukan saham-saham yang paling banyak dibeli oleh dana. Ini adalah hasil dari model kuantitatif multi-faktor yang canggih yang mengidentifikasi perusahaan dengan tingkat akumulasi institusional tertinggi. Model penilaian menggunakan kombinasi dari total peningkatan pemilik yang diungkapkan, perubahan dalam alokasi portofolio pada pemilik tersebut, dan metrik lainnya. Angka berkisar dari 0 hingga 100, dengan angka yang lebih tinggi menunjukkan tingkat akumulasi yang lebih tinggi dibandingkan dengan perusahaan sejenisnya, dan 50 adalah rata-ratanya.
Frekuensi Pembaruan: Setiap Hari
Lihat Ownership Explorer, yang menyediakan daftar perusahaan dengan peringkat tertinggi.
Rasio Put/Call Institusional
Selain melaporkan isu ekuitas dan utang standar, institusi dengan aset di bawah manajemen lebih dari 100 juta dolar AS juga harus mengungkapkan kepemilikan opsi put dan call mereka. Karena opsi put umumnya menunjukkan sentimen negatif, dan opsi call menunjukkan sentimen positif, kita dapat mengetahui sentimen institusional secara keseluruhan dengan memplot rasio put terhadap call. Grafik di sebelah kanan memplot rasio put/call historis untuk instrumen ini.
Menggunakan Rasio Put/Call sebagai indikator sentimen investor mengatasi salah satu kekurangan utama dari penggunaan total kepemilikan institusional, yaitu sejumlah besar aset yang dikelola diinvestasikan secara pasif untuk melacak indeks. Dana yang dikelola secara pasif biasanya tidak membeli opsi, sehingga indikator rasio put/call lebih akurat dalam melacak sentimen dana yang dikelola secara aktif.
Pengajuan 13F dan NPORT
Detail pada pengajuan 13F tersedia gratis. Detail pada pengajuan NP memerlukan keanggotaan premium. Baris berwarna hijau menunjukkan posisi baru. Baris berwarna merah menunjukkan posisi yang sudah ditutup. Klik tautan ini ikon untuk melihat riwayat transaksi selengkapnya.
Tingkatkan
untuk membuka data premium dan mengekspor ke Excel ![]() .
.
| Tanggal File | Sumber | Investor | Ketik | Presyo ng Avg (Silangan) |
Saham | Δ Saham (%) |
Dilaporkan Nilai ($1000) |
Nilai Δ (%) |
Alokasi Port (%) |
|
|---|---|---|---|---|---|---|---|---|---|---|
| 2025-08-14 | 13F | Wells Fargo & Company/mn | 2,675,128 | 3.42 | 67,641 | 4.64 | ||||
| 2025-07-16 | 13F | Gradient Capital Advisors, LLC | 32,548 | 0.02 | 823 | 1.11 | ||||
| 2025-08-12 | 13F | BlackRock, Inc. | 50 | 0.00 | 1 | 0.00 | ||||
| 2025-09-04 | 13F/A | Advisor Group Holdings, Inc. | 7,666 | -56.80 | 194 | -56.43 | ||||
| 2025-07-21 | 13F | Precedent Wealth Partners, Llc | 126,582 | 11.17 | 3,201 | 12.48 | ||||
| 2025-08-08 | 13F | Summitry Llc | 1,053,450 | 23.39 | 26,636 | 24.84 | ||||
| 2025-08-08 | 13F | Creative Planning | 0 | -100.00 | 0 | |||||
| 2025-08-13 | 13F | Lido Advisors, LLC | 160,433 | 2.59 | 4,057 | 3.79 | ||||
| 2025-08-06 | 13F | Commonwealth Equity Services, Llc | 345,959 | -1.50 | 9 | 0.00 | ||||
| 2025-08-11 | 13F | United Capital Financial Advisers, Llc | 56,010 | 4.97 | 1,416 | 6.15 | ||||
| 2025-08-07 | 13F | Sound View Wealth Advisors Group, LLC | 657,139 | 20.96 | 16,616 | 22.39 | ||||
| 2025-08-04 | 13F | REDW Wealth LLC | 41,744 | 1.75 | 1,055 | 2.93 | ||||
| 2025-08-14 | 13F | Mercer Global Advisors Inc /adv | 55,983 | 9.91 | 1,416 | 11.24 | ||||
| 2025-08-11 | 13F | Banque Cantonale Vaudoise | 5,298 | 0.00 | 0 | |||||
| 2025-04-29 | 13F | Element Wealth, LLC | 0 | -100.00 | 0 | |||||
| 2025-08-11 | 13F | Arrow Financial Corp | 591,999 | -0.87 | 14,969 | 0.30 | ||||
| 2025-05-07 | 13F | Spectrum Wealth Counsel, LLC | 15,544 | 1,072.25 | 388 | 1,112.50 | ||||
| 2025-07-30 | 13F | Granite Harbor Advisors, Inc. | 26,567 | 672 | ||||||
| 2025-08-14 | 13F | Mml Investors Services, Llc | 21,891 | -37.08 | 1 | |||||
| 2025-04-17 | 13F | Montecito Bank & Trust | 28,265 | 1.00 | 706 | 2.77 | ||||
| 2025-05-14 | 13F | Van Hulzen Asset Management, LLC | 0 | -100.00 | 0 | -100.00 | ||||
| 2025-07-14 | 13F | McGlone Suttner Wealth Management, Inc. | 45,000 | 0.69 | 1,138 | 1.88 | ||||
| 2025-07-08 | 13F | Parallel Advisors, LLC | 218,176 | 8.66 | 5,517 | 9.95 | ||||
| 2025-08-11 | 13F | Guidance Point Advisors, LLC | 278,413 | 0.82 | 7,040 | 2.00 | ||||
| 2025-04-29 | 13F | Hm Payson & Co | 1,177 | 29 | ||||||
| 2025-08-01 | 13F | Envestnet Asset Management Inc | 224,932 | 16.49 | 5,687 | 17.87 | ||||
| 2025-08-11 | 13F | Aptus Capital Advisors, LLC | 4,261,556 | 6.42 | 107,753 | 7.68 | ||||
| 2025-08-14 | 13F | GWM Advisors LLC | 125,946 | -24.95 | 3,185 | -24.06 | ||||
| 2025-08-13 | 13F | Peloton Wealth Strategists | 52,500 | 0.00 | 1 | 0.00 | ||||
| 2025-06-27 | NP | DRSK - Aptus Defined Risk ETF | 4,090,943 | 9.52 | 102,192 | 10.81 | ||||
| 2025-07-22 | 13F | Belpointe Asset Management LLC | 16,612 | 420 | ||||||
| 2025-08-15 | 13F | Captrust Financial Advisors | 29,042 | -17.13 | 734 | -16.11 | ||||
| 2025-08-11 | 13F | Stonebrook Private Inc. | 88,004 | 2.77 | 2,225 | 3.97 | ||||
| 2025-08-14 | 13F | Jupiter Wealth Management LLC | 5,100 | 130 | ||||||
| 2025-08-14 | 13F | Wilkins Miller Wealth Management, LLC | 55,345 | -10.48 | 1,399 | -9.39 | ||||
| 2025-08-12 | 13F | Associated Banc-corp | 40,939 | 10.50 | 1,035 | 11.89 | ||||
| 2025-08-15 | 13F | Howland Capital Management Llc | 32,890 | 52.96 | 832 | 54.75 | ||||
| 2025-08-08 | 13F | Cetera Investment Advisers | 68,529 | 20.73 | 1,733 | 22.14 | ||||
| 2025-07-16 | 13F | Evergreen Private Wealth LLC | 130,682 | 7.13 | 3,304 | 8.40 | ||||
| 2025-08-14 | 13F | Royal Bank Of Canada | 349,038 | -4.15 | 8,826 | -3.01 | ||||
| 2025-08-01 | 13F | Bank of Jackson Hole Trust | 226 | 0.00 | 6 | 0.00 | ||||
| 2025-08-19 | 13F | Advisory Services Network, LLC | 14,320 | 6.61 | 361 | 7.76 | ||||
| 2025-07-09 | 13F | Chesley Taft & Associates LLC | 28,800 | 203.16 | 728 | 207.17 | ||||
| 2025-08-12 | 13F | LPL Financial LLC | 262,135 | 10.20 | 6,628 | 11.51 | ||||
| 2025-08-14 | 13F | Headinvest, Llc | 36,890 | 0.00 | 933 | 1.19 | ||||
| 2025-07-09 | 13F | Byrne Asset Management LLC | 0 | -100.00 | 0 | |||||
| 2025-08-14 | 13F | Frisch Financial Group, Inc. | 132,456 | 3 | ||||||
| 2025-07-25 | 13F | Cwm, Llc | 103,231 | 2.87 | 3 | 0.00 | ||||
| 2025-08-13 | 13F | Hendershot Investments Inc. | 8,156 | 0.00 | 206 | 1.48 | ||||
| 2025-07-09 | 13F | Stony Point Wealth Management Inc. | 421,817 | -2.95 | 10,666 | -1.80 | ||||
| 2025-07-23 | 13F | Valmark Advisers, Inc. | 9,767 | 11.28 | 247 | 12.33 | ||||
| 2025-07-16 | 13F | NovaPoint Capital, LLC | 41,836 | 0.89 | 1,058 | 2.03 | ||||
| 2025-08-04 | 13F | Roble, Belko & Company, Inc | 10,247 | 44.06 | 0 | |||||
| 2025-07-07 | 13F | Trust Co | 1,979 | 0.00 | 50 | 2.04 | ||||
| 2025-07-23 | 13F | Meitav Dash Investments Ltd | 36,322 | 11.26 | 917 | 12.52 | ||||
| 2025-08-05 | 13F | Cherry Tree Wealth Management, LLC | 12,273 | 40.55 | 310 | 42.20 | ||||
| 2025-08-14 | 13F | Mariner, LLC | 70,106 | 6.93 | 1,773 | 8.18 | ||||
| 2025-04-15 | 13F | First United Bank Trust/ | 0 | -100.00 | 0 | |||||
| 2025-08-14 | 13F | Comerica Bank | 17,484 | -9.66 | 442 | -8.49 | ||||
| 2025-08-14 | 13F | Benjamin Edwards Inc | 180,505 | -5.24 | 4,564 | -4.12 | ||||
| 2025-04-30 | 13F | Stratos Wealth Partners, LTD. | 0 | -100.00 | 0 | |||||
| 2025-08-14 | 13F | UBS Group AG | 736,785 | -15.00 | 18,630 | -13.99 | ||||
| 2025-08-12 | 13F | Cowa, Llc | 312,775 | 86.34 | 7,899 | 88.32 | ||||
| 2025-08-12 | 13F | Farmers National Bank | 28,010 | 1.53 | 708 | 2.76 | ||||
| 2025-08-15 | 13F | Koesten, Hirschmann & Crabtree, INC. | 7,315 | 8.53 | 185 | 9.52 | ||||
| 2025-05-13 | 13F | Steward Partners Investment Advisory, Llc | 0 | -100.00 | 0 | |||||
| 2025-08-14 | 13F | Ameriprise Financial Inc | 808,343 | 26.93 | 20,243 | 27.20 | ||||
| 2025-07-11 | 13F | Quantum Financial Advisors, LLC | 66,646 | 4.87 | 1,685 | 6.11 | ||||
| 2025-08-08 | 13F | Avantax Advisory Services, Inc. | 18,434 | 7.07 | 466 | 8.37 | ||||
| 2025-07-17 | 13F | Archford Capital Strategies, LLC | 79,915 | -4.79 | 2,021 | -3.67 | ||||
| 2025-07-01 | 13F | Harbor Investment Advisory, Llc | 2,000 | 0.00 | 51 | 2.04 | ||||
| 2025-08-14 | 13F | Citadel Advisors Llc | 247,692 | 8.35 | 6,263 | 9.63 | ||||
| 2025-08-06 | 13F | Atlantic Union Bankshares Corp | 219,947 | 5,561 | ||||||
| 2025-08-07 | 13F | Kestra Private Wealth Services, Llc | 12,630 | 319 | ||||||
| 2025-08-07 | 13F | CENTRAL TRUST Co | 2,922 | -8.43 | 74 | -7.59 | ||||
| 2025-07-18 | 13F | Centricity Wealth Management, LLC | 1,625 | 0.00 | 41 | 2.50 | ||||
| 2025-08-01 | 13F | First National Trust Co | 13,560 | 3.09 | 343 | 4.27 | ||||
| 2025-08-11 | 13F | Annis Gardner Whiting Capital Advisors, LLC | 1,083 | 27 | ||||||
| 2025-05-06 | 13F | Venturi Wealth Management, LLC | 0 | -100.00 | 0 | |||||
| 2025-07-14 | 13F | Sowell Financial Services LLC | 10,515 | 266 | ||||||
| 2025-05-12 | 13F | Sandy Spring Bank | 216,387 | 6.60 | 5,408 | 8.38 | ||||
| 2025-08-04 | 13F | Arkadios Wealth Advisors | 9,315 | -3.95 | 236 | -2.89 | ||||
| 2025-08-04 | 13F | Assetmark, Inc | 0 | -100.00 | 0 | |||||
| 2025-08-15 | 13F | Morgan Stanley | 1,596,453 | 8.94 | 40,366 | 10.22 | ||||
| 2025-08-12 | 13F | Reliant Wealth Planning | 44,557 | 1,127 | ||||||
| 2025-05-16 | 13F | Coppell Advisory Solutions LLC | 0 | -100.00 | 0 | |||||
| 2025-08-12 | 13F | Global Retirement Partners, LLC | 274 | 7 | ||||||
| 2025-08-14 | 13F | Evergreen Wealth Solutions, LLC | 75,833 | -7.81 | 1,917 | -6.72 | ||||
| 2025-08-14 | 13F | STAR Financial Bank | 73,185 | 89.33 | 1,850 | 91.71 | ||||
| 2025-08-08 | 13F | Wrapmanager Inc | 137,444 | 3,475 | ||||||
| 2025-08-07 | 13F | Allworth Financial LP | 849 | 0.00 | 21 | 0.00 | ||||
| 2025-08-13 | 13F | Beacon Pointe Advisors, LLC | 31,865 | 3.45 | 806 | 4.68 | ||||
| 2025-07-30 | 13F | First Interstate Bank | 1,985,980 | -2.21 | 50,216 | -1.05 | ||||
| 2025-08-04 | 13F | Creative Financial Designs Inc /adv | 206 | 0.00 | 5 | 0.00 | ||||
| 2025-04-23 | 13F | Sabal Trust CO | 196,089 | 11.36 | 4,900 | 13.22 | ||||
| 2025-07-23 | 13F | Ironwood Financial, llc | 24,410 | 0.00 | 610 | 0.00 | ||||
| 2025-08-12 | 13F | Cooper/haims Advisors, Llc | 10,407 | 0.00 | 263 | 1.15 | ||||
| 2025-07-09 | 13F | Bank of New Hampshire | 7,030 | 603.00 | 178 | 637.50 | ||||
| 2025-08-11 | 13F | PFG Private Wealth Management, LLC | 446,942 | 2.96 | 11,301 | 4.18 | ||||
| 2025-07-31 | 13F | Keeler THomas Management LLC | 35,950 | 49.97 | 909 | 51.59 | ||||
| 2025-08-06 | 13F | Adviser Investments LLC | 154,504 | 2.15 | 3,907 | 3.36 | ||||
| 2025-08-11 | 13F | Private Advisor Group, LLC | 24,329 | 40.92 | 615 | 42.69 | ||||
| 2025-08-14 | 13F | Glenview Trust Co | 20,534 | 69.23 | 519 | 71.29 | ||||
| 2025-07-22 | 13F | 4Thought Financial Group Inc. | 192,006 | 13.33 | 4,855 | 14.67 | ||||
| 2025-08-13 | 13F | Jones Financial Companies Lllp | 5,710 | 307.86 | 144 | 323.53 | ||||
| 2025-08-13 | 13F | Northwestern Mutual Wealth Management Co | 26,958 | 28.54 | 682 | 29.96 | ||||
| 2025-08-13 | 13F | StoneX Group Inc. | 12,889 | 1.08 | 326 | 2.20 | ||||
| 2025-08-14 | 13F | Jane Street Group, Llc | 0 | -100.00 | 0 | |||||
| 2025-08-07 | 13F | Nwam Llc | 9,528 | 240 | ||||||
| 2025-07-24 | 13F | IFP Advisors, Inc | 32,288 | 17.00 | 816 | 18.43 | ||||
| 2025-08-07 | 13F | Gryphon Financial Partners LLC | 19,564 | 495 | ||||||
| 2025-05-12 | 13F | C2P Capital Advisory Group, LLC d.b.a. Prosperity Capital Advisors | 0 | -100.00 | 0 | -100.00 | ||||
| 2025-08-01 | 13F | Paradigm, Strategies in Wealth Management, LLC | 143,265 | -3.32 | 3,622 | -2.19 | ||||
| 2025-08-12 | 13F | Jpmorgan Chase & Co | 0 | -100.00 | 0 | |||||
| 2025-08-14 | 13F | Bank Of America Corp /de/ | 2,252,296 | 0.89 | 56,949 | 2.08 | ||||
| 2025-08-12 | 13F | Proequities, Inc. | 0 | 0 | ||||||
| 2025-07-29 | 13F | Mb, Levis & Associates, Llc | 503,035 | 2.42 | 12,719 | 3.63 | ||||
| 2025-08-13 | 13F | Cary Street Partners Financial Llc | 13,829 | 0.00 | 350 | 1.16 | ||||
| 2025-08-14 | 13F | 10Elms LLP | 6,850 | 705.88 | 173 | 723.81 | ||||
| 2025-07-15 | 13F | MCF Advisors LLC | 103,927 | 3.13 | 2,628 | 4.33 | ||||
| 2025-08-14 | 13F | Colony Group, LLC | 18,297 | 463 | ||||||
| 2025-07-22 | 13F | Penobscot Investment Management Company, Inc. | 12,000 | 3.45 | 303 | 4.84 | ||||
| 2025-08-14 | 13F | Raymond James Financial Inc | 283,880 | -58.33 | 7,178 | -57.84 | ||||
| 2025-08-14 | 13F | Stifel Financial Corp | 53,484 | -75.37 | 1,352 | -75.08 | ||||
| 2025-08-13 | 13F | Flow Traders U.s. Llc | 62,965 | 89.60 | 2 | |||||
| 2025-08-27 | NP | Mason Capital Fund Trust - Fundamentals First ETF | 1,992 | 0.00 | 50 | 2.04 | ||||
| 2025-07-10 | 13F | Wealth Enhancement Advisory Services, Llc | 39,199 | 3.83 | 986 | 4.45 | ||||
| 2025-07-02 | 13F | Michael S. Ryan, Inc. | 205,163 | 2.08 | 5,188 | 3.29 | ||||
| 2025-07-29 | 13F | Accretive Wealth Partners, LLC | 7,984 | 202 | ||||||
| 2025-08-07 | 13F | Rossmore Private Capital | 41,618 | 1,052 | ||||||
| 2025-07-30 | 13F | Princeton Global Asset Management LLC | 28,179 | -0.28 | 712 | 0.85 | ||||
| 2025-08-14 | 13F | Hancock Whitney Corp | 203,710 | 5,151 | ||||||
| 2025-07-11 | 13F | Adirondack Trust Co | 55,257 | 15.10 | 1,397 | 16.43 | ||||
| 2025-07-25 | 13F | We Are One Seven, LLC | 11,745 | 13.14 | 297 | 14.29 | ||||
| 2025-08-11 | 13F | Brown Brothers Harriman & Co | 7,599 | 192 | ||||||
| 2025-07-09 | 13F | Krilogy Financial LLC | 192,598 | 2.04 | 4,870 | 3.24 | ||||
| 2025-07-01 | 13F | Confluence Investment Management Llc | 401,503 | -1.46 | 10,152 | -0.28 | ||||
| 2025-08-25 | 13F/A | Neuberger Berman Group LLC | 126,635 | 0.48 | 3,202 | 1.65 | ||||
| 2025-08-01 | 13F | Rossby Financial, LCC | 496 | 13 | ||||||
| 2025-07-30 | 13F | Klingman & Associates, LLC | 514,089 | 30.66 | 12,999 | 32.20 | ||||
| 2025-08-01 | 13F | James Investment Research Inc | 14,068 | 0.00 | 356 | 1.14 | ||||
| 2025-07-21 | 13F | Cliftonlarsonallen Wealth Advisors, Llc | 37,009 | -2.64 | 936 | -1.48 | ||||
| 2025-07-09 | 13F | Sarver Vrooman Wealth Advisors | 7,288 | 594.10 | 184 | 607.69 | ||||
| 2025-07-23 | 13F | Fulton Breakefield Broenniman Llc | 61,099 | 264.29 | 1,545 | 268.50 | ||||
| 2025-07-23 | 13F | Arcataur Capital Management LLC | 73,685 | 16.10 | 1,863 | 17.54 | ||||
| 2025-07-29 | 13F | Lyell Wealth Management, Lp | 218,025 | 1.47 | 5,513 | 2.66 | ||||
| 2025-07-21 | 13F | Segment Wealth Management, LLC | 57,210 | 4.09 | 1,447 | 5.32 | ||||
| 2025-07-30 | 13F | Sonata Capital Group Inc | 12,000 | 0 | ||||||
| 2025-08-08 | 13F | Mv Capital Management, Inc. | 812,405 | -0.63 | 20,542 | 0.55 | ||||
| 2025-07-15 | 13F | Garrett Investment Advisors LLC | 26,620 | -76.49 | 673 | -76.21 | ||||
| 2025-07-30 | 13F | Probity Advisors, Inc. | 142,263 | 8.60 | 3,597 | 9.90 | ||||
| 2025-08-12 | 13F | O'shaughnessy Asset Management, Llc | 1 | 0 | ||||||
| 2025-08-06 | 13F | Stokes Family Office, LLC | 27,330 | 0.00 | 691 | 1.32 | ||||
| 2025-08-11 | 13F | HighTower Advisors, LLC | 445,324 | 4.72 | 11,260 | 5.96 | ||||
| 2025-07-17 | 13F/A | Capital Investment Advisors, LLC | 2,752,018 | 10.64 | 69,585 | 11.94 | ||||
| 2025-07-25 | 13F | Hemington Wealth Management | 2,590 | 0.00 | 0 | |||||
| 2025-07-29 | 13F | Koshinski Asset Management, Inc. | 8,040 | 203 | ||||||
| 2025-08-12 | 13F | Coldstream Capital Management Inc | 58,851 | 1.44 | 1,488 | 2.69 | ||||
| 2025-07-28 | 13F | Mutual Advisors, LLC | 19,541 | 0.36 | 493 | 1.65 | ||||
| 2025-08-05 | 13F | Bank Of Montreal /can/ | 0 | -100.00 | 0 | |||||
| 2025-08-14 | 13F/A | Rockefeller Capital Management L.P. | 504,136 | -2.26 | 12,747 | -1.10 | ||||
| 2025-08-15 | 13F | Kestra Advisory Services, LLC | 79,248 | 6.58 | 2,004 | 7.80 | ||||
| 2025-07-29 | 13F | Sigma Investment Counselors Inc | 1,316,078 | 3.23 | 33,277 | 4.45 | ||||
| 2025-08-07 | 13F | Addison Advisors LLC | 16,668 | 72.49 | 421 | 74.69 | ||||
| 2025-07-18 | 13F | Truist Financial Corp | 9,203 | 233 | ||||||
| 2025-07-09 | 13F | Beacon Financial Group | 30,280 | 19.43 | 766 | 20.85 | ||||
| 2025-04-22 | 13F | Mendota Financial Group, LLC | 0 | -100.00 | 0 | |||||
| 2025-08-11 | 13F | Dorsey & Whitney Trust CO LLC | 16,000 | 0.00 | 405 | 1.25 | ||||
| 2025-05-14 | 13F | Susquehanna International Group, Llp | 0 | -100.00 | 0 | |||||
| 2025-07-17 | 13F | Venture Visionary Partners LLC | 56,824 | -30.99 | 1,437 | -30.19 | ||||
| 2025-08-12 | 13F | J.w. Cole Advisors, Inc. | 36,041 | 911 | ||||||
| 2025-07-24 | 13F | Us Bancorp \de\ | 758,407 | 16.65 | 19,176 | 18.03 | ||||
| 2025-08-08 | 13F | Advisors Capital Management, LLC | 297,883 | 7,532 | ||||||
| 2025-08-14 | 13F | Integrated Wealth Concepts LLC | 20,903 | 24.93 | 529 | 26.32 | ||||
| 2025-07-17 | 13F | Janney Montgomery Scott LLC | 317,816 | 6.33 | 8 | 14.29 | ||||
| 2025-08-01 | 13F | Signature Wealth Management Group | 155,922 | 2.75 | 3,942 | 3.96 | ||||
| 2025-07-31 | 13F | United Community Bank | 1,570 | 96.25 | 40 | 105.26 | ||||
| 2025-08-12 | 13F | Jacobi Capital Management LLC | 18,233 | 6.79 | 461 | 8.22 | ||||
| 2025-07-09 | 13F | Lbmc Investment Advisors, Llc | 43,495 | 1,100 | ||||||
| 2025-07-08 | 13F | Little House Capital Llc | 45,234 | -0.14 | 1,144 | 0.97 |