Mga Batayang Estadistika
| Pemilik Institusional | 131 total, 131 long only, 0 short only, 0 long/short - change of 6.45% MRQ |
| Alokasi Portofolio Rata-rata | 0.2408 % - change of -11.68% MRQ |
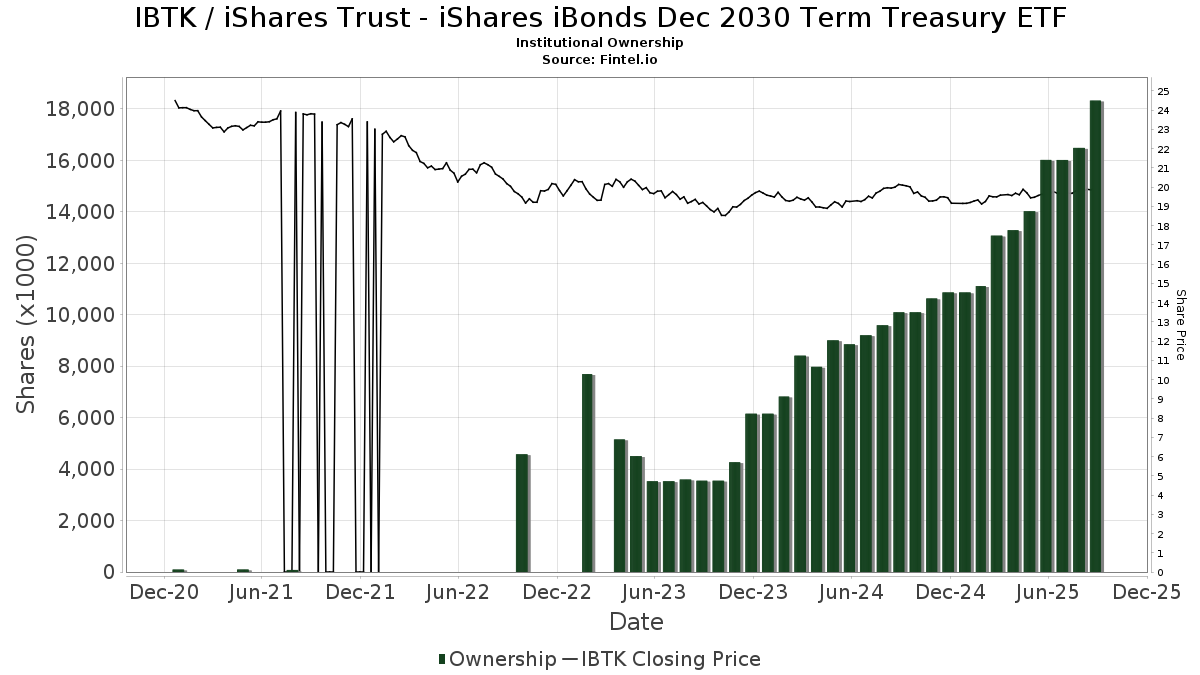
| Saham Institusional (Jangka Panjang) | 18,321,871 (ex 13D/G) - change of 2.31MM shares 14.40% MRQ |
| Nilai Institusional (Jangka Panjang) | $ 350,101 USD ($1000) |
Kepemilikan Institusional dan Pemegang Saham
iShares Trust - iShares iBonds Dec 2030 Term Treasury ETF (US:IBTK) memiliki 131 pemilik institusional dan pemegang saham yang telah mengajukan formulir 13D/G atau 13F kepada Komisi Bursa Efek (Securities Exchange Commission/SEC). Lembaga-lembaga ini memegang total 18,321,871 saham. Pemegang saham terbesar meliputi Wells Fargo & Company/mn, Bank Of America Corp /de/, Envestnet Asset Management Inc, Titleist Asset Management, Llc, D.a. Davidson & Co., Mercer Global Advisors Inc /adv, Royal Bank Of Canada, Waycross Investment Management Co, Legacy Private Trust Co., and Probity Advisors, Inc. .
Struktur kepemilikan institusional iShares Trust - iShares iBonds Dec 2030 Term Treasury ETF (NasdaqGM:IBTK) menunjukkan posisi terkini di perusahaan oleh institusi dan dana, serta perubahan terbaru dalam ukuran posisi. Pemegang saham utama dapat mencakup investor individu, reksa dana, dana lindung nilai, atau institusi. Jadwal 13D menunjukkan bahwa investor memegang (atau pernah memegang) lebih dari 5% saham perusahaan dan bermaksud (atau pernah bermaksud) untuk secara aktif mengejar perubahan strategi bisnis. Jadwal 13G menunjukkan investasi pasif lebih dari 5%.
The share price as of September 5, 2025 is 19.94 / share. Previously, on September 9, 2024, the share price was 20.08 / share. This represents a decline of 0.67% over that period.
Skor Sentimen Dana
Skor Sentimen Dana (sebelumnya dikenal sebagai Skor Akumulasi Kepemilikan) menemukan saham-saham yang paling banyak dibeli oleh dana. Ini adalah hasil dari model kuantitatif multi-faktor yang canggih yang mengidentifikasi perusahaan dengan tingkat akumulasi institusional tertinggi. Model penilaian menggunakan kombinasi dari total peningkatan pemilik yang diungkapkan, perubahan dalam alokasi portofolio pada pemilik tersebut, dan metrik lainnya. Angka berkisar dari 0 hingga 100, dengan angka yang lebih tinggi menunjukkan tingkat akumulasi yang lebih tinggi dibandingkan dengan perusahaan sejenisnya, dan 50 adalah rata-ratanya.
Frekuensi Pembaruan: Setiap Hari
Lihat Ownership Explorer, yang menyediakan daftar perusahaan dengan peringkat tertinggi.
Rasio Put/Call Institusional
Selain melaporkan isu ekuitas dan utang standar, institusi dengan aset di bawah manajemen lebih dari 100 juta dolar AS juga harus mengungkapkan kepemilikan opsi put dan call mereka. Karena opsi put umumnya menunjukkan sentimen negatif, dan opsi call menunjukkan sentimen positif, kita dapat mengetahui sentimen institusional secara keseluruhan dengan memplot rasio put terhadap call. Grafik di sebelah kanan memplot rasio put/call historis untuk instrumen ini.
Menggunakan Rasio Put/Call sebagai indikator sentimen investor mengatasi salah satu kekurangan utama dari penggunaan total kepemilikan institusional, yaitu sejumlah besar aset yang dikelola diinvestasikan secara pasif untuk melacak indeks. Dana yang dikelola secara pasif biasanya tidak membeli opsi, sehingga indikator rasio put/call lebih akurat dalam melacak sentimen dana yang dikelola secara aktif.
Pengajuan 13F dan NPORT
Detail pada pengajuan 13F tersedia gratis. Detail pada pengajuan NP memerlukan keanggotaan premium. Baris berwarna hijau menunjukkan posisi baru. Baris berwarna merah menunjukkan posisi yang sudah ditutup. Klik tautan ini ikon untuk melihat riwayat transaksi selengkapnya.
Tingkatkan
untuk membuka data premium dan mengekspor ke Excel ![]() .
.
| Tanggal File | Sumber | Investor | Ketik | Presyo ng Avg (Silangan) |
Saham | Δ Saham (%) |
Dilaporkan Nilai ($1000) |
Nilai Δ (%) |
Alokasi Port (%) |
|
|---|---|---|---|---|---|---|---|---|---|---|
| 2025-08-12 | 13F | Reliant Wealth Planning | 17,629 | 44.98 | 350 | 46.03 | ||||
| 2025-04-22 | 13F | Mendota Financial Group, LLC | 0 | -100.00 | 0 | |||||
| 2025-07-16 | 13F | Old Port Advisors | 40,959 | 813 | ||||||
| 2025-08-14 | 13F | Susquehanna International Group, Llp | 0 | -100.00 | 0 | |||||
| 2025-07-08 | 13F | FF Advisors,LLC | 81,087 | 4.12 | 1,609 | 4.82 | ||||
| 2025-08-07 | 13F | Allworth Financial LP | 57,294 | 5,341.03 | 1,137 | 5,580.00 | ||||
| 2025-07-14 | 13F | UMA Financial Services, Inc. | 7,935 | 0.00 | 157 | 0.64 | ||||
| 2025-07-24 | 13F/A | TFR Capital, LLC. | 10,162 | -12.48 | 202 | -11.84 | ||||
| 2025-07-08 | 13F | Apella Capital, LLC | 20,845 | 0.11 | 409 | 0.49 | ||||
| 2025-07-30 | 13F | Granite Harbor Advisors, Inc. | 18,721 | 0.00 | 371 | 0.82 | ||||
| 2025-08-06 | 13F | Commonwealth Equity Services, Llc | 133,536 | 1.01 | 3 | 0.00 | ||||
| 2025-08-14 | 13F | Jane Street Group, Llc | 86,295 | 200.15 | 1,712 | 203.01 | ||||
| 2025-08-11 | 13F | United Capital Financial Advisers, Llc | 141,633 | 98.76 | 2,810 | 100.64 | ||||
| 2025-05-12 | 13F | Fmr Llc | 0 | -100.00 | 0 | |||||
| 2025-07-28 | 13F | Harbour Investments, Inc. | 12,940 | 564.61 | 257 | 573.68 | ||||
| 2025-07-08 | 13F | Parallel Advisors, LLC | 139,395 | 12.02 | 2,766 | 13.04 | ||||
| 2025-07-11 | 13F | Compass Ion Advisors, LLC | 26,997 | 0.00 | 536 | 0.94 | ||||
| 2025-08-13 | 13F | Flow Traders U.s. Llc | 0 | -100.00 | 0 | |||||
| 2025-08-01 | 13F | Logan Capital Management Inc | 330 | 7 | ||||||
| 2025-07-17 | 13F | Stockman Wealth Management, Inc. | 208,753 | 6.86 | 4,142 | 7.84 | ||||
| 2025-09-04 | 13F/A | Advisor Group Holdings, Inc. | 21,130 | -50.76 | 419 | -50.30 | ||||
| 2025-08-15 | 13F | Howland Capital Management Llc | 125,243 | 0.44 | 2,485 | 1.35 | ||||
| 2025-08-15 | 13F | Captrust Financial Advisors | 30,499 | 20.11 | 605 | 21.24 | ||||
| 2025-07-15 | 13F | BCS Wealth Management | 0 | -100.00 | 0 | |||||
| 2025-05-07 | 13F | Spectrum Wealth Counsel, LLC | 2,542 | 0.00 | 50 | 2.08 | ||||
| 2025-08-11 | 13F | Principal Securities, Inc. | 1,095 | 0.00 | 22 | 0.00 | ||||
| 2025-08-14 | 13F | Eight 31 Financial Llc | 81,485 | -25.32 | 1,617 | -24.66 | ||||
| 2025-08-14 | 13F | Smartleaf Asset Management LLC | 84,418 | -1.60 | 1,671 | -0.83 | ||||
| 2025-08-12 | 13F | Jpmorgan Chase & Co | 0 | -100.00 | 0 | |||||
| 2025-08-15 | 13F | Kestra Advisory Services, LLC | 74,067 | 17.82 | 1,469 | 18.95 | ||||
| 2025-08-11 | 13F | Guidance Point Advisors, LLC | 15,391 | 5.79 | 305 | 6.64 | ||||
| 2025-07-23 | 13F | Country Club Bank /gfn | 101,284 | -5.89 | 2,004 | -5.11 | ||||
| 2025-07-23 | 13F | Waycross Investment Management Co | 543,723 | 0.18 | 10,787 | 1.10 | ||||
| 2025-08-01 | 13F | Bank of Jackson Hole Trust | 3,745 | 0.00 | 74 | 1.37 | ||||
| 2025-08-14 | 13F | Financial Engines Advisors L.L.C. | 58,608 | 0.44 | 1,163 | 1.39 | ||||
| 2025-08-01 | 13F | Liberty Wealth Management Llc | 14,017 | 278 | ||||||
| 2025-07-08 | 13F | Lowe Wealth Advisors, LLC | 4,937 | -19.50 | 98 | -19.17 | ||||
| 2025-08-04 | 13F | Creative Financial Designs Inc /adv | 196 | 0.00 | 4 | 0.00 | ||||
| 2025-08-11 | 13F | Atlantic Private Wealth, LLC | 39,594 | -54.01 | 786 | -53.61 | ||||
| 2025-07-14 | 13F | U.S. Capital Wealth Advisors, LLC | 45,454 | 5.53 | 902 | 6.50 | ||||
| 2025-07-30 | 13F | Journey Advisory Group, LLC | 165,083 | 186.62 | 3,275 | 189.31 | ||||
| 2025-07-30 | 13F | Bogart Wealth, LLC | 3,560 | 0.00 | 71 | 1.45 | ||||
| 2025-08-12 | 13F | Proequities, Inc. | 0 | 0 | ||||||
| 2025-07-07 | 13F | Trust Co | 409,469 | -0.21 | 8,124 | 0.71 | ||||
| 2025-08-14 | 13F | Comerica Bank | 8,216 | -24.38 | 163 | -23.47 | ||||
| 2025-08-14 | 13F | Hilltop Holdings Inc. | 11,706 | 232 | ||||||
| 2025-08-14 | 13F | UBS Group AG | 280,525 | 0.19 | 5,566 | 1.11 | ||||
| 2025-07-23 | 13F | Valmark Advisers, Inc. | 51,049 | 15.80 | 1,013 | 16.86 | ||||
| 2025-08-12 | 13F | Waterloo Capital, L.P. | 11,900 | 0.00 | 236 | 1.29 | ||||
| 2025-07-08 | 13F | Legacy Private Trust Co. | 514,453 | 0.49 | 10,207 | 1.40 | ||||
| 2025-07-29 | 13F | Accretive Wealth Partners, LLC | 163,473 | 4.81 | 3,243 | 5.74 | ||||
| 2025-08-14 | 13F | Ameriprise Financial Inc | 116,555 | 4.46 | 2,312 | 5.43 | ||||
| 2025-08-13 | 13F | Hamel Associates, Inc. | 12,044 | 239 | ||||||
| 2025-07-30 | 13F | Strategic Blueprint, LLC | 38,443 | 763 | ||||||
| 2025-07-11 | 13F | First PREMIER Bank | 849 | -5.88 | 0 | |||||
| 2025-07-08 | 13F | Nbc Securities, Inc. | 41,632 | -3.81 | 1 | |||||
| 2025-08-13 | 13F | Holos Integrated Wealth LLC | 2,078 | 0.00 | 41 | 2.50 | ||||
| 2025-08-12 | 13F | Passive Capital Management, LLC. | 15,941 | 0.00 | 314 | 0.32 | ||||
| 2025-07-25 | 13F | Cwm, Llc | 17,570 | 28.84 | 0 | |||||
| 2025-07-14 | 13F | Mechanics Bank Trust Department | 94,500 | 5.29 | 1,875 | 6.24 | ||||
| 2025-07-24 | 13F | Leo Wealth, LLC | 25,096 | 1.76 | 498 | 2.69 | ||||
| 2025-08-12 | 13F | BlackRock, Inc. | 214,153 | 4,249 | ||||||
| 2025-08-07 | 13F | CENTRAL TRUST Co | 255,197 | 8.93 | 5,063 | 9.95 | ||||
| 2025-08-14 | 13F | Citadel Advisors Llc | 30,726 | -52.34 | 610 | -51.93 | ||||
| 2025-08-14 | 13F | Mml Investors Services, Llc | 24,934 | 137.15 | 0 | |||||
| 2025-08-05 | 13F | Cherry Tree Wealth Management, LLC | 4,963 | 14.12 | 98 | 15.29 | ||||
| 2025-08-14 | 13F | STAR Financial Bank | 106,985 | 10.92 | 2,123 | 11.92 | ||||
| 2025-08-18 | 13F/A | National Bank Of Canada /fi/ | 735 | 15 | ||||||
| 2025-07-09 | 13F | Krilogy Financial LLC | 372,535 | -0.08 | 7,391 | 0.83 | ||||
| 2025-07-14 | 13F | Park Avenue Securities Llc | 82,109 | 2 | ||||||
| 2025-08-15 | 13F | Morgan Stanley | 114,256 | 123.27 | 2,267 | 125.25 | ||||
| 2025-07-22 | 13F | Yoder Wealth Management, Inc. | 40,302 | 3.20 | 800 | 4.17 | ||||
| 2025-04-21 | 13F | Community Bank, N.A. | 0 | -100.00 | 0 | |||||
| 2025-07-24 | 13F | IFP Advisors, Inc | 125,270 | -3.11 | 2,485 | -2.20 | ||||
| 2025-08-01 | 13F | Envestnet Asset Management Inc | 1,152,213 | 83.76 | 22,860 | 85.44 | ||||
| 2025-08-07 | 13F | PFG Advisors | 47,524 | 943 | ||||||
| 2025-08-14 | 13F | Royal Bank Of Canada | 583,163 | 79.32 | 11,571 | 80.97 | ||||
| 2025-08-13 | 13F | Capital Analysts, Inc. | 2,354 | 0.00 | 0 | |||||
| 2025-05-06 | 13F | Venturi Wealth Management, LLC | 0 | -100.00 | 0 | |||||
| 2025-08-14 | 13F | GWM Advisors LLC | 7,352 | -83.09 | 146 | -83.02 | ||||
| 2025-08-18 | 13F/A | Kestra Investment Management, LLC | 17,745 | -49.58 | 352 | -49.06 | ||||
| 2025-07-29 | 13F | Mb, Levis & Associates, Llc | 848 | 0.95 | 17 | 0.00 | ||||
| 2025-04-29 | 13F | Element Wealth, LLC | 0 | -100.00 | 0 | |||||
| 2025-08-14 | 13F | Mercer Global Advisors Inc /adv | 639,493 | 886.29 | 12,688 | 895.84 | ||||
| 2025-08-14 | 13F | Integrated Wealth Concepts LLC | 62,996 | 0.24 | 1,250 | 1.13 | ||||
| 2025-08-13 | 13F | Cary Street Partners Financial Llc | 36,551 | 0.00 | 725 | 0.97 | ||||
| 2025-07-17 | 13F/A | Capital Investment Advisors, LLC | 14,720 | 25.03 | 292 | 26.41 | ||||
| 2025-08-14 | 13F | Stifel Financial Corp | 60,955 | 56.90 | 1,209 | 58.45 | ||||
| 2025-07-31 | 13F | Keeler THomas Management LLC | 79,894 | 28.12 | 1,585 | 29.39 | ||||
| 2025-08-07 | 13F | Parkside Financial Bank & Trust | 524 | 0.96 | 10 | 0.00 | ||||
| 2025-08-12 | 13F | Titleist Asset Management, Llc | 1,029,829 | 139.22 | 20,432 | 141.42 | ||||
| 2025-07-21 | 13F | Barrett & Company, Inc. | 4,163 | 125.03 | 83 | 127.78 | ||||
| 2025-08-11 | 13F | Private Advisor Group, LLC | 84,418 | -1.60 | 1,675 | -0.71 | ||||
| 2025-08-08 | 13F | Pnc Financial Services Group, Inc. | 71 | 0.00 | 1 | 0.00 | ||||
| 2025-07-16 | 13F | Rebalance, Llc | 11,274 | 224 | ||||||
| 2025-07-23 | 13F | Evexia Wealth Llc | 71,419 | 58.71 | 1,404 | 59.43 | ||||
| 2025-08-14 | 13F | Bank Of America Corp /de/ | 1,379,043 | 15.69 | 27,360 | 16.75 | ||||
| 2025-07-10 | 13F | Wealth Enhancement Advisory Services, Llc | 185,263 | 5.95 | 3,640 | 5.91 | ||||
| 2025-08-14 | 13F | AllSquare Wealth Management LLC | 22,266 | 0.69 | 442 | 1.61 | ||||
| 2025-07-17 | 13F | Chatham Capital Group, Inc. | 95,395 | 18.30 | 1,893 | 19.37 | ||||
| 2025-08-12 | 13F | Richmond Investment Services, LLC | 39,152 | 97.76 | 777 | 99.49 | ||||
| 2025-08-13 | 13F | Cerity Partners LLC | 23,884 | -0.37 | 474 | 0.42 | ||||
| 2025-08-08 | 13F | TD Capital Management LLC | 2,220 | 1.00 | 44 | 2.33 | ||||
| 2025-08-13 | 13F | Boston Family Office Llc | 99,546 | 24.46 | 2 | 0.00 | ||||
| 2025-08-14 | 13F | Goldman Sachs Group Inc | 0 | -100.00 | 0 | |||||
| 2025-08-19 | 13F | Asset Dedication, LLC | 3,384 | 13.63 | 67 | 15.52 | ||||
| 2025-07-21 | 13F | Crews Bank & Trust | 1,200 | 0.00 | 24 | 0.00 | ||||
| 2025-08-14 | 13F | Wells Fargo & Company/mn | 2,689,736 | 2.50 | 53,364 | 3.44 | ||||
| 2025-07-31 | 13F | Leavell Investment Management, Inc. | 13,725 | 272 | ||||||
| 2025-08-12 | 13F | Steward Partners Investment Advisory, Llc | 1,470 | 55.72 | 29 | 61.11 | ||||
| 2025-07-24 | 13F | Ronald Blue Trust, Inc. | 408 | 0.00 | 8 | 0.00 | ||||
| 2025-08-05 | 13F | Fullcircle Wealth Llc | 13,813 | 0.00 | 274 | 0.00 | ||||
| 2025-08-14 | 13F | Snowden Capital Advisors LLC | 427,386 | -0.25 | 8,479 | 0.66 | ||||
| 2025-05-02 | 13F | Whittier Trust Co | 0 | -100.00 | 0 | |||||
| 2025-08-12 | 13F | Associated Banc-corp | 50,546 | 15.98 | 1,003 | 17.06 | ||||
| 2025-07-01 | 13F | Confluence Investment Management Llc | 393,507 | -0.49 | 7,807 | 0.42 | ||||
| 2025-07-11 | 13F | Prosperity Planning, Inc. | 308 | 5.14 | ||||||
| 2025-05-12 | 13F | C2P Capital Advisory Group, LLC d.b.a. Prosperity Capital Advisors | 0 | -100.00 | 0 | -100.00 | ||||
| 2025-04-14 | 13F | Farther Finance Advisors, LLC | 0 | -100.00 | 0 | |||||
| 2025-07-08 | 13F | Atwood & Palmer Inc | 99,110 | -91.22 | 1,966 | -91.14 | ||||
| 2025-08-01 | 13F | James Investment Research Inc | 14,350 | 0.00 | 285 | 0.71 | ||||
| 2025-08-12 | 13F | LPL Financial LLC | 203,772 | -16.83 | 4,043 | -16.07 | ||||
| 2025-08-06 | 13F | AE Wealth Management LLC | 8 | 0 | ||||||
| 2025-08-08 | 13F | Cetera Investment Advisers | 253,494 | 4.51 | 5,029 | 5.47 | ||||
| 2025-07-30 | 13F | D.a. Davidson & Co. | 745,879 | 146.59 | 14,798 | 148.87 | ||||
| 2025-08-08 | 13F | Mv Capital Management, Inc. | 43,300 | 13.42 | 859 | 14.53 | ||||
| 2025-07-30 | 13F | Probity Advisors, Inc. | 435,300 | 4.57 | 8,636 | 5.54 | ||||
| 2025-07-21 | 13F | Cliftonlarsonallen Wealth Advisors, Llc | 82,180 | 111.74 | 1,630 | 113.63 | ||||
| 2025-08-08 | 13F | Thoroughbred Financial Services, Llc | 121,018 | -8.59 | 2 | 0.00 | ||||
| 2025-05-12 | 13F | Kohmann Bosshard Financial Services, LLC | 0 | -100.00 | 0 | |||||
| 2025-08-12 | 13F | Jaffetilchin Investment Partners, LLC | 13,369 | 0.98 | 265 | 1.92 | ||||
| 2025-08-08 | 13F | WASHINGTON TRUST Co | 0 | -100.00 | 0 | |||||
| 2025-08-12 | 13F | Coldstream Capital Management Inc | 14,739 | 0.00 | 292 | 1.04 | ||||
| 2025-07-17 | 13F | Janney Montgomery Scott LLC | 134,320 | 0.54 | 3 | 0.00 | ||||
| 2025-08-15 | 13F | Equitable Holdings, Inc. | 19,878 | 1.04 | 394 | 2.07 | ||||
| 2025-08-11 | 13F | HighTower Advisors, LLC | 145,363 | 1.79 | 2,884 | 2.74 | ||||
| 2025-07-16 | 13F | Signaturefd, Llc | 39,619 | 106.01 | 786 | 107.94 | ||||
| 2025-07-21 | 13F | Exchange Capital Management, Inc. | 16,239 | 2.26 | 322 | 3.21 | ||||
| 2025-07-24 | 13F | Us Bancorp \de\ | 3,360 | 61.54 | 67 | 65.00 | ||||
| 2025-08-14 | 13F | Raymond James Financial Inc | 402,086 | -19.20 | 7,977 | -18.46 | ||||
| 2025-08-14 | 13F | Colony Group, LLC | 32,307 | 10.15 | 641 | 11.11 | ||||
| 2025-08-12 | 13F | Jacobi Capital Management LLC | 19,219 | 6.30 | 381 | 7.32 | ||||
| 2025-07-31 | 13F | United Community Bank | 13,060 | 0.00 | 259 | 1.17 | ||||
| 2025-07-11 | 13F | Shelton Wealth Management, Llc | 385,684 | 4.88 | 7,652 | 5.84 | ||||
| 2025-07-30 | 13F | DecisionMap Wealth Management, LLC | 17,228 | 21.38 | 342 | 22.22 | ||||
| 2025-07-15 | 13F | Garrett Investment Advisors LLC | 13,602 | 0.56 | 270 | 1.51 | ||||
| 2025-07-31 | 13F | Cambridge Investment Research Advisors, Inc. | 11,958 | -28.67 | 0 | |||||
| 2025-08-13 | 13F | Northwestern Mutual Wealth Management Co | 83,733 | 11.59 | 1,661 | 12.61 |