Mga Batayang Estadistika
| Pemilik Institusional | 154 total, 154 long only, 0 short only, 0 long/short - change of 9.22% MRQ |
| Alokasi Portofolio Rata-rata | 0.1462 % - change of -5.97% MRQ |
| Saham Institusional (Jangka Panjang) | 3,301,511 (ex 13D/G) - change of 0.06MM shares 1.72% MRQ |
| Nilai Institusional (Jangka Panjang) | $ 360,063 USD ($1000) |
Kepemilikan Institusional dan Pemegang Saham
Vanguard Admiral Funds - Vanguard S&P Mid-Cap 400 Growth ETF (US:IVOG) memiliki 154 pemilik institusional dan pemegang saham yang telah mengajukan formulir 13D/G atau 13F kepada Komisi Bursa Efek (Securities Exchange Commission/SEC). Lembaga-lembaga ini memegang total 3,301,511 saham. Pemegang saham terbesar meliputi Mariner, LLC, Raymond James Financial Inc, LPL Financial LLC, Morgan Stanley, Octavia Wealth Advisors, LLC, Stordahl Capital Management, Inc., Moneta Group Investment Advisors Llc, LJI Wealth Management, LLC, UBS Group AG, and Ameriprise Financial Inc .
Struktur kepemilikan institusional Vanguard Admiral Funds - Vanguard S&P Mid-Cap 400 Growth ETF (ARCA:IVOG) menunjukkan posisi terkini di perusahaan oleh institusi dan dana, serta perubahan terbaru dalam ukuran posisi. Pemegang saham utama dapat mencakup investor individu, reksa dana, dana lindung nilai, atau institusi. Jadwal 13D menunjukkan bahwa investor memegang (atau pernah memegang) lebih dari 5% saham perusahaan dan bermaksud (atau pernah bermaksud) untuk secara aktif mengejar perubahan strategi bisnis. Jadwal 13G menunjukkan investasi pasif lebih dari 5%.
The share price as of September 5, 2025 is 120.23 / share. Previously, on September 9, 2024, the share price was 107.96 / share. This represents an increase of 11.37% over that period.

Skor Sentimen Dana
Skor Sentimen Dana (sebelumnya dikenal sebagai Skor Akumulasi Kepemilikan) menemukan saham-saham yang paling banyak dibeli oleh dana. Ini adalah hasil dari model kuantitatif multi-faktor yang canggih yang mengidentifikasi perusahaan dengan tingkat akumulasi institusional tertinggi. Model penilaian menggunakan kombinasi dari total peningkatan pemilik yang diungkapkan, perubahan dalam alokasi portofolio pada pemilik tersebut, dan metrik lainnya. Angka berkisar dari 0 hingga 100, dengan angka yang lebih tinggi menunjukkan tingkat akumulasi yang lebih tinggi dibandingkan dengan perusahaan sejenisnya, dan 50 adalah rata-ratanya.
Frekuensi Pembaruan: Setiap Hari
Lihat Ownership Explorer, yang menyediakan daftar perusahaan dengan peringkat tertinggi.
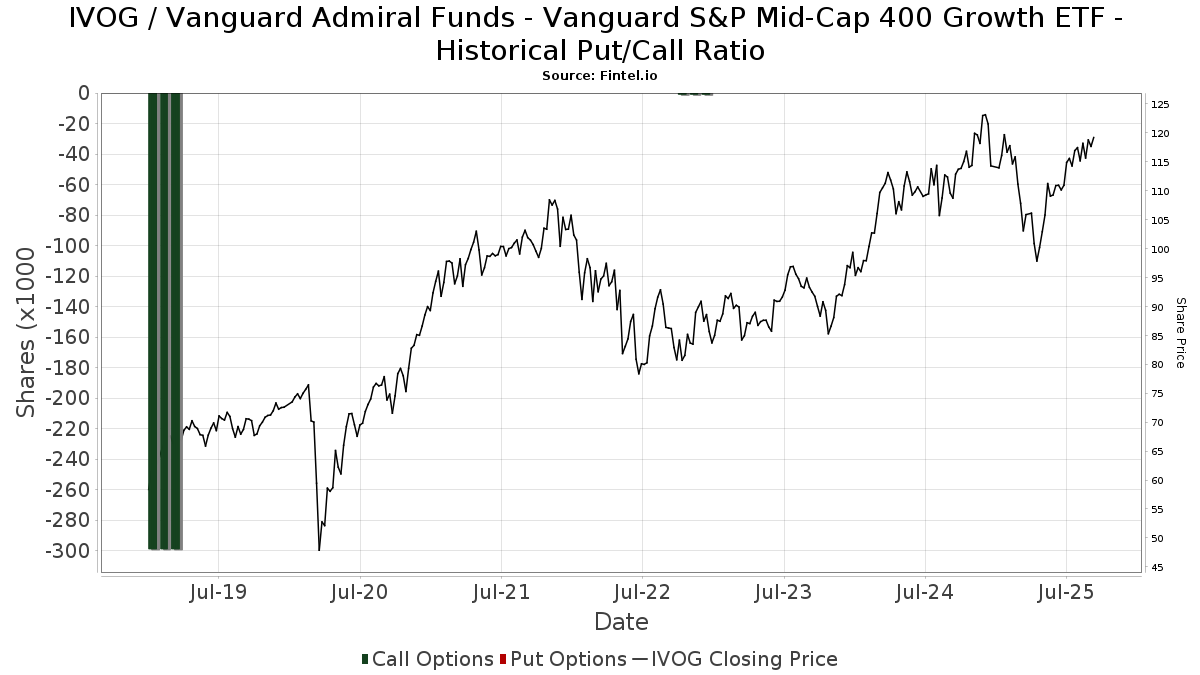
Rasio Put/Call Institusional
Selain melaporkan isu ekuitas dan utang standar, institusi dengan aset di bawah manajemen lebih dari 100 juta dolar AS juga harus mengungkapkan kepemilikan opsi put dan call mereka. Karena opsi put umumnya menunjukkan sentimen negatif, dan opsi call menunjukkan sentimen positif, kita dapat mengetahui sentimen institusional secara keseluruhan dengan memplot rasio put terhadap call. Grafik di sebelah kanan memplot rasio put/call historis untuk instrumen ini.
Menggunakan Rasio Put/Call sebagai indikator sentimen investor mengatasi salah satu kekurangan utama dari penggunaan total kepemilikan institusional, yaitu sejumlah besar aset yang dikelola diinvestasikan secara pasif untuk melacak indeks. Dana yang dikelola secara pasif biasanya tidak membeli opsi, sehingga indikator rasio put/call lebih akurat dalam melacak sentimen dana yang dikelola secara aktif.
Pengajuan 13F dan NPORT
Detail pada pengajuan 13F tersedia gratis. Detail pada pengajuan NP memerlukan keanggotaan premium. Baris berwarna hijau menunjukkan posisi baru. Baris berwarna merah menunjukkan posisi yang sudah ditutup. Klik tautan ini ikon untuk melihat riwayat transaksi selengkapnya.
Tingkatkan
untuk membuka data premium dan mengekspor ke Excel ![]() .
.
| Tanggal File | Sumber | Investor | Ketik | Presyo ng Avg (Silangan) |
Saham | Δ Saham (%) |
Dilaporkan Nilai ($1000) |
Nilai Δ (%) |
Alokasi Port (%) |
|
|---|---|---|---|---|---|---|---|---|---|---|
| 2025-07-28 | 13F | Harbour Investments, Inc. | 39,915 | 10.75 | 4,512 | 21.33 | ||||
| 2025-08-11 | 13F | Aptus Capital Advisors, LLC | 3,215 | 6.56 | 363 | 16.72 | ||||
| 2025-08-06 | 13F | AE Wealth Management LLC | 2,380 | 0.38 | 269 | 10.25 | ||||
| 2025-08-06 | 13F | Adviser Investments LLC | 35,545 | -14.48 | 4,018 | -6.32 | ||||
| 2025-08-15 | 13F | CI Private Wealth, LLC | 3,230 | 365 | ||||||
| 2025-08-05 | 13F | Sunburst Financial Group, LLC | 2,129 | 241 | ||||||
| 2025-07-29 | 13F | Private Trust Co Na | 507 | 0.00 | 57 | 9.62 | ||||
| 2025-08-06 | 13F | Round Rock Advisors, LLC | 6,476 | 0.00 | 732 | 9.43 | ||||
| 2025-08-19 | 13F | Cape Investment Advisory, Inc. | 178 | 0.00 | 20 | 11.11 | ||||
| 2025-07-28 | 13F | IFG Advisors, LLC | 2,508 | 0.00 | 283 | 9.69 | ||||
| 2025-08-11 | 13F | Ritter Daniher Financial Advisory LLC / DE | 300 | -12.54 | 34 | -5.71 | ||||
| 2025-07-18 | 13F | SOA Wealth Advisors, LLC. | 344 | 0.00 | 39 | 8.57 | ||||
| 2025-07-30 | 13F | Whittier Trust Co | 150 | 0.00 | 17 | 6.67 | ||||
| 2025-08-08 | 13F | Cetera Investment Advisers | 71,953 | 11.08 | 8,133 | 21.68 | ||||
| 2025-08-11 | 13F | Goodman Financial Corp | 14,278 | 1,614 | ||||||
| 2025-08-12 | 13F | MAI Capital Management | 1,209 | -4.58 | 137 | 4.62 | ||||
| 2025-08-01 | 13F | American Financial & Tax Strategies Inc | 4,491 | 0.00 | 508 | 9.50 | ||||
| 2025-08-29 | 13F | Centaurus Financial, Inc. | 9,793 | -2.26 | 1 | 0.00 | ||||
| 2025-08-11 | 13F | Mosaic Family Wealth Partners, Llc | 2,220 | 0.00 | 251 | 9.17 | ||||
| 2025-04-28 | 13F | FSR Wealth Management Ltd. | 0 | -100.00 | 0 | |||||
| 2025-08-13 | 13F | Valued Retirements, Inc. | 2,402 | 0.00 | 271 | 9.72 | ||||
| 2025-08-13 | 13F | Jones Financial Companies Lllp | 2,628 | 130.53 | 297 | 152.99 | ||||
| 2025-05-15 | 13F | GWM Advisors LLC | 0 | -100.00 | 0 | |||||
| 2025-07-22 | 13F | Miracle Mile Advisors, LLC | 56,365 | -0.04 | 6,371 | 9.51 | ||||
| 2025-08-08 | 13F | Avantax Advisory Services, Inc. | 4,358 | 54.10 | 493 | 69.07 | ||||
| 2025-08-13 | 13F | Baird Financial Group, Inc. | 68,433 | 0.55 | 7,735 | 10.16 | ||||
| 2025-08-14 | 13F | Financial Network Wealth Advisors LLC | 61 | 7 | ||||||
| 2025-07-28 | 13F | Sagace Wealth Management LLC | 0 | -100.00 | 0 | |||||
| 2025-08-08 | 13F | Meridian Wealth Management, LLC | 4,450 | 0.16 | 503 | 9.61 | ||||
| 2025-07-07 | 13F | Nova Wealth Management, Inc. | 7,462 | -17.97 | 843 | -10.13 | ||||
| 2025-07-31 | 13F | LJI Wealth Management, LLC | 113,975 | 11.80 | 12,883 | 22.48 | ||||
| 2025-08-14 | 13F | Goldman Sachs Group Inc | 6,627 | -28.57 | 749 | -21.73 | ||||
| 2025-08-08 | 13F | Pnc Financial Services Group, Inc. | 2,873 | 0.00 | 325 | 9.46 | ||||
| 2025-08-14 | 13F | Hrt Financial Lp | 2,344 | 0 | ||||||
| 2025-07-31 | 13F | Brinker Capital Investments, LLC | 0 | -100.00 | 0 | -100.00 | ||||
| 2025-07-16 | 13F | Perigon Wealth Management, LLC | 1,907 | 216 | ||||||
| 2025-09-04 | 13F/A | Advisor Group Holdings, Inc. | 8,661 | -2.89 | 978 | 6.20 | ||||
| 2025-08-14 | 13F | UBS Group AG | 93,046 | 7.74 | 10,517 | 18.04 | ||||
| 2025-08-13 | 13F | Cary Street Partners Financial Llc | 15,681 | -73.17 | 1,772 | -70.61 | ||||
| 2025-08-14 | 13F | Colony Group, LLC | 1,807 | 204 | ||||||
| 2025-07-16 | 13F | Embree Financial Group | 6,659 | 0.00 | 753 | 9.62 | ||||
| 2025-07-24 | 13F | Conning Inc. | 2,726 | 308 | ||||||
| 2025-07-31 | 13F | City State Bank | 100 | 0.00 | 11 | 10.00 | ||||
| 2025-07-25 | 13F | Cwm, Llc | 6 | 0 | ||||||
| 2025-04-07 | 13F | GoalVest Advisory LLC | 0 | -100.00 | 0 | |||||
| 2025-08-04 | 13F | Quaker Wealth Management, LLC | 277 | 31 | ||||||
| 2025-07-24 | 13F | Bernard Wealth Management Corp. | 56 | 0.00 | 6 | 20.00 | ||||
| 2025-08-12 | 13F | O'shaughnessy Asset Management, Llc | 424 | -9.21 | 48 | -2.08 | ||||
| 2025-07-14 | 13F | AdvisorNet Financial, Inc | 8 | 0.00 | 1 | |||||
| 2025-07-21 | 13F | Ameritas Advisory Services, LLC | 270 | 31 | ||||||
| 2025-07-15 | 13F | North Star Investment Management Corp. | 102 | 0.00 | 12 | 10.00 | ||||
| 2025-08-05 | 13F | Key FInancial Inc | 356 | 0.00 | 40 | 11.11 | ||||
| 2025-08-13 | 13F | ESG Planning | 17,600 | 1,989 | ||||||
| 2025-08-11 | 13F | Citigroup Inc | 954 | -98.43 | 108 | -98.29 | ||||
| 2025-08-15 | 13F | Kestra Advisory Services, LLC | 64,516 | 4.11 | 7,292 | 14.06 | ||||
| 2025-07-24 | 13F | Financial Security Advisor, Inc. | 4,190 | 0.00 | 474 | 9.49 | ||||
| 2025-08-14 | 13F | Mariner, LLC | 691,859 | 0.07 | 78,201 | 9.63 | ||||
| 2025-04-23 | 13F | Creative Financial Designs Inc /adv | 0 | 0 | ||||||
| 2025-08-04 | 13F | Spire Wealth Management | 439 | 48.31 | 50 | 63.33 | ||||
| 2025-07-02 | 13F | Central Pacific Bank - Trust Division | 6 | 0.00 | 1 | |||||
| 2025-07-18 | 13F | Founders Capital Management | 673 | 0.00 | 76 | 10.14 | ||||
| 2025-08-12 | 13F | CIBC Private Wealth Group, LLC | 5,718 | 0.00 | 646 | 23.52 | ||||
| 2025-07-08 | 13F/A | Salem Investment Counselors Inc | 10 | -71.43 | 1 | -66.67 | ||||
| 2025-08-12 | 13F | Bokf, Na | 103 | 12 | ||||||
| 2025-04-17 | 13F | Breakwater Investment Management | 0 | -100.00 | 0 | |||||
| 2025-08-07 | 13F | Montag A & Associates Inc | 12,790 | -0.66 | 1,446 | 8.81 | ||||
| 2025-08-14 | 13F | Mendel Capital Management LLC | 20,113 | -3.76 | 2,273 | 5.48 | ||||
| 2025-07-24 | 13F | Us Bancorp \de\ | 305 | 0.00 | 34 | 9.68 | ||||
| 2025-08-12 | 13F | Clark Financial Services Group Inc /bd | 37,144 | 0.54 | 4,198 | 10.15 | ||||
| 2025-08-14 | 13F | Two Sigma Securities, Llc | 0 | -100.00 | 0 | |||||
| 2025-08-08 | 13F | SBI Securities Co., Ltd. | 19 | 0.00 | 2 | 100.00 | ||||
| 2025-08-12 | 13F | Jpmorgan Chase & Co | 36,695 | -0.19 | 4,148 | 9.33 | ||||
| 2025-05-05 | 13F | Eagle Bay Advisors LLC | 0 | -100.00 | 0 | |||||
| 2025-08-06 | 13F | Savant Capital, LLC | 25,224 | -2.01 | 2,851 | 7.38 | ||||
| 2025-08-14 | 13F | Raymond James Financial Inc | 194,729 | -0.55 | 22,010 | 8.96 | ||||
| 2025-08-14 | 13F | Warren Averett Asset Management, LLC | 3,519 | 5.90 | 398 | 16.08 | ||||
| 2025-07-08 | 13F | Parallel Advisors, LLC | 1,000 | 113 | ||||||
| 2025-07-17 | 13F | Heritage Investment Group, Inc. | 8,502 | 0.00 | 961 | 9.58 | ||||
| 2025-08-14 | 13F | Bank Of America Corp /de/ | 69,874 | -1.79 | 7,898 | 7.59 | ||||
| 2025-08-06 | 13F | Rialto Wealth Management, LLC | 3,194 | -16.78 | 361 | -8.61 | ||||
| 2025-08-12 | 13F | SRS Capital Advisors, Inc. | 597 | 239.20 | 67 | 272.22 | ||||
| 2025-08-14 | 13F | Wells Fargo & Company/mn | 56,604 | -25.48 | 6,398 | -18.36 | ||||
| 2025-05-15 | 13F | Captrust Financial Advisors | 0 | -100.00 | 0 | |||||
| 2025-05-16 | 13F/A | Atlanta Consulting Group Advisors, LLC | 0 | -100.00 | 0 | |||||
| 2025-07-24 | 13F | Drucker Wealth 3.0, LLC | 14,549 | 1,681 | ||||||
| 2025-07-18 | 13F | Consolidated Portfolio Review Corp | 2,956 | -1.17 | 334 | 8.44 | ||||
| 2025-08-07 | 13F | Allworth Financial LP | 31,893 | -3.12 | 3,605 | 7.13 | ||||
| 2025-08-04 | 13F | Keybank National Association/oh | 29,786 | 4.64 | 3,367 | 14.65 | ||||
| 2025-04-17 | 13F | Abound Wealth Management | 0 | -100.00 | 0 | |||||
| 2025-08-12 | 13F | Franklin Resources Inc | 27,394 | 0.00 | 3,096 | 9.55 | ||||
| 2025-07-10 | 13F | Wealth Enhancement Advisory Services, Llc | 6,172 | 30.16 | 713 | 45.60 | ||||
| 2025-08-04 | 13F | BLB&B Advisors, LLC | 2,822 | 0.00 | 319 | 9.28 | ||||
| 2025-08-14 | 13F | Betterment LLC | 7,176 | -8.68 | 1 | |||||
| 2025-07-31 | 13F | Oppenheimer & Co Inc | 0 | -100.00 | 0 | |||||
| 2025-08-14 | 13F | Royal Bank Of Canada | 17,937 | -5.09 | 2,028 | 4.05 | ||||
| 2025-07-29 | 13F | Stordahl Capital Management, Inc. | 141,778 | 1.32 | 16,025 | 11.01 | ||||
| 2025-08-04 | 13F | Assetmark, Inc | 491 | -90.83 | 55 | -90.04 | ||||
| 2025-08-11 | 13F | Advisor Resource Council | 0 | -100.00 | 0 | |||||
| 2025-07-11 | 13F | Farther Finance Advisors, LLC | 663 | 0.00 | 75 | 7.25 | ||||
| 2025-07-25 | 13F | Sequoia Financial Advisors, LLC | 1,795 | 203 | ||||||
| 2025-08-14 | 13F | Moneta Group Investment Advisors Llc | 128,829 | 159.75 | 14,561 | 184.62 | ||||
| 2025-08-12 | 13F | Global Retirement Partners, LLC | 1,728 | 0.00 | 195 | 0.52 | ||||
| 2025-08-12 | 13F | Virtu Financial LLC | 7,335 | -18.64 | 1 | |||||
| 2025-07-21 | 13F | Crews Bank & Trust | 80 | 0.00 | 9 | 12.50 | ||||
| 2025-08-14 | 13F | EP Wealth Advisors, Inc. | 950 | 107 | ||||||
| 2025-08-11 | 13F | Private Advisor Group, LLC | 16,483 | -3.25 | 1,863 | 6.03 | ||||
| 2025-07-22 | 13F | Integrated Capital Management, LLC | 33,452 | 13.35 | 4 | 0.00 | ||||
| 2025-08-14 | 13F | CIBC World Markets Inc. | 9,340 | 0.31 | 1,056 | 9.90 | ||||
| 2025-08-01 | 13F | Envestnet Asset Management Inc | 17,753 | -4.92 | 2,007 | 4.15 | ||||
| 2025-08-12 | 13F | Proequities, Inc. | 0 | 0 | ||||||
| 2025-08-08 | 13F | Gts Securities Llc | 8,107 | 916 | ||||||
| 2025-07-31 | 13F | Hobart Private Capital, LLC | 4,738 | 0.00 | 536 | 9.63 | ||||
| 2025-08-26 | 13F/A | Thrivent Financial For Lutherans | 17,623 | 2 | ||||||
| 2025-05-09 | 13F | Wealthspire Advisors, LLC | 0 | -100.00 | 0 | |||||
| 2025-04-21 | 13F | Ronald Blue Trust, Inc. | 0 | -100.00 | 0 | |||||
| 2025-08-15 | 13F | Morgan Stanley | 169,543 | 29.83 | 19,164 | 42.23 | ||||
| 2025-08-07 | 13F | PFG Advisors | 0 | -100.00 | 0 | |||||
| 2025-08-15 | 13F | Equitable Holdings, Inc. | 7,957 | 1.97 | 899 | 11.68 | ||||
| 2025-08-14 | 13F | Citadel Advisors Llc | 5,294 | -74.02 | 598 | -71.55 | ||||
| 2025-07-21 | 13F | Ameriflex Group, Inc. | 596 | 0.68 | 67 | 9.84 | ||||
| 2025-08-11 | 13F | Insight 2811, Inc. | 2,301 | 260 | ||||||
| 2025-08-14 | 13F | Safeguard Investment Advisory Group, LLC | 2,600 | 0.00 | 294 | 9.33 | ||||
| 2025-08-08 | 13F | Creative Planning | 14,708 | 1.49 | 1,662 | 11.17 | ||||
| 2025-07-28 | 13F | Bridges Investment Management Inc | 3,860 | 0.00 | 436 | 9.55 | ||||
| 2025-07-22 | 13F | Merit Financial Group, LLC | 5,439 | -6.48 | 615 | 2.33 | ||||
| 2025-08-04 | 13F | Quaker Wealth Management, LLC | Put | 0 | -100.00 | 0 | -100.00 | |||
| 2025-08-14 | 13F | Mercer Global Advisors Inc /adv | 8,298 | 3.54 | 941 | 15.89 | ||||
| 2025-07-16 | 13F | Octavia Wealth Advisors, LLC | 143,862 | -11.04 | 16,261 | -2.54 | ||||
| 2025-08-06 | 13F | Commonwealth Equity Services, Llc | 16,418 | -19.02 | 2 | -50.00 | ||||
| 2025-07-10 | 13F | Weinberger Asset Management, Inc | 2,161 | 0.00 | 244 | 9.91 | ||||
| 2025-07-17 | 13F | Hanson & Doremus Investment Management | 902 | 0.00 | 0 | |||||
| 2025-03-12 | 13F/A | Private Capital Management Llc | 3,698 | -0.16 | 405 | -3.57 | ||||
| 2025-08-05 | 13F | MidAtlantic Capital Management, Inc. | 3,680 | 0.00 | 416 | 9.50 | ||||
| 2025-08-14 | 13F | Ameriprise Financial Inc | 92,841 | 20.04 | 10,489 | 31.25 | ||||
| 2025-08-12 | 13F | Howe & Rusling Inc | 466 | 0.00 | 53 | 8.33 | ||||
| 2025-07-29 | 13F | Rodgers & Associates, LTD | 3,606 | 2.27 | 408 | 12.12 | ||||
| 2025-08-11 | 13F | Sierra Capital LLC | 2,628 | 0 | ||||||
| 2025-08-13 | 13F | SageView Advisory Group, LLC | 18,087 | -29.94 | 2,129 | -20.09 | ||||
| 2025-07-29 | 13F | Salomon & Ludwin, LLC | 257 | 0.00 | 30 | 11.54 | ||||
| 2025-08-11 | 13F | Principal Securities, Inc. | 1,587 | 3.86 | 179 | 4.07 | ||||
| 2025-07-21 | 13F | Barrett & Company, Inc. | 968 | 0.00 | 109 | 10.10 | ||||
| 2025-08-08 | 13F | Larson Financial Group LLC | 1 | 0.00 | 0 | |||||
| 2025-07-25 | 13F | Atria Wealth Solutions, Inc. | 1,808 | -16.37 | 208 | -6.73 | ||||
| 2025-08-11 | 13F | WPG Advisers, LLC | 256 | 0.00 | 29 | 7.69 | ||||
| 2025-08-14 | 13F | Stifel Financial Corp | 29,598 | -1.66 | 3,345 | 7.73 | ||||
| 2025-07-17 | 13F | Lauterbach Financial Advisors, LLC | 6,125 | 0.00 | 692 | 9.67 | ||||
| 2025-07-24 | 13F | Jfs Wealth Advisors, Llc | 2,188 | 12.38 | 247 | 23.50 | ||||
| 2025-08-06 | 13F | SOUTH STATE Corp | 3,698 | 0.00 | 418 | 9.45 | ||||
| 2025-07-24 | 13F | Morton Brown Family Wealth, LLC | 1,936 | 10.63 | 219 | 21.11 | ||||
| 2025-07-24 | 13F | Blair William & Co/il | 15,819 | -2.99 | 1,788 | 6.24 | ||||
| 2025-07-15 | 13F | Mather Group, Llc. | 0 | -100.00 | 0 | |||||
| 2025-07-17 | 13F | Sound Income Strategies, LLC | 12 | -50.00 | 1 | -50.00 | ||||
| 2025-08-13 | 13F | Financial Freedom, LLC | 2,499 | -14.27 | 282 | -6.00 | ||||
| 2025-08-05 | 13F | Plante Moran Financial Advisors, LLC | 561 | 63 | ||||||
| 2025-08-14 | 13F | Mml Investors Services, Llc | 12,181 | 25.25 | 1 | 0.00 | ||||
| 2025-07-23 | 13F | Stephen J. Garry & Associates, Llc | 36,751 | -0.43 | 4,154 | 9.09 | ||||
| 2025-07-22 | 13F | Coastal Investment Advisors, Inc. | 0 | -100.00 | 0 | |||||
| 2025-08-14 | 13F | Jane Street Group, Llc | 7,676 | -10.07 | 868 | -1.48 | ||||
| 2025-08-04 | 13F | Bristlecone Advisors, LLC | 220 | 0.00 | 25 | 9.09 | ||||
| 2025-07-29 | 13F | Chicago Partners Investment Group LLC | 12,517 | 3.69 | 1,464 | 14.57 | ||||
| 2025-05-05 | 13F | Lindbrook Capital, Llc | 350 | 0.00 | 36 | -7.69 | ||||
| 2025-08-11 | 13F | HighTower Advisors, LLC | 14,888 | -2.41 | 1,683 | 6.93 | ||||
| 2025-07-09 | 13F | Dynamic Advisor Solutions LLC | 1,960 | 222 | ||||||
| 2025-08-19 | 13F | Asset Dedication, LLC | 110 | 0.00 | 12 | 9.09 | ||||
| 2025-07-31 | 13F | Cambridge Investment Research Advisors, Inc. | 7,059 | 0.33 | 1 | |||||
| 2025-08-14 | 13F | Comerica Bank | 150 | -13.79 | 17 | -5.88 | ||||
| 2025-05-08 | 13F | Marshall Investment Management, Llc | 0 | -100.00 | 0 | |||||
| 2025-08-14 | 13F | Fmr Llc | 6,360 | 27.58 | 719 | 39.69 | ||||
| 2025-08-14 | 13F | Susquehanna International Group, Llp | 10,157 | 62.72 | 1,148 | 78.54 | ||||
| 2025-08-12 | 13F | LPL Financial LLC | 179,585 | 12.79 | 20,299 | 23.56 | ||||
| 2025-07-25 | 13F | We Are One Seven, LLC | 2,147 | -0.51 | 243 | 9.01 | ||||
| 2025-08-07 | 13F | Commerce Bank | 6,960 | 0.00 | 787 | 9.47 | ||||
| 2025-08-13 | 13F | Balanced Wealth Group Llc | 2,283 | 0.00 | 264 | 11.91 | ||||
| 2025-08-13 | 13F | Russell Investments Group, Ltd. | 390 | 0.00 | 44 | 10.00 | ||||
| 2025-08-14 | 13F | Ausdal Financial Partners, Inc. | 2,478 | 0.85 | 280 | 10.67 | ||||
| 2025-08-13 | 13F | Northwestern Mutual Wealth Management Co | 27,939 | 62.97 | 3,158 | 78.56 | ||||
| 2025-05-15 | 13F | Lido Advisors, LLC | 0 | -100.00 | 0 | -100.00 |