Mga Batayang Estadistika
| Pemilik Institusional | 108 total, 108 long only, 0 short only, 0 long/short - change of 2.86% MRQ |
| Alokasi Portofolio Rata-rata | 0.4854 % - change of 28.71% MRQ |
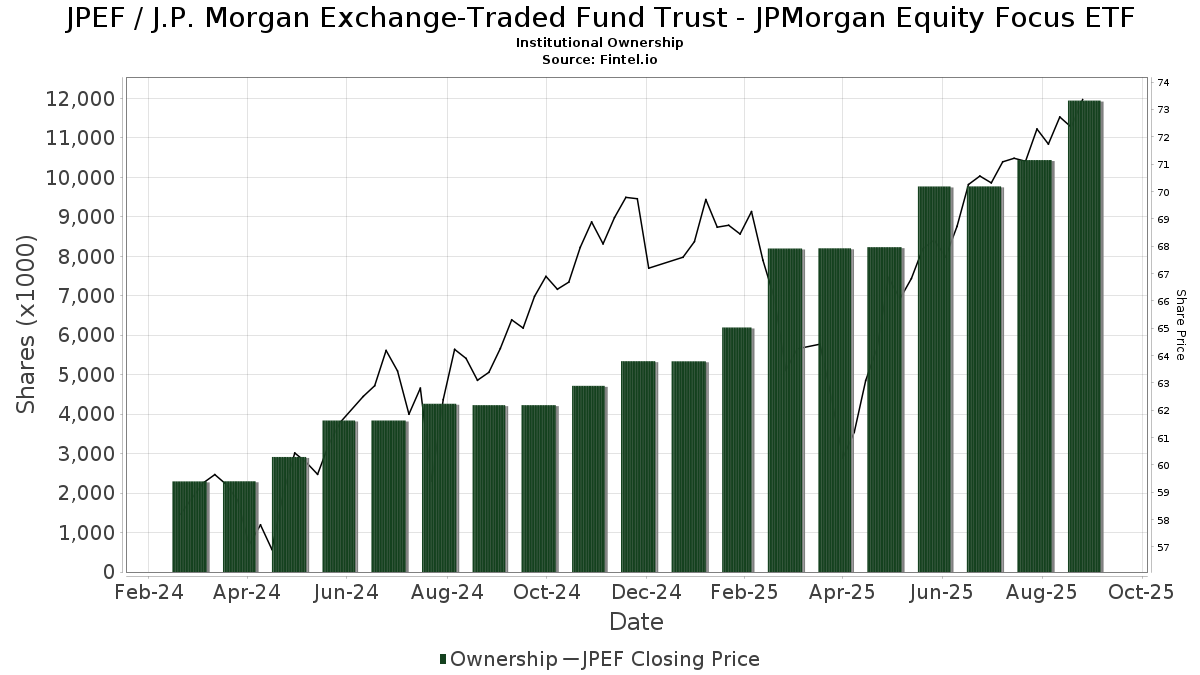
| Saham Institusional (Jangka Panjang) | 11,945,245 (ex 13D/G) - change of 2.17MM shares 22.24% MRQ |
| Nilai Institusional (Jangka Panjang) | $ 677,220 USD ($1000) |
Kepemilikan Institusional dan Pemegang Saham
J.P. Morgan Exchange-Traded Fund Trust - JPMorgan Equity Focus ETF (US:JPEF) memiliki 108 pemilik institusional dan pemegang saham yang telah mengajukan formulir 13D/G atau 13F kepada Komisi Bursa Efek (Securities Exchange Commission/SEC). Lembaga-lembaga ini memegang total 11,945,245 saham. Pemegang saham terbesar meliputi Raymond James Financial Inc, LPL Financial LLC, Mml Investors Services, Llc, Beaumont Financial Advisors, LLC, Advisor Group Holdings, Inc., Commonwealth Equity Services, Llc, Investment Planning Advisors, Inc., Jones Financial Companies Lllp, Cetera Investment Advisers, and Balance Wealth, LLC .
Struktur kepemilikan institusional J.P. Morgan Exchange-Traded Fund Trust - JPMorgan Equity Focus ETF (NasdaqGM:JPEF) menunjukkan posisi terkini di perusahaan oleh institusi dan dana, serta perubahan terbaru dalam ukuran posisi. Pemegang saham utama dapat mencakup investor individu, reksa dana, dana lindung nilai, atau institusi. Jadwal 13D menunjukkan bahwa investor memegang (atau pernah memegang) lebih dari 5% saham perusahaan dan bermaksud (atau pernah bermaksud) untuk secara aktif mengejar perubahan strategi bisnis. Jadwal 13G menunjukkan investasi pasif lebih dari 5%.
The share price as of September 5, 2025 is 73.01 / share. Previously, on September 6, 2024, the share price was 61.70 / share. This represents an increase of 18.33% over that period.
Skor Sentimen Dana
Skor Sentimen Dana (sebelumnya dikenal sebagai Skor Akumulasi Kepemilikan) menemukan saham-saham yang paling banyak dibeli oleh dana. Ini adalah hasil dari model kuantitatif multi-faktor yang canggih yang mengidentifikasi perusahaan dengan tingkat akumulasi institusional tertinggi. Model penilaian menggunakan kombinasi dari total peningkatan pemilik yang diungkapkan, perubahan dalam alokasi portofolio pada pemilik tersebut, dan metrik lainnya. Angka berkisar dari 0 hingga 100, dengan angka yang lebih tinggi menunjukkan tingkat akumulasi yang lebih tinggi dibandingkan dengan perusahaan sejenisnya, dan 50 adalah rata-ratanya.
Frekuensi Pembaruan: Setiap Hari
Lihat Ownership Explorer, yang menyediakan daftar perusahaan dengan peringkat tertinggi.
Rasio Put/Call Institusional
Selain melaporkan isu ekuitas dan utang standar, institusi dengan aset di bawah manajemen lebih dari 100 juta dolar AS juga harus mengungkapkan kepemilikan opsi put dan call mereka. Karena opsi put umumnya menunjukkan sentimen negatif, dan opsi call menunjukkan sentimen positif, kita dapat mengetahui sentimen institusional secara keseluruhan dengan memplot rasio put terhadap call. Grafik di sebelah kanan memplot rasio put/call historis untuk instrumen ini.
Menggunakan Rasio Put/Call sebagai indikator sentimen investor mengatasi salah satu kekurangan utama dari penggunaan total kepemilikan institusional, yaitu sejumlah besar aset yang dikelola diinvestasikan secara pasif untuk melacak indeks. Dana yang dikelola secara pasif biasanya tidak membeli opsi, sehingga indikator rasio put/call lebih akurat dalam melacak sentimen dana yang dikelola secara aktif.
Pengajuan 13F dan NPORT
Detail pada pengajuan 13F tersedia gratis. Detail pada pengajuan NP memerlukan keanggotaan premium. Baris berwarna hijau menunjukkan posisi baru. Baris berwarna merah menunjukkan posisi yang sudah ditutup. Klik tautan ini ikon untuk melihat riwayat transaksi selengkapnya.
Tingkatkan
untuk membuka data premium dan mengekspor ke Excel ![]() .
.
| Tanggal File | Sumber | Investor | Ketik | Presyo ng Avg (Silangan) |
Saham | Δ Saham (%) |
Dilaporkan Nilai ($1000) |
Nilai Δ (%) |
Alokasi Port (%) |
|
|---|---|---|---|---|---|---|---|---|---|---|
| 2025-08-11 | 13F | Private Advisor Group, LLC | 10,436 | 18.42 | 732 | 30.30 | ||||
| 2025-07-07 | 13F | First Citizens Financial Corp | 8,110 | 0.00 | 569 | 10.08 | ||||
| 2025-07-15 | 13F | Cora Capital Advisors Llc | 6,024 | -51.10 | 423 | -46.17 | ||||
| 2025-08-12 | 13F | Eldridge Investment Advisors, Inc. | 0 | -100.00 | 0 | |||||
| 2025-07-24 | 13F | 3Chopt Investment Partners, LLC | 1,877 | 122.13 | 132 | 147.17 | ||||
| 2025-08-08 | 13F/A | Ignite Planners, LLC | 24,014 | -2.52 | 1,698 | 8.16 | ||||
| 2025-08-13 | 13F | Denver Wealth Management, Inc. | 4,883 | 0.00 | 342 | 10.32 | ||||
| 2025-04-14 | 13F | Strategic Wealth Designers | 0 | -100.00 | 0 | -100.00 | ||||
| 2025-07-17 | 13F | DiNuzzo Private Wealth, Inc. | 278 | 0.00 | 19 | 11.76 | ||||
| 2025-08-13 | 13F | Brown Advisory Inc | 7,349 | 0.00 | 515 | 10.28 | ||||
| 2025-08-05 | 13F | Atlas Private Wealth Advisors | 6,490 | 54.52 | 455 | 70.41 | ||||
| 2025-08-13 | 13F | Johnson Financial Group, Inc. | 56 | 0.00 | 4 | 0.00 | ||||
| 2025-05-15 | 13F | Qube Research & Technologies Ltd | 0 | -100.00 | 0 | |||||
| 2025-05-02 | 13F | Sigma Planning Corp | 0 | -100.00 | 0 | |||||
| 2025-08-05 | 13F | 5T Wealth, LLC | 8,959 | 628 | ||||||
| 2025-07-22 | 13F | DAVENPORT & Co LLC | 76,280 | 5.85 | 5,350 | 16.63 | ||||
| 2025-07-22 | 13F | BridgePort Financial Solutions, LLC | 78,776 | 212.23 | 5,525 | 244.02 | ||||
| 2025-07-31 | 13F | Cambridge Investment Research Advisors, Inc. | 36,008 | -13.06 | 3 | 0.00 | ||||
| 2025-08-14 | 13F | Fmr Llc | 41 | 0.00 | 3 | 0.00 | ||||
| 2025-07-28 | 13F | SFG Wealth Management, LLC. | 0 | -100.00 | 0 | |||||
| 2025-07-15 | 13F | Fifth Third Bancorp | 473 | 33 | ||||||
| 2025-08-13 | 13F | Northwestern Mutual Wealth Management Co | 69,335 | -16.37 | 4,863 | -7.85 | ||||
| 2025-07-25 | 13F | Concurrent Investment Advisors, LLC | 7,136 | 43.73 | 501 | 58.23 | ||||
| 2025-07-30 | 13F | Prosperity Financial Group, Inc. | 11,352 | 4.69 | 796 | 15.36 | ||||
| 2025-07-17 | 13F | Janney Montgomery Scott LLC | 253,545 | 15.37 | 18 | 30.77 | ||||
| 2025-08-06 | 13F | AE Wealth Management LLC | 67 | 0.00 | 5 | 0.00 | ||||
| 2025-07-16 | 13F | Morangie Management LLC | 15,020 | 1,054 | ||||||
| 2025-07-18 | 13F | Truist Financial Corp | 61,921 | -3.98 | 4,343 | 5.80 | ||||
| 2025-08-13 | 13F | Kayne Anderson Rudnick Investment Management Llc | 714 | 0.00 | 50 | 11.11 | ||||
| 2025-07-24 | 13F | Us Bancorp \de\ | 799 | 0.00 | 56 | 12.00 | ||||
| 2025-08-14 | 13F | Herold Advisors, Inc. | 15,315 | 14.36 | 1,074 | 26.06 | ||||
| 2025-07-24 | 13F | Capital Advisors, Ltd. LLC | 17,359 | 5.22 | 1 | 0.00 | ||||
| 2025-08-14 | 13F | Mercer Global Advisors Inc /adv | 4,759 | 334 | ||||||
| 2025-08-14 | 13F | Goldman Sachs Group Inc | 0 | -100.00 | 0 | |||||
| 2025-04-18 | 13F | Tennessee Valley Asset Management Partners | 0 | -100.00 | 0 | |||||
| 2025-08-12 | 13F/A | Cozad Asset Management Inc | 137,753 | 1.14 | 9,662 | 11.43 | ||||
| 2025-07-28 | 13F | Harbour Investments, Inc. | 4,021 | -13.10 | 282 | -4.08 | ||||
| 2025-08-08 | 13F | Kingsview Wealth Management, LLC | 57,043 | 11.76 | 4,001 | 23.15 | ||||
| 2025-08-12 | 13F | Proequities, Inc. | 0 | 0 | ||||||
| 2025-08-14 | 13F | Stifel Financial Corp | 39,283 | 7.32 | 2,755 | 18.24 | ||||
| 2025-08-14 | 13F | UBS Group AG | 1,189 | -18.45 | 83 | -9.78 | ||||
| 2025-08-12 | 13F | BlackRock, Inc. | 0 | -100.00 | 0 | |||||
| 2025-05-08 | 13F | Geneos Wealth Management Inc. | 0 | -100.00 | 0 | |||||
| 2025-08-14 | 13F | Mariner, LLC | 4,157 | -2.39 | 292 | 7.38 | ||||
| 2025-08-13 | 13F | Cary Street Partner Investment Advisory Llc | 24 | 2 | ||||||
| 2025-07-11 | 13F | Pinnacle Bancorp, Inc. | 270 | 19 | ||||||
| 2025-08-13 | 13F | Cary Street Partners Financial Llc | 49,536 | 1.84 | 3,474 | 12.21 | ||||
| 2025-08-14 | 13F | Jane Street Group, Llc | 9,373 | -68.22 | 657 | -65.00 | ||||
| 2025-08-18 | 13F | Tyler-Stone Wealth Management | 33,602 | 12.07 | 2,357 | 23.48 | ||||
| 2025-08-26 | 13F/A | Thrivent Financial For Lutherans | 322,194 | 23 | ||||||
| 2025-07-24 | 13F | Blair William & Co/il | 0 | -100.00 | 0 | |||||
| 2025-08-13 | 13F | Level Four Advisory Services, Llc | 169,821 | -1.24 | 11,911 | 8.82 | ||||
| 2025-07-17 | 13F | Fifth Third Securities, Inc. | 71,067 | -18.36 | 4,985 | -10.05 | ||||
| 2025-08-11 | 13F | Principal Securities, Inc. | 571 | 0.00 | 40 | 5.26 | ||||
| 2025-07-16 | 13F | Beaumont Financial Advisors, LLC | 699,354 | 102.15 | 49,053 | 122.72 | ||||
| 2025-08-12 | 13F | CIBC Private Wealth Group, LLC | 0 | -100.00 | 0 | |||||
| 2025-08-08 | 13F | Good Life Advisors, LLC | 34,844 | -26.92 | 2,444 | -19.51 | ||||
| 2025-08-12 | 13F | Jpmorgan Chase & Co | 69,703 | 33.08 | 4,889 | 46.61 | ||||
| 2025-07-30 | 13F | D.a. Davidson & Co. | 71,651 | 38.33 | 5,026 | 52.41 | ||||
| 2025-07-21 | 13F | Investment Planning Advisors, Inc. | 482,072 | 8.14 | 33,812 | 19.15 | ||||
| 2025-08-01 | 13F | Envestnet Asset Management Inc | 291,588 | -22.90 | 20,452 | -15.05 | ||||
| 2025-07-25 | 13F | Lodestar Private Asset Management Llc | 4,596 | -42.38 | 322 | -36.49 | ||||
| 2025-07-18 | 13F | Parsons Capital Management Inc/ri | 4,200 | 0.65 | 295 | 10.94 | ||||
| 2025-08-14 | 13F | Fort Point Capital Partners LLC | 15,387 | 3.16 | 1,079 | 13.70 | ||||
| 2025-08-14 | 13F | Empire Life Investments Inc. | 84,300 | -30.63 | 5,913 | -23.58 | ||||
| 2025-08-01 | 13F | Advisory Alpha, LLC | 4,553 | 21.80 | 319 | 34.60 | ||||
| 2025-05-15 | 13F | MAI Capital Management | 0 | -100.00 | 0 | |||||
| 2025-08-14 | 13F | Susquehanna International Group, Llp | 16,120 | 1,131 | ||||||
| 2025-08-08 | 13F | Cetera Investment Advisers | 334,092 | 22.74 | 23,433 | 35.24 | ||||
| 2025-07-17 | 13F | Leverty Financial Group, LLC | 285,994 | 20,059 | ||||||
| 2025-08-04 | 13F | Pensionmark Financial Group, Llc | 13,139 | 0.00 | 922 | 10.17 | ||||
| 2025-08-15 | 13F | Kestra Advisory Services, LLC | 91,885 | 25.35 | 6,445 | 38.11 | ||||
| 2025-07-25 | 13F | Hazlett, Burt & Watson, Inc. | 827 | 14.54 | 0 | |||||
| 2025-08-14 | 13F | Snowden Capital Advisors LLC | 6,943 | -16.77 | 487 | -8.29 | ||||
| 2025-07-22 | 13F | Wealthcare Advisory Partners LLC | 24,732 | 6.66 | 1,735 | 17.48 | ||||
| 2025-08-14 | 13F | Integrity Wealth Advisors, Inc. | 18,330 | 73.06 | 1,286 | 90.65 | ||||
| 2025-07-25 | 13F | SPC Financial, Inc. | 127,614 | 6.22 | 8,951 | 17.02 | ||||
| 2025-07-30 | 13F | Castle Wealth Management Llc | 74,549 | 3.78 | 5,229 | 14.35 | ||||
| 2025-08-13 | 13F | Capital Advisors Wealth Management, LLC | 9,292 | 6.93 | 652 | 17.72 | ||||
| 2025-08-15 | 13F | Resources Management Corp /ct/ /adv | 4,357 | 0 | ||||||
| 2025-05-15 | 13F | Old Mission Capital Llc | 0 | -100.00 | 0 | |||||
| 2025-08-14 | 13F | Citadel Advisors Llc | 0 | -100.00 | 0 | |||||
| 2025-07-22 | 13F | MBL Wealth, LLC | 70,565 | 80.94 | 4,949 | 99.40 | ||||
| 2025-07-29 | 13F | Stratos Wealth Partners, LTD. | 314,949 | 3.16 | 22,091 | 13.66 | ||||
| 2025-08-04 | 13F | WNY Asset Management, LLC | 6,079 | -1.68 | 426 | 8.40 | ||||
| 2025-08-13 | 13F | Continuum Advisory, LLC | 0 | -100.00 | 0 | |||||
| 2025-08-07 | 13F | Flagship Wealth Advisors, Llc | 37,652 | 0.35 | 2,641 | 10.55 | ||||
| 2025-08-14 | 13F | Mml Investors Services, Llc | 1,076,371 | 7.62 | 75 | 19.05 | ||||
| 2025-08-14 | 13F | Royal Bank Of Canada | 163,896 | -3.26 | 11,495 | 6.57 | ||||
| 2025-08-14 | 13F | Comerica Bank | 1,869 | 3.43 | 131 | 13.91 | ||||
| 2025-08-07 | 13F | Kestra Private Wealth Services, Llc | 3,459 | 243 | ||||||
| 2025-08-15 | 13F | Captrust Financial Advisors | 4,064 | 8.78 | 285 | 20.25 | ||||
| 2025-08-15 | 13F | Equitable Holdings, Inc. | 40,273 | -8.57 | 2,825 | 0.75 | ||||
| 2025-08-14 | 13F | Modern Wealth Management, LLC | 6,907 | 0.00 | 484 | 10.25 | ||||
| 2025-08-15 | 13F | Tower Research Capital LLC (TRC) | 0 | -100.00 | 0 | |||||
| 2025-08-13 | 13F | Jones Financial Companies Lllp | 367,880 | 58.14 | 25,689 | 74.60 | ||||
| 2025-08-06 | 13F | Csenge Advisory Group | 8,620 | 0.00 | 578 | 11.18 | ||||
| 2025-08-12 | 13F | Global Retirement Partners, LLC | 1,046 | -6.86 | 73 | -2.67 | ||||
| 2025-08-04 | 13F | Hantz Financial Services, Inc. | 0 | -100.00 | 0 | |||||
| 2025-08-07 | 13F | Resources Investment Advisors, LLC. | 8,008 | 4.01 | 562 | 14.49 | ||||
| 2025-07-24 | 13F | IFP Advisors, Inc | 70,280 | -20.27 | 4,929 | -12.15 | ||||
| 2025-08-05 | 13F | Crestwood Advisors Group LLC | 44,743 | 14.86 | 3,138 | 26.58 | ||||
| 2025-07-23 | 13F | Gentry Private Wealth, Llc | 3,299 | 0.00 | 231 | 10.00 | ||||
| 2025-07-29 | 13F | Private Trust Co Na | 1,994 | 0.00 | 140 | 10.32 | ||||
| 2025-07-23 | 13F | Kingswood Wealth Advisors, Llc | 4,747 | -28.15 | 333 | -20.95 | ||||
| 2025-08-15 | 13F | Morgan Stanley | 35 | 0.00 | 2 | 0.00 | ||||
| 2025-07-16 | 13F | Novem Group | 184,183 | 2.15 | 12,919 | 12.56 | ||||
| 2025-04-21 | 13F | Institute for Wealth Management, LLC. | 0 | -100.00 | 0 | |||||
| 2025-08-06 | 13F | Carnegie Lake Advisors LLC | 3,775 | 0.00 | 0 | |||||
| 2025-08-08 | 13F | Avantax Advisory Services, Inc. | 236,329 | 5.20 | 16,576 | 15.91 | ||||
| 2025-09-04 | 13F/A | Advisor Group Holdings, Inc. | 558,669 | 29.05 | 39,186 | 42.17 | ||||
| 2025-07-25 | 13F | Cwm, Llc | 3,132 | -20.00 | 0 | |||||
| 2025-08-06 | 13F | Commonwealth Equity Services, Llc | 532,493 | 9.26 | 37 | 19.35 | ||||
| 2025-08-14 | 13F | Raymond James Financial Inc | 1,958,565 | 9.82 | 137,374 | 21.00 | ||||
| 2025-08-13 | 13F | MONECO Advisors, LLC | 227,618 | 9.70 | 15,965 | 20.87 | ||||
| 2025-08-08 | 13F | Thoroughbred Financial Services, Llc | 39,719 | -21.02 | 3 | -33.33 | ||||
| 2025-07-16 | 13F | St Germain D J Co Inc | 2,836 | 0.00 | 199 | 10.00 | ||||
| 2025-08-14 | 13F | Vienna Asset Management LLC | 5,222 | -91.30 | 366 | -90.42 | ||||
| 2025-08-14 | 13F | Financial Network Wealth Advisors LLC | 502 | 0.00 | 35 | 12.90 | ||||
| 2025-07-11 | 13F | Farther Finance Advisors, LLC | 787 | 55 | ||||||
| 2025-08-13 | 13F | Balance Wealth, LLC | 326,863 | 103.69 | 22,926 | 124.43 | ||||
| 2025-07-14 | 13F | Southland Equity Partners LLC | 7,187 | 112.19 | 504 | 134.42 | ||||
| 2025-07-10 | 13F | Wealth Enhancement Advisory Services, Llc | 7,344 | 15.60 | 520 | 28.71 | ||||
| 2025-07-16 | 13F | Essex Financial Services, Inc. | 4,973 | 349 | ||||||
| 2025-07-18 | 13F | Bridge Generations Wealth Management Llc | 13 | 0.00 | 1 | |||||
| 2025-08-12 | 13F | Steward Partners Investment Advisory, Llc | 15,764 | 286.28 | 1,106 | 326.64 | ||||
| 2025-08-12 | 13F | LPL Financial LLC | 1,195,133 | 61.18 | 83,827 | 77.59 |