Mga Batayang Estadistika
| Pemilik Institusional | 197 total, 196 long only, 0 short only, 1 long/short - change of 0.00% MRQ |
| Alokasi Portofolio Rata-rata | 0.0869 % - change of -11.35% MRQ |
| Saham Institusional (Jangka Panjang) | 20,770,318 (ex 13D/G) - change of -0.80MM shares -3.72% MRQ |
| Nilai Institusional (Jangka Panjang) | $ 405,842 USD ($1000) |
Kepemilikan Institusional dan Pemegang Saham
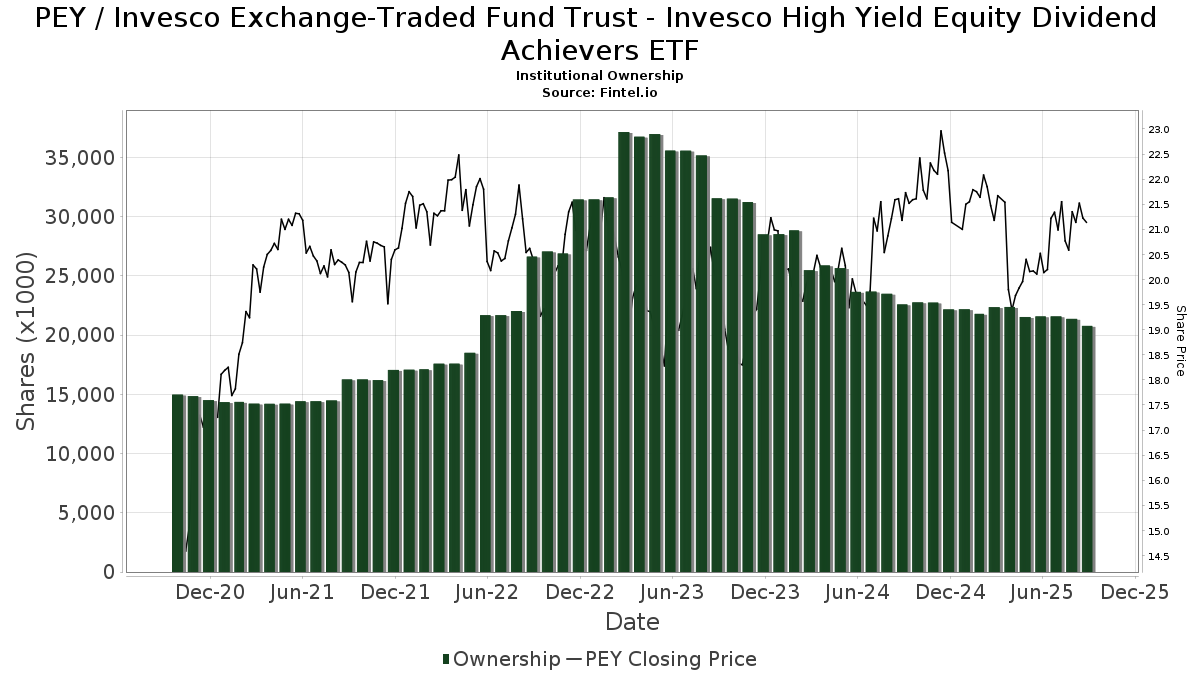
Invesco Exchange-Traded Fund Trust - Invesco High Yield Equity Dividend Achievers ETF (US:PEY) memiliki 197 pemilik institusional dan pemegang saham yang telah mengajukan formulir 13D/G atau 13F kepada Komisi Bursa Efek (Securities Exchange Commission/SEC). Lembaga-lembaga ini memegang total 20,770,318 saham. Pemegang saham terbesar meliputi Bank Of America Corp /de/, Morgan Stanley, LPL Financial LLC, Wells Fargo & Company/mn, Raymond James Financial Inc, Cetera Investment Advisers, Warren Averett Asset Management, LLC, Investors Research Corp, UBS Group AG, and Royal Bank Of Canada .
Struktur kepemilikan institusional Invesco Exchange-Traded Fund Trust - Invesco High Yield Equity Dividend Achievers ETF (NasdaqGM:PEY) menunjukkan posisi terkini di perusahaan oleh institusi dan dana, serta perubahan terbaru dalam ukuran posisi. Pemegang saham utama dapat mencakup investor individu, reksa dana, dana lindung nilai, atau institusi. Jadwal 13D menunjukkan bahwa investor memegang (atau pernah memegang) lebih dari 5% saham perusahaan dan bermaksud (atau pernah bermaksud) untuk secara aktif mengejar perubahan strategi bisnis. Jadwal 13G menunjukkan investasi pasif lebih dari 5%.
The share price as of September 5, 2025 is 21.39 / share. Previously, on September 6, 2024, the share price was 21.24 / share. This represents an increase of 0.69% over that period.
Skor Sentimen Dana
Skor Sentimen Dana (sebelumnya dikenal sebagai Skor Akumulasi Kepemilikan) menemukan saham-saham yang paling banyak dibeli oleh dana. Ini adalah hasil dari model kuantitatif multi-faktor yang canggih yang mengidentifikasi perusahaan dengan tingkat akumulasi institusional tertinggi. Model penilaian menggunakan kombinasi dari total peningkatan pemilik yang diungkapkan, perubahan dalam alokasi portofolio pada pemilik tersebut, dan metrik lainnya. Angka berkisar dari 0 hingga 100, dengan angka yang lebih tinggi menunjukkan tingkat akumulasi yang lebih tinggi dibandingkan dengan perusahaan sejenisnya, dan 50 adalah rata-ratanya.
Frekuensi Pembaruan: Setiap Hari
Lihat Ownership Explorer, yang menyediakan daftar perusahaan dengan peringkat tertinggi.
Rasio Put/Call Institusional
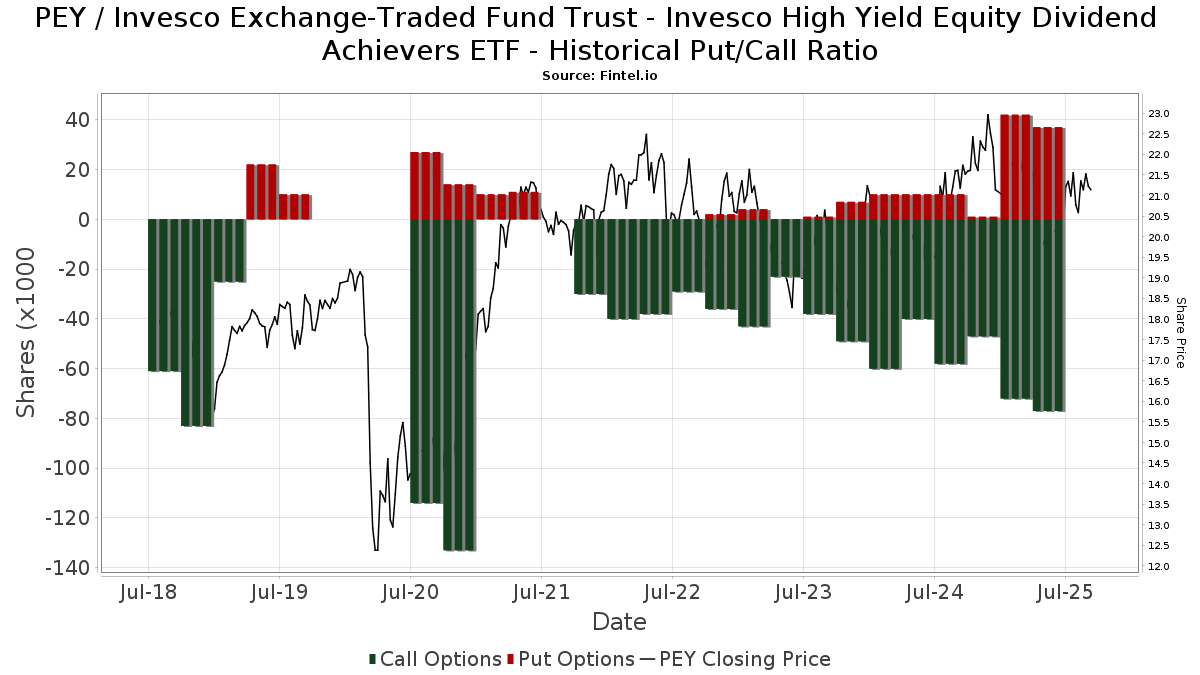
Selain melaporkan isu ekuitas dan utang standar, institusi dengan aset di bawah manajemen lebih dari 100 juta dolar AS juga harus mengungkapkan kepemilikan opsi put dan call mereka. Karena opsi put umumnya menunjukkan sentimen negatif, dan opsi call menunjukkan sentimen positif, kita dapat mengetahui sentimen institusional secara keseluruhan dengan memplot rasio put terhadap call. Grafik di sebelah kanan memplot rasio put/call historis untuk instrumen ini.
Menggunakan Rasio Put/Call sebagai indikator sentimen investor mengatasi salah satu kekurangan utama dari penggunaan total kepemilikan institusional, yaitu sejumlah besar aset yang dikelola diinvestasikan secara pasif untuk melacak indeks. Dana yang dikelola secara pasif biasanya tidak membeli opsi, sehingga indikator rasio put/call lebih akurat dalam melacak sentimen dana yang dikelola secara aktif.
Pengajuan 13F dan NPORT
Detail pada pengajuan 13F tersedia gratis. Detail pada pengajuan NP memerlukan keanggotaan premium. Baris berwarna hijau menunjukkan posisi baru. Baris berwarna merah menunjukkan posisi yang sudah ditutup. Klik tautan ini ikon untuk melihat riwayat transaksi selengkapnya.
Tingkatkan
untuk membuka data premium dan mengekspor ke Excel ![]() .
.
| Tanggal File | Sumber | Investor | Ketik | Presyo ng Avg (Silangan) |
Saham | Δ Saham (%) |
Dilaporkan Nilai ($1000) |
Nilai Δ (%) |
Alokasi Port (%) |
|
|---|---|---|---|---|---|---|---|---|---|---|
| 2025-08-14 | 13F | Susquehanna International Group, Llp | Put | 37,900 | 20.70 | 774 | 14.69 | |||
| 2025-07-10 | 13F | Exchange Traded Concepts, Llc | 1,489 | 30 | ||||||
| 2025-08-14 | 13F | Susquehanna International Group, Llp | 50,074 | 1,022 | ||||||
| 2025-08-14 | 13F | Comerica Bank | 77,914 | 0.14 | 1,590 | -4.79 | ||||
| 2025-08-14 | 13F | Susquehanna International Group, Llp | Call | 23,300 | -17.38 | 476 | -21.49 | |||
| 2025-05-01 | 13F | Steel Peak Wealth Management LLC | 0 | -100.00 | 0 | |||||
| 2025-08-11 | 13F | Aptus Capital Advisors, LLC | 3,273 | 0.00 | 67 | -5.71 | ||||
| 2025-08-14 | 13F | Citadel Advisors Llc | Put | 0 | -100.00 | 0 | ||||
| 2025-08-08 | 13F | Cetera Investment Advisers | 425,523 | 5.04 | 8,685 | -0.15 | ||||
| 2025-08-15 | 13F | Kestra Advisory Services, LLC | 15,024 | 14.36 | 307 | 8.51 | ||||
| 2025-07-30 | 13F | First Citizens Bank & Trust Co | 77,440 | 1,581 | ||||||
| 2025-08-06 | 13F | Rialto Wealth Management, LLC | 1,174 | 0.00 | 24 | -8.00 | ||||
| 2025-08-04 | 13F | Bristlecone Advisors, LLC | 5,405 | 0.00 | 110 | -5.17 | ||||
| 2025-08-11 | 13F | Blue Bell Private Wealth Management, Llc | 990 | 0.00 | 20 | -4.76 | ||||
| 2025-07-15 | 13F | North Star Investment Management Corp. | 0 | -100.00 | 0 | |||||
| 2025-08-01 | 13F | Pasadena Private Wealth, LLC | 35,076 | 6.66 | 716 | 1.27 | ||||
| 2025-08-14 | 13F | Herold Advisors, Inc. | 11,216 | 0.12 | 229 | -5.00 | ||||
| 2025-04-18 | 13F | Pacific Capital Wealth Advisors, Inc | 0 | -100.00 | 0 | |||||
| 2025-07-21 | 13F | Precedent Wealth Partners, Llc | 23,963 | -34.17 | 489 | -37.39 | ||||
| 2025-04-21 | 13F | Beacon Capital Management, LLC | 0 | -100.00 | 0 | |||||
| 2025-07-28 | 13F | Founders Grove Wealth Partners, Llc | 222,547 | -2.20 | 4,542 | -7.02 | ||||
| 2025-08-05 | 13F | GHP Investment Advisors, Inc. | 140,562 | -9.51 | 2,869 | -14.00 | ||||
| 2025-08-12 | 13F | O'shaughnessy Asset Management, Llc | 10,060 | 12,168.29 | 205 | 20,400.00 | ||||
| 2025-08-14 | 13F | Wiley Bros.-aintree Capital, Llc | 10,808 | -31.83 | 219 | -34.34 | ||||
| 2025-08-15 | 13F | Equitable Holdings, Inc. | 96,505 | 3.92 | 1,970 | -1.20 | ||||
| 2025-08-05 | 13F | Westside Investment Management, Inc. | 1,000 | 0.00 | 20 | -4.76 | ||||
| 2025-08-12 | 13F | Proequities, Inc. | 0 | 0 | ||||||
| 2025-07-21 | 13F | Ntv Asset Management Llc | 13,340 | 0.00 | 272 | -4.90 | ||||
| 2025-08-18 | 13F | Brick & Kyle, Associates | 105,613 | 0.69 | 2 | 0.00 | ||||
| 2025-08-01 | 13F | Envestnet Asset Management Inc | 121,125 | -2.33 | 2,472 | -7.14 | ||||
| 2025-08-13 | 13F | Capital Analysts, Inc. | 1,249 | -1.03 | 0 | |||||
| 2025-07-10 | 13F | Stolper Co | 29,786 | 3.21 | 1 | |||||
| 2025-08-13 | 13F | Flow Traders U.s. Llc | 34,463 | -42.65 | 1 | -100.00 | ||||
| 2025-08-13 | 13F | Northwestern Mutual Wealth Management Co | 105,887 | -18.86 | 2,161 | -22.85 | ||||
| 2025-07-23 | 13F | Kingswood Wealth Advisors, Llc | 14,540 | -2.72 | 297 | -7.50 | ||||
| 2025-07-24 | 13F | IFP Advisors, Inc | 109,945 | -0.17 | 2,244 | -5.12 | ||||
| 2025-07-21 | 13F | Ameritas Advisory Services, LLC | 12,160 | -52.01 | 248 | -54.16 | ||||
| 2025-07-11 | 13F | Farther Finance Advisors, LLC | 2,477 | -33.81 | 51 | -37.50 | ||||
| 2025-07-09 | 13F | Dynamic Advisor Solutions LLC | 23,822 | 2.30 | 486 | -2.61 | ||||
| 2025-08-11 | 13F | Principal Securities, Inc. | 41,015 | 0.15 | 837 | -3.79 | ||||
| 2025-07-10 | 13F | Capital Advisory Group Advisory Services, LLC | 165,894 | -1.58 | 3,386 | -6.44 | ||||
| 2025-08-08 | 13F | Hartland & Co., LLC | 5,066 | -37.63 | 103 | -40.80 | ||||
| 2025-07-25 | 13F | NorthRock Partners, LLC | 1,000 | 0.00 | 20 | -4.76 | ||||
| 2025-04-25 | 13F | Colonial River Wealth Management, LLC | 0 | -100.00 | 0 | |||||
| 2025-08-13 | 13F | Cerity Partners LLC | 20,190 | 0.00 | 412 | -4.85 | ||||
| 2025-08-05 | 13F | NewSquare Capital LLC | 700 | 0.00 | 14 | -6.67 | ||||
| 2025-05-09 | 13F | GeoWealth Management, LLC | 0 | -100.00 | 0 | |||||
| 2025-08-14 | 13F | Federation des caisses Desjardins du Quebec | 5,180 | 0.00 | 106 | -5.41 | ||||
| 2025-04-09 | 13F | St Germain D J Co Inc | 0 | -100.00 | 0 | -100.00 | ||||
| 2025-08-14 | 13F | Bank Of America Corp /de/ | 5,851,586 | -5.39 | 119,431 | -10.06 | ||||
| 2025-05-06 | 13F | JPL Wealth Management, LLC | 162,810 | 3,362 | ||||||
| 2025-09-04 | 13F/A | Advisor Group Holdings, Inc. | 194,114 | -2.06 | 3,962 | -6.91 | ||||
| 2025-08-06 | 13F | Prospera Financial Services Inc | 39,873 | 6.58 | 814 | 1.25 | ||||
| 2025-07-23 | 13F | 1 North Wealth Services Llc | 125 | 0.00 | 3 | 0.00 | ||||
| 2025-07-29 | 13F | Creekside Partners | 12,394 | -17.36 | 253 | -21.74 | ||||
| 2025-07-15 | 13F | Capital Investment Advisors, LLC | 0 | -100.00 | 0 | |||||
| 2025-07-28 | 13F | Fairman Group, LLC | 641 | 0.00 | 13 | 0.00 | ||||
| 2025-08-14 | 13F | Aft, Forsyth & Company, Inc. | 34,432 | -0.17 | 703 | -5.14 | ||||
| 2025-08-12 | 13F | CIBC Private Wealth Group, LLC | 30,317 | 13.21 | 619 | 23.60 | ||||
| 2025-07-29 | 13F | Private Trust Co Na | 4,099 | -3.55 | 84 | -8.79 | ||||
| 2025-08-07 | 13F | Evoke Wealth, Llc | 171,360 | 0.00 | 3,497 | -4.95 | ||||
| 2025-05-09 | 13F | Pathway Financial Advisers, LLC | 0 | -100.00 | 0 | |||||
| 2025-07-31 | 13F | City State Bank | 20,914 | 0.00 | 427 | -5.12 | ||||
| 2025-08-13 | 13F | Colonial Trust Co / SC | 21,297 | 35.62 | 435 | 29.94 | ||||
| 2025-05-07 | 13F | Foundations Investment Advisors, LLC | 0 | -100.00 | 0 | |||||
| 2025-07-24 | 13F | Aurora Private Wealth, Inc. | 0 | -100.00 | 0 | |||||
| 2025-07-23 | 13F | Sax Wealth Advisors, Llc | 14,500 | 0.00 | 296 | -5.14 | ||||
| 2025-07-29 | 13F | BKM Wealth Management, LLC | 26,799 | -1.34 | 547 | -6.35 | ||||
| 2025-07-08 | 13F | Nbc Securities, Inc. | 3,424 | -18.26 | 0 | |||||
| 2025-07-16 | 13F | Strategic Investment Solutions, Inc. /IL | 300 | 6 | ||||||
| 2025-08-08 | 13F | Compass Financial Services Inc | 12,496 | 0.30 | 255 | -4.49 | ||||
| 2025-08-07 | 13F | PFG Advisors | 34,049 | -4.65 | 695 | -9.40 | ||||
| 2025-08-12 | 13F | Virtu Financial LLC | 54,553 | 1 | ||||||
| 2025-07-18 | 13F | Dogwood Wealth Management LLC | 113 | 1.80 | 2 | 0.00 | ||||
| 2025-08-06 | 13F | SOUTH STATE Corp | 21,986 | 7.45 | 449 | 2.05 | ||||
| 2025-08-12 | 13F | Jpmorgan Chase & Co | 14,031 | -2.35 | 286 | -7.14 | ||||
| 2025-08-14 | 13F | UBS Group AG | 309,523 | -0.08 | 6,317 | -5.01 | ||||
| 2025-08-08 | 13F | Pnc Financial Services Group, Inc. | 12,822 | 0.06 | 262 | -5.09 | ||||
| 2025-07-18 | 13F | SOA Wealth Advisors, LLC. | 1,431 | 1.27 | 29 | -3.33 | ||||
| 2025-08-04 | 13F | Kovack Advisors, Inc. | 10,472 | 214 | ||||||
| 2025-07-15 | 13F | Axis Wealth Partners, LLC | 66,248 | -4.46 | 1,352 | -9.14 | ||||
| 2025-08-12 | 13F | Integrated Advisors Network LLC | 36,744 | -30.50 | 750 | -34.01 | ||||
| 2025-07-22 | 13F | Apexium Financial, Lp | 76,756 | -22.96 | 1,567 | -26.79 | ||||
| 2025-08-14 | 13F | CoreCap Advisors, LLC | 290 | 0.00 | 6 | -16.67 | ||||
| 2025-07-07 | 13F | Bangor Savings Bank | 4,811 | 0.00 | 98 | -4.85 | ||||
| 2025-08-11 | 13F | Cornerstone Planning Group LLC | 9,514 | -6.62 | 197 | -1.50 | ||||
| 2025-07-17 | 13F | Sound Income Strategies, LLC | 671 | 0.30 | 14 | -7.14 | ||||
| 2025-08-04 | 13F | Atria Investments Llc | 34,405 | -67.14 | 702 | -68.76 | ||||
| 2025-08-05 | 13F | Carolinas Wealth Consulting Llc | 0 | -100.00 | 0 | -100.00 | ||||
| 2025-08-14 | 13F | Warren Averett Asset Management, LLC | 362,277 | -4.54 | 7,394 | -9.25 | ||||
| 2025-07-29 | 13F | Novare Capital Management Llc | 10,835 | 0.00 | 221 | -4.74 | ||||
| 2025-08-14 | 13F | Sunbelt Securities, Inc. | 198 | -63.74 | 4 | -63.64 | ||||
| 2025-08-13 | 13F | Jones Financial Companies Lllp | 210,194 | 14.30 | 4,290 | 9.58 | ||||
| 2025-08-12 | 13F | New Republic Capital, LLC | 5,566 | 0.00 | 114 | -5.04 | ||||
| 2025-07-29 | 13F | Signature Estate & Investment Advisors Llc | 46,818 | -5.17 | 956 | -9.82 | ||||
| 2025-04-29 | 13F | Element Wealth, LLC | 0 | -100.00 | 0 | |||||
| 2025-08-14 | 13F | EP Wealth Advisors, Inc. | 6,896 | 32.72 | 141 | 26.13 | ||||
| 2025-08-08 | 13F | Avantax Advisory Services, Inc. | 57,895 | -14.23 | 1,182 | -18.50 | ||||
| 2025-08-12 | 13F | NWF Advisory Services Inc. | 32,359 | 1.42 | 695 | 2.36 | ||||
| 2025-07-25 | 13F | Atria Wealth Solutions, Inc. | 0 | -100.00 | 0 | |||||
| 2025-08-14 | 13F | IHT Wealth Management, LLC | 48,033 | -35.47 | 980 | -38.67 | ||||
| 2025-08-01 | 13F | Capital Investment Counsel, LLC | 13,490 | -9.17 | 275 | -13.52 | ||||
| 2025-08-18 | 13F | Geneos Wealth Management Inc. | 2,502 | 0.00 | 51 | -3.77 | ||||
| 2025-07-10 | 13F | Focus Financial Network, Inc. | 11,448 | 234 | ||||||
| 2025-07-14 | 13F | Hoey Investments, Inc | 500 | -30.65 | 10 | -33.33 | ||||
| 2025-07-15 | 13F | Mather Group, Llc. | 11,496 | 0.00 | 235 | -4.88 | ||||
| 2025-07-25 | 13F | Johnson Investment Counsel Inc | 52,175 | 0.00 | 1,065 | -5.00 | ||||
| 2025-08-11 | 13F | HighTower Advisors, LLC | 0 | -100.00 | 0 | |||||
| 2025-08-13 | 13F | Quadrature Capital Ltd | 0 | -100.00 | 0 | |||||
| 2025-08-11 | 13F | Mindset Wealth Management, Llc | 14,545 | 0.00 | 297 | -5.13 | ||||
| 2025-08-07 | 13F | Addison Advisors LLC | 610 | -18.67 | 12 | -25.00 | ||||
| 2025-08-08 | 13F | Capital Investment Advisory Services, LLC | 15,729 | 0.03 | 321 | -4.75 | ||||
| 2025-07-10 | 13F | Wealth Enhancement Advisory Services, Llc | 35,888 | -4.56 | 764 | -5.45 | ||||
| 2025-07-07 | 13F | Investors Research Corp | 326,848 | 6.91 | 6,671 | 1.63 | ||||
| 2025-08-14 | 13F | Snowden Capital Advisors LLC | 12,014 | 0.00 | 245 | -4.67 | ||||
| 2025-07-24 | 13F | Advanced Asset Management Advisors Inc | 1,880 | 0.00 | 38 | -5.00 | ||||
| 2025-08-14 | 13F | Bnp Paribas Arbitrage, Sa | 4 | -88.89 | 0 | |||||
| 2025-08-06 | 13F | AE Wealth Management LLC | 11,939 | 59.95 | 244 | 51.88 | ||||
| 2025-08-04 | 13F | Assetmark, Inc | 175 | 4 | ||||||
| 2025-07-31 | 13F | Opus Capital Group, LLC | 9,920 | 0.00 | 0 | |||||
| 2025-07-10 | 13F | Wedmont Private Capital | 15,303 | 0.00 | 327 | 10.51 | ||||
| 2025-07-18 | 13F | Truist Financial Corp | 17,123 | 0.25 | 349 | -4.64 | ||||
| 2025-04-22 | 13F | Atticus Wealth Management, Llc | 0 | 0 | ||||||
| 2025-08-08 | 13F | Family Firm, Inc. | 10,536 | 0.00 | 215 | -4.87 | ||||
| 2025-08-14 | 13F | RMB Capital Management, LLC | 24,451 | 0.00 | 499 | -4.77 | ||||
| 2025-07-15 | 13F | Armis Advisers, LLC | 55,470 | 36.86 | 1,182 | 47.07 | ||||
| 2025-08-14 | 13F | Oxford Financial Group Ltd | 34,514 | -9.45 | 704 | -13.94 | ||||
| 2025-07-31 | 13F | GLOBALT Investments LLC / GA | 32,839 | -9.74 | 670 | -14.21 | ||||
| 2025-08-13 | 13F | Cresset Asset Management, LLC | 46,750 | 0.00 | 954 | -4.89 | ||||
| 2025-07-15 | 13F | Fortitude Family Office, LLC | 1,400 | 0.00 | 29 | -6.67 | ||||
| 2025-08-12 | 13F | Steward Partners Investment Advisory, Llc | 23,657 | 0.42 | 483 | -4.55 | ||||
| 2025-08-12 | 13F | Clearwater Capital Advisors, LLC | 11,597 | -3.08 | 237 | -7.81 | ||||
| 2025-08-14 | 13F | Qube Research & Technologies Ltd | 234 | 0.00 | 5 | -20.00 | ||||
| 2025-08-08 | 13F | SageOak Financial, LLC | 0 | -100.00 | 0 | |||||
| 2025-07-11 | 13F | First PREMIER Bank | 38,540 | -3.38 | 1 | |||||
| 2025-07-22 | 13F | Financial Insights, Inc. | 14,100 | 0.00 | 288 | -4.97 | ||||
| 2025-08-11 | 13F | Private Advisor Group, LLC | 79,833 | -2.80 | 1,629 | -7.60 | ||||
| 2025-08-13 | 13F | Millstone Evans Group, LLC | 1,519 | 0.00 | 31 | -3.12 | ||||
| 2025-08-18 | 13F | Tyler-Stone Wealth Management | 0 | -100.00 | 0 | |||||
| 2025-04-25 | 13F | New Wave Wealth Advisors Llc | 0 | -100.00 | 0 | |||||
| 2025-07-17 | 13F | Wagner Wealth Management, Llc | 1,893 | 1.23 | 39 | -5.00 | ||||
| 2025-07-31 | 13F | Cambridge Investment Research Advisors, Inc. | 112,294 | -0.82 | 2 | 0.00 | ||||
| 2025-07-29 | 13F | International Assets Investment Management, Llc | 24,923 | 12.18 | 509 | 6.72 | ||||
| 2025-07-21 | 13F | Crews Bank & Trust | 4,690 | -34.77 | 96 | -38.31 | ||||
| 2025-08-12 | 13F | AlphaCore Capital LLC | 151,335 | -18.80 | 3,089 | -22.82 | ||||
| 2025-08-13 | 13F | First Trust Advisors Lp | 12,732 | 260 | ||||||
| 2025-07-23 | 13F | Nbt Bank N A /ny | 1,142 | 0.00 | 23 | -4.17 | ||||
| 2025-07-14 | 13F | Sowell Financial Services LLC | 13,028 | 0.15 | 266 | -5.02 | ||||
| 2025-05-16 | 13F | Coppell Advisory Solutions LLC | 0 | -100.00 | 0 | |||||
| 2025-07-16 | 13F | Cresta Advisors, Ltd. | 114,411 | 10.87 | 2,335 | 5.42 | ||||
| 2025-08-14 | 13F | MGB Wealth Management, LLC | 52,499 | 0.00 | 1,072 | -4.88 | ||||
| 2025-08-07 | 13F | Resources Investment Advisors, LLC. | 105,749 | -2.32 | 2,158 | -7.14 | ||||
| 2025-07-08 | 13F | Parallel Advisors, LLC | 382 | 1.33 | 8 | -12.50 | ||||
| 2025-08-06 | 13F | Commonwealth Equity Services, Llc | 182,843 | -4.16 | 4 | -25.00 | ||||
| 2025-08-15 | 13F | Tower Research Capital LLC (TRC) | 28,505 | -12.32 | 582 | -16.64 | ||||
| 2025-04-30 | 13F | Axxcess Wealth Management, Llc | 0 | -100.00 | 0 | |||||
| 2025-07-10 | 13F | Kozak & Associates, Inc. | 9,085 | 1.23 | 194 | 9.66 | ||||
| 2025-08-11 | 13F | Lowe Brockenbrough & Co Inc | 512 | 10 | ||||||
| 2025-08-08 | 13F | Creative Planning | 28,150 | 0.87 | 575 | -4.17 | ||||
| 2025-08-14 | 13F | GWM Advisors LLC | 44,634 | 0.40 | 911 | -4.61 | ||||
| 2025-08-14 | 13F | Wells Fargo & Company/mn | 1,288,902 | 0.16 | 26,306 | -4.78 | ||||
| 2025-07-18 | 13F | Institute for Wealth Management, LLC. | 25,156 | 0.00 | 513 | -5.00 | ||||
| 2025-07-07 | 13F | Good Steward Wealth Advisors,LLC | 104,939 | 200.13 | 2,142 | 185.47 | ||||
| 2025-07-21 | 13F | Barrett & Company, Inc. | 39,744 | 0.29 | 811 | -4.59 | ||||
| 2025-08-08 | 13F | Wealth Alliance | 86,953 | 5.01 | 1,775 | -0.17 | ||||
| 2025-07-31 | 13F | CVA Family Office, LLC | 798 | 0.00 | 16 | -5.88 | ||||
| 2025-08-14 | 13F | Citadel Advisors Llc | 11,940 | 244 | ||||||
| 2025-07-29 | 13F | Chicago Partners Investment Group LLC | 12,570 | 0.79 | 271 | 8.87 | ||||
| 2025-07-31 | 13F | Richards, Merrill & Peterson, Inc. | 1,463 | 0.00 | 30 | -6.45 | ||||
| 2025-08-05 | 13F | Key FInancial Inc | 249 | -50.79 | 5 | -50.00 | ||||
| 2025-08-14 | 13F | Ameriprise Financial Inc | 223,032 | -3.27 | 4,561 | -7.88 | ||||
| 2025-08-05 | 13F | Bank Of Montreal /can/ | 1,682 | 0.00 | 34 | -5.56 | ||||
| 2025-08-14 | 13F | Citadel Advisors Llc | Call | 54,400 | 23.92 | 1,110 | 17.83 | |||
| 2025-04-15 | 13F | Noble Wealth Management PBC | 316 | 0.00 | 7 | 0.00 | ||||
| 2025-08-12 | 13F | Global Retirement Partners, LLC | 11,808 | 36.90 | 241 | 31.15 | ||||
| 2025-08-14 | 13F | Benjamin Edwards Inc | 45,597 | -5.14 | 931 | -9.88 | ||||
| 2025-07-29 | 13F | Salomon & Ludwin, LLC | 219,659 | -3.04 | 4,661 | -4.17 | ||||
| 2025-08-12 | 13F | SRS Capital Advisors, Inc. | 8,943 | 183 | ||||||
| 2025-08-05 | 13F | GPS Wealth Strategies Group, LLC | 2,375 | 0.00 | 48 | -4.00 | ||||
| 2025-07-15 | 13F | Fifth Third Bancorp | 1,634 | 0.00 | 33 | -5.71 | ||||
| 2025-08-14 | 13F/A | Rockefeller Capital Management L.P. | 10,393 | -5.86 | 212 | -10.55 | ||||
| 2025-07-25 | 13F | Cwm, Llc | 19,090 | 0.02 | 0 | |||||
| 2025-07-31 | 13F | Brinker Capital Investments, LLC | 0 | -100.00 | 0 | -100.00 | ||||
| 2025-08-11 | 13F | United Capital Financial Advisers, Llc | 155,744 | -11.46 | 3,179 | -15.84 | ||||
| 2025-05-08 | 13F | IFG Advisory, LLC | 0 | -100.00 | 0 | |||||
| 2025-07-30 | 13F | LGT Financial Advisors LLC | 1,000 | 0.00 | 20 | -4.76 | ||||
| 2025-08-07 | 13F | Allworth Financial LP | 813 | 15.65 | 17 | 14.29 | ||||
| 2025-07-17 | 13F | Vermillion Wealth Management, Inc. | 369 | 0.00 | 8 | 0.00 | ||||
| 2025-07-28 | 13F | RFG Advisory, LLC | 0 | -100.00 | 0 | |||||
| 2025-08-14 | 13F | Mariner, LLC | 41,524 | 210.41 | 848 | 195.12 | ||||
| 2025-08-14 | 13F | Royal Bank Of Canada | 233,522 | 18.72 | 4,766 | 12.86 | ||||
| 2025-08-08 | 13F | Larson Financial Group LLC | 1,000 | 0.00 | 20 | -4.76 | ||||
| 2025-08-05 | 13F | Lifeworks Advisors, LLC | 12,180 | -39.24 | 249 | -42.33 | ||||
| 2025-08-14 | 13F | Synovus Financial Corp | 11,628 | 4.83 | 237 | -0.42 | ||||
| 2025-08-13 | 13F | Alerus Financial Na | 337 | 7 | ||||||
| 2025-07-18 | 13F | Consolidated Portfolio Review Corp | 17,819 | 0.10 | 364 | -4.97 | ||||
| 2025-08-04 | 13F | Spire Wealth Management | 215 | -89.36 | 4 | -90.70 | ||||
| 2025-08-14 | 13F | Fmr Llc | 19,954 | -6.57 | 407 | -11.14 | ||||
| 2025-08-15 | 13F | Captrust Financial Advisors | 84,466 | 8.21 | 1,724 | 2.87 | ||||
| 2025-04-30 | 13F | Synergy Investment Management, LLC | 0 | -100.00 | 0 | |||||
| 2025-08-13 | 13F | Beacon Pointe Advisors, LLC | 59,479 | -0.98 | 1,214 | -5.90 | ||||
| 2025-07-25 | 13F | Sovereign Financial Group, Inc. | 20,586 | 14.68 | 420 | 9.09 | ||||
| 2025-07-28 | 13F | Harbour Investments, Inc. | 26,243 | -22.66 | 536 | -26.51 | ||||
| 2025-08-12 | 13F | LPL Financial LLC | 1,929,218 | -0.65 | 39,375 | -5.55 | ||||
| 2025-07-30 | 13F | Cullen/frost Bankers, Inc. | 5,418 | 1.23 | 111 | -3.51 | ||||
| 2025-08-12 | 13F | MAI Capital Management | 1,681 | 0.00 | 34 | -5.56 | ||||
| 2025-08-14 | 13F | Hurley Capital, LLC | 2,000 | 41 | ||||||
| 2025-08-14 | 13F | Mercer Global Advisors Inc /adv | 11,707 | -2.07 | 239 | -7.03 | ||||
| 2025-07-25 | 13F | LRI Investments, LLC | 1 | 0.00 | 0 | |||||
| 2025-08-08 | 13F | Meridian Wealth Management, LLC | 19,718 | -8.72 | 402 | -13.17 | ||||
| 2025-07-24 | 13F | Us Bancorp \de\ | 120 | -79.45 | 2 | -83.33 | ||||
| 2025-08-07 | 13F | Kestra Private Wealth Services, Llc | 16,526 | -28.19 | 337 | -31.78 | ||||
| 2025-07-17 | 13F | Janney Montgomery Scott LLC | 57,835 | -3.26 | 1 | 0.00 | ||||
| 2025-07-16 | 13F | New Insight Wealth Advisors | 140,618 | -17.38 | 2,870 | -21.43 | ||||
| 2025-07-24 | 13F | Capital Advisors, Ltd. LLC | 182,322 | -3.23 | 4 | -25.00 | ||||
| 2025-08-14 | 13F | Two Sigma Investments, Lp | 76,600 | -55.31 | 1,563 | -57.52 | ||||
| 2025-08-15 | 13F | Morgan Stanley | 2,539,270 | -0.27 | 51,827 | -5.20 | ||||
| 2025-08-19 | 13F | National Asset Management, Inc. | 11,585 | -44.56 | 236 | -46.85 | ||||
| 2025-08-05 | 13F | Simplex Trading, Llc | 1,875 | 0 | ||||||
| 2025-07-29 | 13F | Stratos Wealth Partners, LTD. | 11,812 | -47.40 | 241 | -50.00 | ||||
| 2025-07-15 | 13F | Revisor Wealth Management LLC | 15,960 | 0.00 | 343 | 0.29 | ||||
| 2025-07-14 | 13F | AdvisorNet Financial, Inc | 198,020 | 82.90 | 4,042 | 73.88 | ||||
| 2025-07-09 | 13F | David J Yvars Group | 11,800 | 0.00 | 241 | -4.38 | ||||
| 2025-08-14 | 13F | Raymond James Financial Inc | 651,911 | 1.48 | 13,306 | -3.52 | ||||
| 2025-07-18 | 13F | QTR Family Wealth, LLC | 15,166 | 0.00 | 310 | -4.92 | ||||
| 2025-08-14 | 13F | Mml Investors Services, Llc | 67,607 | 1.17 | 1 | 0.00 | ||||
| 2025-08-01 | 13F | Brookwood Investment Group LLC | 11,523 | -1.05 | 235 | -6.00 | ||||
| 2025-08-14 | 13F | Stifel Financial Corp | 73,601 | 22.46 | 1,502 | 16.43 |