Mga Batayang Estadistika
| Pemilik Institusional | 114 total, 114 long only, 0 short only, 0 long/short - change of -1.72% MRQ |
| Alokasi Portofolio Rata-rata | 0.0621 % - change of -10.07% MRQ |
| Saham Institusional (Jangka Panjang) | 6,163,643 (ex 13D/G) - change of 0.14MM shares 2.33% MRQ |
| Nilai Institusional (Jangka Panjang) | $ 287,368 USD ($1000) |
Kepemilikan Institusional dan Pemegang Saham
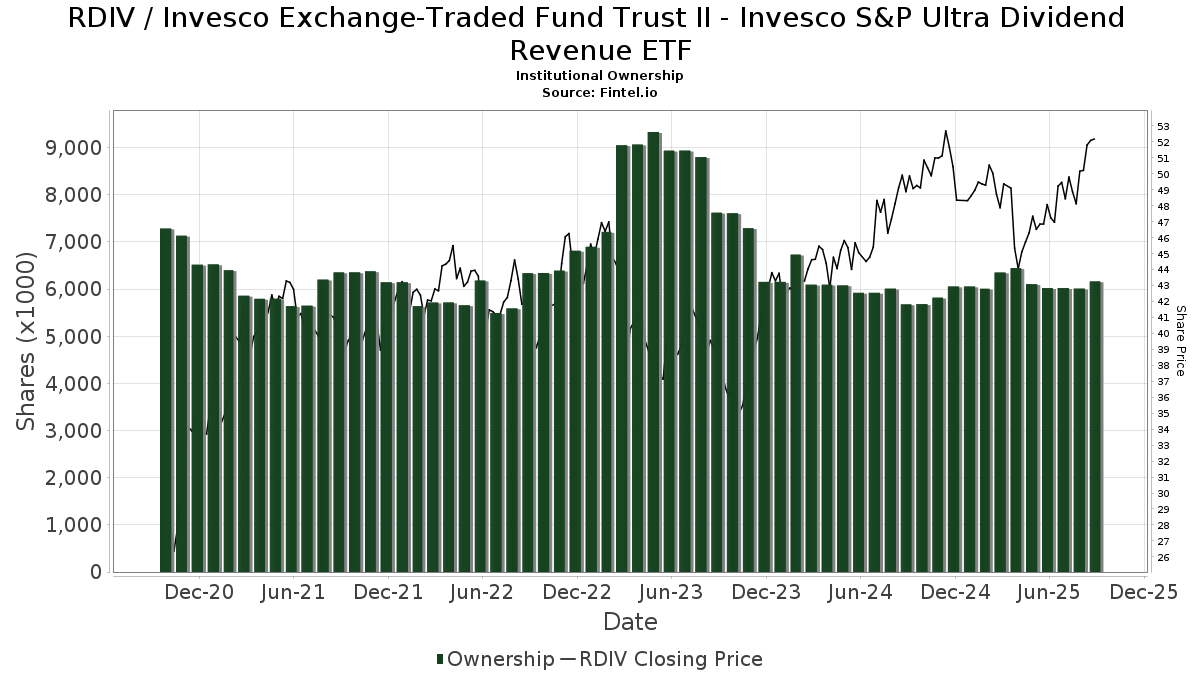
Invesco Exchange-Traded Fund Trust II - Invesco S&P Ultra Dividend Revenue ETF (US:RDIV) memiliki 114 pemilik institusional dan pemegang saham yang telah mengajukan formulir 13D/G atau 13F kepada Komisi Bursa Efek (Securities Exchange Commission/SEC). Lembaga-lembaga ini memegang total 6,163,643 saham. Pemegang saham terbesar meliputi Morgan Stanley, Heartwood Wealth Advisors LLC, LPL Financial LLC, Bank Of America Corp /de/, Wells Fargo & Company/mn, Stifel Financial Corp, Ameriprise Financial Inc, Advisor Group Holdings, Inc., Raymond James Financial Inc, and Northwestern Mutual Wealth Management Co .
Struktur kepemilikan institusional Invesco Exchange-Traded Fund Trust II - Invesco S&P Ultra Dividend Revenue ETF (ARCA:RDIV) menunjukkan posisi terkini di perusahaan oleh institusi dan dana, serta perubahan terbaru dalam ukuran posisi. Pemegang saham utama dapat mencakup investor individu, reksa dana, dana lindung nilai, atau institusi. Jadwal 13D menunjukkan bahwa investor memegang (atau pernah memegang) lebih dari 5% saham perusahaan dan bermaksud (atau pernah bermaksud) untuk secara aktif mengejar perubahan strategi bisnis. Jadwal 13G menunjukkan investasi pasif lebih dari 5%.
The share price as of September 5, 2025 is 52.38 / share. Previously, on September 9, 2024, the share price was 49.38 / share. This represents an increase of 6.08% over that period.
Skor Sentimen Dana
Skor Sentimen Dana (sebelumnya dikenal sebagai Skor Akumulasi Kepemilikan) menemukan saham-saham yang paling banyak dibeli oleh dana. Ini adalah hasil dari model kuantitatif multi-faktor yang canggih yang mengidentifikasi perusahaan dengan tingkat akumulasi institusional tertinggi. Model penilaian menggunakan kombinasi dari total peningkatan pemilik yang diungkapkan, perubahan dalam alokasi portofolio pada pemilik tersebut, dan metrik lainnya. Angka berkisar dari 0 hingga 100, dengan angka yang lebih tinggi menunjukkan tingkat akumulasi yang lebih tinggi dibandingkan dengan perusahaan sejenisnya, dan 50 adalah rata-ratanya.
Frekuensi Pembaruan: Setiap Hari
Lihat Ownership Explorer, yang menyediakan daftar perusahaan dengan peringkat tertinggi.
Rasio Put/Call Institusional
Selain melaporkan isu ekuitas dan utang standar, institusi dengan aset di bawah manajemen lebih dari 100 juta dolar AS juga harus mengungkapkan kepemilikan opsi put dan call mereka. Karena opsi put umumnya menunjukkan sentimen negatif, dan opsi call menunjukkan sentimen positif, kita dapat mengetahui sentimen institusional secara keseluruhan dengan memplot rasio put terhadap call. Grafik di sebelah kanan memplot rasio put/call historis untuk instrumen ini.
Menggunakan Rasio Put/Call sebagai indikator sentimen investor mengatasi salah satu kekurangan utama dari penggunaan total kepemilikan institusional, yaitu sejumlah besar aset yang dikelola diinvestasikan secara pasif untuk melacak indeks. Dana yang dikelola secara pasif biasanya tidak membeli opsi, sehingga indikator rasio put/call lebih akurat dalam melacak sentimen dana yang dikelola secara aktif.
Pengajuan 13F dan NPORT
Detail pada pengajuan 13F tersedia gratis. Detail pada pengajuan NP memerlukan keanggotaan premium. Baris berwarna hijau menunjukkan posisi baru. Baris berwarna merah menunjukkan posisi yang sudah ditutup. Klik tautan ini ikon untuk melihat riwayat transaksi selengkapnya.
Tingkatkan
untuk membuka data premium dan mengekspor ke Excel ![]() .
.
| Tanggal File | Sumber | Investor | Ketik | Presyo ng Avg (Silangan) |
Saham | Δ Saham (%) |
Dilaporkan Nilai ($1000) |
Nilai Δ (%) |
Alokasi Port (%) |
|
|---|---|---|---|---|---|---|---|---|---|---|
| 2025-08-06 | 13F | Prospera Financial Services Inc | 5,197 | 249 | ||||||
| 2025-07-17 | 13F | Janney Montgomery Scott LLC | 30,735 | 1.22 | 1 | 0.00 | ||||
| 2025-08-14 | 13F/A | Rockefeller Capital Management L.P. | 120,528 | 8.31 | 5,767 | 6.17 | ||||
| 2025-07-18 | 13F | SOA Wealth Advisors, LLC. | 353 | 1.15 | 17 | -5.88 | ||||
| 2025-08-14 | 13F/A | Skopos Labs, Inc. | 143 | 7 | ||||||
| 2025-08-14 | 13F | Wiley Bros.-aintree Capital, Llc | 39,594 | 0.46 | 1,895 | -0.37 | ||||
| 2025-08-06 | 13F | Commonwealth Equity Services, Llc | 75,579 | 3.88 | 4 | 0.00 | ||||
| 2025-08-14 | 13F | GWM Advisors LLC | 28,302 | 0.18 | 1,354 | -1.81 | ||||
| 2025-04-30 | 13F | Arcadia Investment Management Corp/mi | 0 | -100.00 | 0 | |||||
| 2025-08-14 | 13F | Herold Advisors, Inc. | 12,634 | 2.59 | 605 | 0.50 | ||||
| 2025-05-15 | 13F | D. E. Shaw & Co., Inc. | 0 | -100.00 | 0 | |||||
| 2025-08-04 | 13F | Flagship Harbor Advisors, Llc | 8,401 | -0.05 | 402 | -1.95 | ||||
| 2025-07-10 | 13F | Wealth Enhancement Advisory Services, Llc | 101,929 | -11.80 | 5,036 | -10.74 | ||||
| 2025-08-08 | 13F | Capital Investment Advisory Services, LLC | 2,031 | 0.00 | 97 | -2.02 | ||||
| 2025-07-18 | 13F | Truist Financial Corp | 32,411 | -19.47 | 1,551 | -21.08 | ||||
| 2025-08-15 | 13F | Tower Research Capital LLC (TRC) | 3,339 | 1,666.67 | 160 | 1,666.67 | ||||
| 2025-07-21 | 13F | Ameritas Advisory Services, LLC | 221 | 11 | ||||||
| 2025-08-14 | 13F | Raymond James Financial Inc | 170,858 | -23.18 | 8,176 | -24.71 | ||||
| 2025-08-12 | 13F | Proequities, Inc. | 0 | 0 | ||||||
| 2025-07-28 | 13F | Harbour Investments, Inc. | 342 | -14.71 | 16 | -15.79 | ||||
| 2025-08-07 | 13F | Kestra Private Wealth Services, Llc | 6,745 | 323 | ||||||
| 2025-08-08 | 13F | Cetera Investment Advisers | 33,843 | -13.09 | 1,619 | -14.83 | ||||
| 2025-08-14 | 13F | Mml Investors Services, Llc | 24,955 | -17.88 | 1 | 0.00 | ||||
| 2025-07-30 | 13F | Prosperity Financial Group, Inc. | 9,585 | 39.22 | 459 | 36.31 | ||||
| 2025-08-13 | 13F | EverSource Wealth Advisors, LLC | 1,290 | 0.00 | 62 | -1.61 | ||||
| 2025-08-07 | 13F | Allworth Financial LP | 51,756 | 0.32 | 2,477 | 4.69 | ||||
| 2025-08-14 | 13F | BancorpSouth Bank | 87,435 | -1.58 | 4,184 | -3.53 | ||||
| 2025-08-13 | 13F | Gateway Wealth Partners, LLC | 24,078 | 5.46 | 1,152 | 3.41 | ||||
| 2025-07-08 | 13F | Heartwood Wealth Advisors LLC | 711,039 | 1.15 | 34,023 | -0.86 | ||||
| 2025-08-11 | 13F | Perennial Investment Advisors, LLC | 7,084 | 3.37 | 339 | 1.20 | ||||
| 2025-07-23 | 13F | Kingswood Wealth Advisors, Llc | 22,866 | 0.00 | 1,094 | -1.97 | ||||
| 2025-08-18 | 13F | Geneos Wealth Management Inc. | 5,156 | -5.72 | 247 | -7.87 | ||||
| 2025-08-04 | 13F | Hantz Financial Services, Inc. | 143 | 0 | ||||||
| 2025-05-13 | 13F | Bokf, Na | 0 | -100.00 | 0 | -100.00 | ||||
| 2025-08-11 | 13F | Elite Financial, Inc. | 5,169 | 0.78 | 0 | |||||
| 2025-08-14 | 13F | Money Concepts Capital Corp | 7,669 | 11.06 | 367 | 8.61 | ||||
| 2025-08-15 | 13F | Kestra Advisory Services, LLC | 11,199 | -4.39 | 536 | -6.30 | ||||
| 2025-08-14 | 13F | Comerica Bank | 7,838 | 0.26 | 375 | -1.57 | ||||
| 2025-07-21 | 13F | Future Financial Wealth Managment LLC | 135 | 1.50 | 6 | 0.00 | ||||
| 2025-07-29 | 13F | International Assets Investment Management, Llc | 9,374 | 1.59 | 449 | -0.44 | ||||
| 2025-08-15 | 13F | Captrust Financial Advisors | 16,663 | -10.56 | 797 | -12.32 | ||||
| 2025-07-30 | 13F | Onyx Bridge Wealth Group LLC | 59,129 | -3.42 | 2,829 | -5.32 | ||||
| 2025-07-21 | 13F | Crews Bank & Trust | 2,250 | 0.00 | 108 | -1.83 | ||||
| 2025-08-14 | 13F | Mission Creek Capital Partners, Inc. | 5,341 | 0.00 | 256 | -1.92 | ||||
| 2025-08-14 | 13F | Royal Bank Of Canada | 44,894 | -14.20 | 2,148 | -15.90 | ||||
| 2025-08-04 | 13F | Integrity Alliance, Llc. | 16,704 | 236.10 | 799 | 230.17 | ||||
| 2025-08-11 | 13F | Wealthspire Advisors, LLC | 38,796 | 0.00 | 1,856 | -2.01 | ||||
| 2025-07-31 | 13F | Whipplewood Advisors, LLC | 0 | -100.00 | 0 | |||||
| 2025-08-12 | 13F | Jpmorgan Chase & Co | 57,153 | 0.95 | 2,735 | -1.09 | ||||
| 2025-08-13 | 13F | Capital Analysts, Inc. | 404 | 0.00 | 0 | |||||
| 2025-07-24 | 13F | IFP Advisors, Inc | 6,665 | 12,968.63 | 319 | 15,800.00 | ||||
| 2025-08-13 | 13F | Summit Financial, LLC | 6,578 | 8.91 | 315 | 6.80 | ||||
| 2025-08-06 | 13F | AE Wealth Management LLC | 41,302 | -2.22 | 1,976 | -4.17 | ||||
| 2025-08-04 | 13F | Assetmark, Inc | 0 | -100.00 | 0 | |||||
| 2025-08-08 | 13F | Tanglewood Legacy Advisors, LLC | 6,390 | -0.67 | 306 | -2.87 | ||||
| 2025-08-12 | 13F | Steward Partners Investment Advisory, Llc | 6,886 | 177.33 | 329 | 171.90 | ||||
| 2025-08-12 | 13F | J.w. Cole Advisors, Inc. | 43,674 | 1.49 | 2,090 | -0.52 | ||||
| 2025-08-06 | 13F | Atlas Legacy Advisors, LLC | 7,388 | -0.50 | 354 | -2.49 | ||||
| 2025-08-14 | 13F | Snowden Capital Advisors LLC | 4,809 | -9.49 | 230 | -11.20 | ||||
| 2025-04-16 | 13F | Hoey Investments, Inc | 0 | -100.00 | 0 | |||||
| 2025-04-14 | 13F | Patriot Financial Group Insurance Agency, LLC | 0 | -100.00 | 0 | -100.00 | ||||
| 2025-08-08 | 13F | Creative Planning | 4,980 | -9.16 | 238 | -10.86 | ||||
| 2025-08-19 | 13F | Cape Investment Advisory, Inc. | 2,285 | -9.86 | 109 | -11.38 | ||||
| 2025-08-13 | 13F/A | StoneX Group Inc. | 0 | -100.00 | 0 | -100.00 | ||||
| 2025-07-28 | 13F | Mutual Advisors, LLC | 8,370 | 416 | ||||||
| 2025-07-31 | 13F | Sage Mountain Advisors LLC | 573 | 0.00 | 27 | 0.00 | ||||
| 2025-08-14 | 13F | Goldman Sachs Group Inc | 16,131 | -46.13 | 772 | -47.23 | ||||
| 2025-08-12 | 13F | LPL Financial LLC | 582,399 | 12.65 | 27,868 | 10.41 | ||||
| 2025-07-16 | 13F | ORG Partners LLC | 0 | -100.00 | 0 | |||||
| 2025-08-12 | 13F | Global Retirement Partners, LLC | 100 | 0.00 | 5 | 0.00 | ||||
| 2025-05-13 | 13F | Bridgewealth Advisory Group, LLC | 0 | -100.00 | 0 | |||||
| 2025-08-14 | 13F | Mercer Global Advisors Inc /adv | 34,550 | -3.88 | 1,653 | -5.76 | ||||
| 2025-07-14 | 13F | Golden State Equity Partners | 61,077 | 2.21 | 2,923 | 0.17 | ||||
| 2025-08-13 | 13F | WCG Wealth Advisors LLC | 25,287 | 1.01 | 1,210 | -1.06 | ||||
| 2025-08-14 | 13F | Wells Fargo & Company/mn | 340,466 | 4.65 | 16,291 | 2.57 | ||||
| 2025-07-25 | 13F | Concurrent Investment Advisors, LLC | 14,516 | 695 | ||||||
| 2025-08-05 | 13F | Tsfg, Llc | 1,055 | 0.00 | 0 | |||||
| 2025-08-14 | 13F | Citadel Advisors Llc | 0 | -100.00 | 0 | |||||
| 2025-07-29 | 13F | Stratos Wealth Partners, LTD. | 17,790 | -7.37 | 851 | -9.18 | ||||
| 2025-08-08 | 13F | Pnc Financial Services Group, Inc. | 1,096 | 0.00 | 52 | -1.89 | ||||
| 2025-08-12 | 13F | SRS Capital Advisors, Inc. | 376 | 1.08 | 18 | -5.56 | ||||
| 2025-07-08 | 13F | Rise Advisors, LLC | 3,110 | 0.81 | 149 | -1.33 | ||||
| 2025-07-11 | 13F | Farther Finance Advisors, LLC | 135 | 6 | ||||||
| 2025-08-11 | 13F | Citigroup Inc | 1,000 | 0.00 | 48 | -2.08 | ||||
| 2025-08-12 | 13F | CIBC Private Wealth Group, LLC | 13,534 | 0.00 | 648 | 12.72 | ||||
| 2025-08-13 | 13F | Northwestern Mutual Wealth Management Co | 161,039 | -14.72 | 7,706 | -16.42 | ||||
| 2025-08-15 | 13F | Morgan Stanley | 1,048,296 | 2.29 | 50,161 | 0.26 | ||||
| 2025-08-13 | 13F | Jones Financial Companies Lllp | 55,961 | 43.76 | 2,667 | 41.96 | ||||
| 2025-07-29 | 13F | Stephens Inc /ar/ | 15,000 | 0.00 | 718 | -2.05 | ||||
| 2025-08-14 | 13F | Susquehanna International Group, Llp | 0 | -100.00 | 0 | |||||
| 2025-08-13 | 13F | Colonial Trust Advisors | 850 | 0.00 | 41 | -2.44 | ||||
| 2025-08-14 | 13F | Bank Of America Corp /de/ | 550,790 | 1.88 | 26,355 | -0.14 | ||||
| 2025-08-14 | 13F | Stifel Financial Corp | 253,000 | 611.93 | 12,106 | 598.15 | ||||
| 2025-08-11 | 13F | Principal Securities, Inc. | 300 | 50.00 | 14 | 55.56 | ||||
| 2025-08-04 | 13F | IFG Advisory, LLC | 10,317 | -0.40 | 494 | -2.38 | ||||
| 2025-04-29 | 13F | Callan Capital, LLC | 0 | -100.00 | 0 | |||||
| 2025-07-07 | 13F | First Community Trust Na | 1,100 | 0.00 | 53 | -1.89 | ||||
| 2025-07-31 | 13F | Cambridge Investment Research Advisors, Inc. | 13,122 | 9.26 | 1 | |||||
| 2025-07-07 | 13F | Thurston, Springer, Miller, Herd & Titak, Inc. | 725 | 0.00 | 35 | -2.86 | ||||
| 2025-08-08 | 13F | ProVise Management Group, LLC | 4,784 | -3.65 | 229 | -5.79 | ||||
| 2025-05-13 | 13F | Bank Of Montreal /can/ | 0 | -100.00 | 0 | |||||
| 2025-07-21 | 13F | Ashton Thomas Securities, Llc | 15,101 | 0.19 | 723 | -1.77 | ||||
| 2025-08-12 | 13F | Running Point Capital Advisors, LLC | 144 | 1.41 | 7 | 0.00 | ||||
| 2025-05-12 | 13F | Independent Advisor Alliance | 0 | -100.00 | 0 | |||||
| 2025-09-04 | 13F/A | Advisor Group Holdings, Inc. | 174,013 | 0.25 | 8,328 | -1.73 | ||||
| 2025-08-05 | 13F | Lifeworks Advisors, LLC | 0 | -100.00 | 0 | |||||
| 2025-08-14 | 13F | Ameriprise Financial Inc | 218,614 | 11.38 | 10,454 | 9.12 | ||||
| 2025-08-05 | 13F | Carson Advisory Inc. | 5,100 | 0.00 | 244 | -1.61 | ||||
| 2025-08-13 | 13F | Providence Capital Advisors, LLC | 133 | 6 | ||||||
| 2025-08-13 | 13F | Rsm Us Wealth Management Llc | 0 | -100.00 | 0 | |||||
| 2025-08-01 | 13F | Envestnet Asset Management Inc | 32,075 | -27.44 | 1,535 | -28.92 | ||||
| 2025-08-11 | 13F | HighTower Advisors, LLC | 74,950 | -21.38 | 3,586 | -22.93 | ||||
| 2025-08-14 | 13F | Fmr Llc | 2,145 | -22.67 | 103 | -24.44 | ||||
| 2025-07-15 | 13F | North Star Investment Management Corp. | 500 | 0.00 | 24 | -4.17 | ||||
| 2025-08-08 | 13F | Intrua Financial, LLC | 14,522 | 1.83 | 695 | -0.29 | ||||
| 2025-08-19 | 13F | Anchor Investment Management, LLC | 570 | 0.00 | 27 | 0.00 | ||||
| 2025-08-19 | 13F | Newbridge Financial Services Group, Inc. | 2,050 | 0.00 | 98 | -2.00 | ||||
| 2025-05-15 | 13F | Ameriflex Group, Inc. | 0 | -100.00 | 0 | |||||
| 2025-07-24 | 13F | Aurora Private Wealth, Inc. | 6,991 | 1.00 | 0 | |||||
| 2025-08-11 | 13F | Private Advisor Group, LLC | 133,579 | -35.10 | 6,392 | -36.39 | ||||
| 2025-07-25 | 13F | Cwm, Llc | 2,108 | 27.14 | 0 | |||||
| 2025-08-06 | 13F | Soltis Investment Advisors LLC | 0 | -100.00 | 0 | |||||
| 2025-07-25 | 13F | Atria Wealth Solutions, Inc. | 0 | -100.00 | 0 | |||||
| 2025-07-29 | 13F | Private Trust Co Na | 2,565 | 4.27 | 123 | 1.67 | ||||
| 2025-04-21 | 13F | Beacon Capital Management, LLC | 0 | -100.00 | 0 | |||||
| 2025-07-25 | 13F | Envestnet Portfolio Solutions, Inc. | 5,266 | -29.62 | 252 | -31.23 | ||||
| 2025-08-26 | 13F/A | Thrivent Financial For Lutherans | 0 | -100.00 | 0 | |||||
| 2025-07-22 | 13F | Simplicity Wealth,LLC | 30,066 | 200.00 | 1,439 | 194.07 | ||||
| 2025-04-29 | 13F | Byrne Financial Freedom, Llc | 0 | -100.00 | 0 | |||||
| 2025-08-14 | 13F | UBS Group AG | 85,350 | -4.88 | 4,084 | -6.78 | ||||
| 2025-08-01 | 13F | Rossby Financial, LCC | 225 | 0.00 | 11 | 0.00 | ||||
| 2025-07-30 | 13F | Bogart Wealth, LLC | 288 | 0.00 | 14 | -7.14 | ||||
| 2025-07-21 | 13F | Qrg Capital Management, Inc. | 9,458 | 453 | ||||||
| 2025-08-15 | 13F | Equitable Holdings, Inc. | 27,106 | 0.67 | 1,297 | -1.29 | ||||
| 2025-08-13 | 13F | Colonial Trust Co / SC | 300 | 0.00 | 14 | 0.00 | ||||
| 2025-08-08 | 13F | Avantax Advisory Services, Inc. | 44,181 | -8.21 | 2,114 | -10.00 | ||||
| 2025-08-08 | 13F | Gts Securities Llc | 7,047 | 18.46 | 337 | 16.21 | ||||
| 2025-08-05 | 13F | GPS Wealth Strategies Group, LLC | 100 | -33.33 | 5 | -42.86 |