Mga Batayang Estadistika
| Pemilik Institusional | 127 total, 127 long only, 0 short only, 0 long/short - change of -3.76% MRQ |
| Alokasi Portofolio Rata-rata | 0.1079 % - change of 0.12% MRQ |
| Saham Institusional (Jangka Panjang) | 5,349,766 (ex 13D/G) - change of -0.17MM shares -3.16% MRQ |
| Nilai Institusional (Jangka Panjang) | $ 333,298 USD ($1000) |
Kepemilikan Institusional dan Pemegang Saham
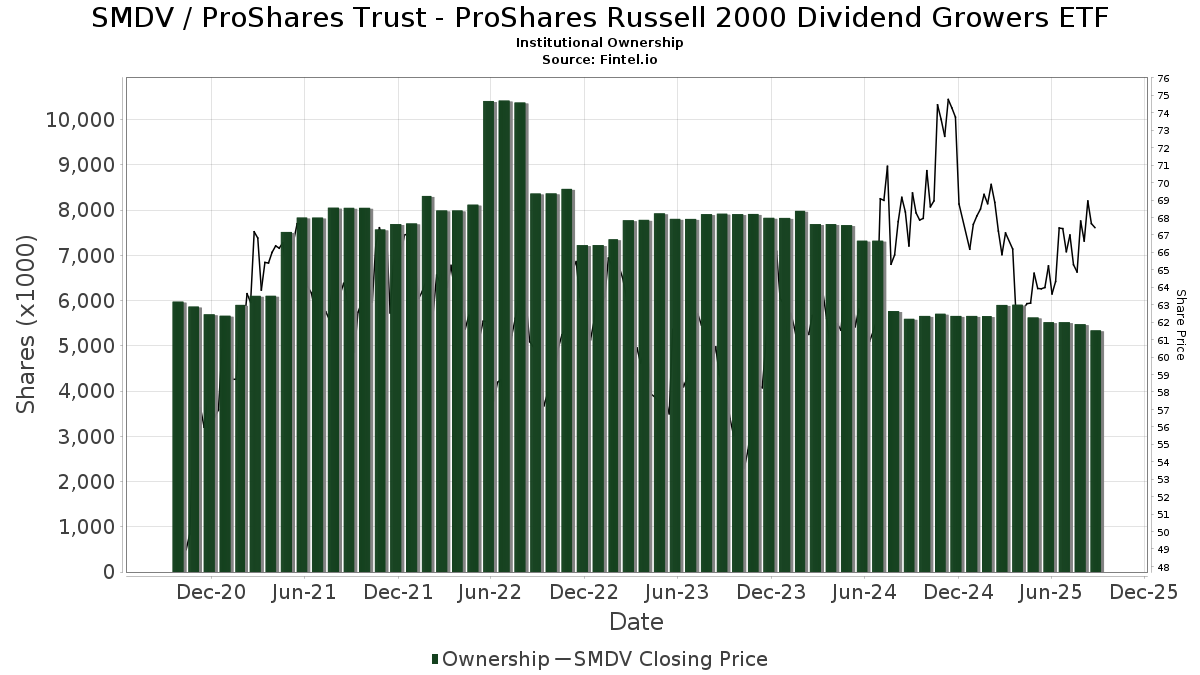
ProShares Trust - ProShares Russell 2000 Dividend Growers ETF (US:SMDV) memiliki 127 pemilik institusional dan pemegang saham yang telah mengajukan formulir 13D/G atau 13F kepada Komisi Bursa Efek (Securities Exchange Commission/SEC). Lembaga-lembaga ini memegang total 5,349,766 saham. Pemegang saham terbesar meliputi Morgan Stanley, Capital Investment Advisors, LLC, UBS Group AG, Wells Fargo & Company/mn, Raymond James Financial Inc, Bank Of America Corp /de/, LPL Financial LLC, Royal Bank Of Canada, Toth Financial Advisory Corp, and Wiley Bros.-aintree Capital, Llc .
Struktur kepemilikan institusional ProShares Trust - ProShares Russell 2000 Dividend Growers ETF (BATS:SMDV) menunjukkan posisi terkini di perusahaan oleh institusi dan dana, serta perubahan terbaru dalam ukuran posisi. Pemegang saham utama dapat mencakup investor individu, reksa dana, dana lindung nilai, atau institusi. Jadwal 13D menunjukkan bahwa investor memegang (atau pernah memegang) lebih dari 5% saham perusahaan dan bermaksud (atau pernah bermaksud) untuk secara aktif mengejar perubahan strategi bisnis. Jadwal 13G menunjukkan investasi pasif lebih dari 5%.
The share price as of September 3, 2025 is 67.65 / share. Previously, on September 4, 2024, the share price was 68.32 / share. This represents a decline of 0.98% over that period.
Skor Sentimen Dana
Skor Sentimen Dana (sebelumnya dikenal sebagai Skor Akumulasi Kepemilikan) menemukan saham-saham yang paling banyak dibeli oleh dana. Ini adalah hasil dari model kuantitatif multi-faktor yang canggih yang mengidentifikasi perusahaan dengan tingkat akumulasi institusional tertinggi. Model penilaian menggunakan kombinasi dari total peningkatan pemilik yang diungkapkan, perubahan dalam alokasi portofolio pada pemilik tersebut, dan metrik lainnya. Angka berkisar dari 0 hingga 100, dengan angka yang lebih tinggi menunjukkan tingkat akumulasi yang lebih tinggi dibandingkan dengan perusahaan sejenisnya, dan 50 adalah rata-ratanya.
Frekuensi Pembaruan: Setiap Hari
Lihat Ownership Explorer, yang menyediakan daftar perusahaan dengan peringkat tertinggi.
Rasio Put/Call Institusional
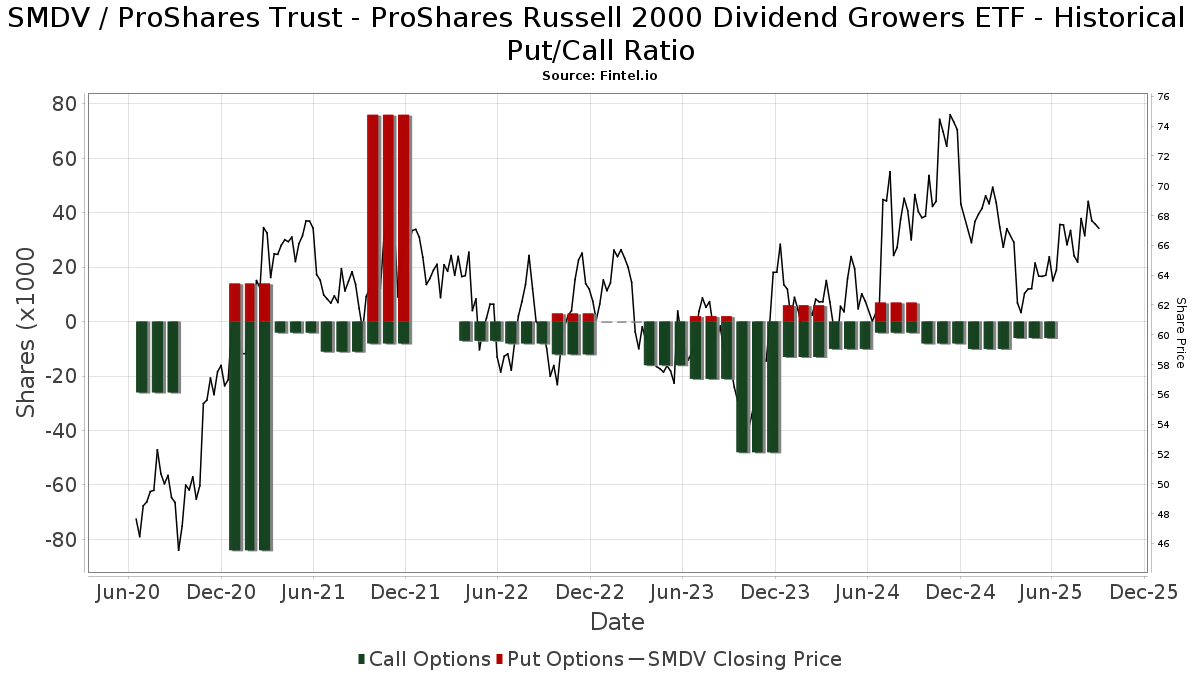
Selain melaporkan isu ekuitas dan utang standar, institusi dengan aset di bawah manajemen lebih dari 100 juta dolar AS juga harus mengungkapkan kepemilikan opsi put dan call mereka. Karena opsi put umumnya menunjukkan sentimen negatif, dan opsi call menunjukkan sentimen positif, kita dapat mengetahui sentimen institusional secara keseluruhan dengan memplot rasio put terhadap call. Grafik di sebelah kanan memplot rasio put/call historis untuk instrumen ini.
Menggunakan Rasio Put/Call sebagai indikator sentimen investor mengatasi salah satu kekurangan utama dari penggunaan total kepemilikan institusional, yaitu sejumlah besar aset yang dikelola diinvestasikan secara pasif untuk melacak indeks. Dana yang dikelola secara pasif biasanya tidak membeli opsi, sehingga indikator rasio put/call lebih akurat dalam melacak sentimen dana yang dikelola secara aktif.
Pengajuan 13F dan NPORT
Detail pada pengajuan 13F tersedia gratis. Detail pada pengajuan NP memerlukan keanggotaan premium. Baris berwarna hijau menunjukkan posisi baru. Baris berwarna merah menunjukkan posisi yang sudah ditutup. Klik tautan ini ikon untuk melihat riwayat transaksi selengkapnya.
Tingkatkan
untuk membuka data premium dan mengekspor ke Excel ![]() .
.
| Tanggal File | Sumber | Investor | Ketik | Presyo ng Avg (Silangan) |
Saham | Δ Saham (%) |
Dilaporkan Nilai ($1000) |
Nilai Δ (%) |
Alokasi Port (%) |
|
|---|---|---|---|---|---|---|---|---|---|---|
| 2025-08-12 | 13F | Howe & Rusling Inc | 2,721 | 7.72 | 177 | 7.27 | ||||
| 2025-08-13 | 13F | Baird Financial Group, Inc. | 125,218 | 0.34 | 8,147 | -0.48 | ||||
| 2025-08-14 | 13F | Susquehanna International Group, Llp | 9,206 | 122.80 | 599 | 120.66 | ||||
| 2025-08-14 | 13F | Susquehanna International Group, Llp | Call | 6,700 | 8.06 | 436 | 7.14 | |||
| 2025-08-14 | 13F | Lazard Asset Management Llc | 1,250 | 0.00 | 0 | |||||
| 2025-05-06 | 13F | WT Wealth Management | 0 | -100.00 | 0 | |||||
| 2025-08-14 | 13F | Moneta Group Investment Advisors Llc | 3,227 | 0.00 | 210 | -0.95 | ||||
| 2025-07-22 | 13F | DAVENPORT & Co LLC | 3,826 | 0.00 | 249 | -0.80 | ||||
| 2025-08-14 | 13F | Harvest Investment Services, LLC | 14,383 | 2.51 | 936 | 1.63 | ||||
| 2025-08-12 | 13F | Jacobi Capital Management LLC | 28,411 | -0.78 | 1,848 | -1.60 | ||||
| 2025-08-18 | 13F | Geneos Wealth Management Inc. | 7,955 | 11.52 | 518 | 10.71 | ||||
| 2025-07-31 | 13F | Cambridge Investment Research Advisors, Inc. | 54,029 | -3.54 | 4 | 0.00 | ||||
| 2025-08-14 | 13F | GWM Advisors LLC | 5,415 | 8.02 | 352 | 7.32 | ||||
| 2025-05-12 | 13F | Benjamin Edwards Inc | 0 | -100.00 | 0 | |||||
| 2025-07-25 | 13F | Cwm, Llc | 154 | 0.00 | 0 | |||||
| 2025-08-12 | 13F | J.w. Cole Advisors, Inc. | 6,843 | 6.79 | 445 | 5.95 | ||||
| 2025-08-11 | 13F | HighTower Advisors, LLC | 5,121 | 3.41 | 333 | 2.78 | ||||
| 2025-08-12 | 13F | MAI Capital Management | 2,297 | -2.38 | 149 | -3.25 | ||||
| 2025-08-13 | 13F | Beacon Pointe Advisors, LLC | 10,011 | 0.00 | 651 | -0.76 | ||||
| 2025-07-10 | 13F | Wealth Enhancement Advisory Services, Llc | 5,786 | -2.84 | 392 | 0.51 | ||||
| 2025-08-14 | 13F | Citadel Advisors Llc | 9,850 | -35.24 | 641 | -35.81 | ||||
| 2025-05-06 | 13F | Pinnacle Associates Ltd | 0 | -100.00 | 0 | |||||
| 2025-08-11 | 13F | Citigroup Inc | 3,266 | -8.72 | 212 | -9.40 | ||||
| 2025-07-22 | 13F | Legacy Trust | 0 | -100.00 | 0 | |||||
| 2025-07-25 | 13F | Lion Street Advisors, LLC | 3,132 | 0.10 | 204 | -0.98 | ||||
| 2025-08-12 | 13F | Park Square Financial Group, LLC | 44 | 0.00 | 3 | 0.00 | ||||
| 2025-08-11 | 13F | Aptus Capital Advisors, LLC | 218 | 0.46 | 14 | 0.00 | ||||
| 2025-08-11 | 13F | Western Wealth Management, LLC | 4,185 | 0.29 | 272 | -0.37 | ||||
| 2025-07-10 | 13F | CWC Advisors, LLC. | 3,250 | 0.00 | 211 | -0.94 | ||||
| 2025-04-10 | 13F | Hennion & Walsh Asset Management, Inc. | 0 | -100.00 | 0 | -100.00 | ||||
| 2025-08-14 | 13F | Acorn Wealth Advisors, LLC | 5,099 | 1.39 | 332 | 0.61 | ||||
| 2025-08-06 | 13F | Round Rock Advisors, LLC | 4,275 | -0.02 | 278 | -0.71 | ||||
| 2025-08-06 | 13F | Wedbush Securities Inc | 14,370 | -3.34 | 1 | |||||
| 2025-08-11 | 13F | CFS Investment Advisory Services, LLC | 7,529 | 26.86 | 0 | |||||
| 2025-07-25 | 13F | Landmark Wealth Management, LLC | 47,835 | -0.12 | 3 | 0.00 | ||||
| 2025-07-09 | 13F | Dynamic Advisor Solutions LLC | 7,840 | 1.62 | 510 | 0.79 | ||||
| 2025-08-04 | 13F | Assetmark, Inc | 33 | 17.86 | 2 | 100.00 | ||||
| 2025-08-04 | 13F | Arkadios Wealth Advisors | 3,976 | -2.38 | 259 | -3.37 | ||||
| 2025-08-07 | 13F | Palisade Asset Management, LLC | 0 | -100.00 | 0 | |||||
| 2025-07-01 | 13F | Harbor Investment Advisory, Llc | 2,780 | 0.00 | 181 | -1.10 | ||||
| 2025-07-29 | 13F | Private Trust Co Na | 89 | 0.00 | 6 | 0.00 | ||||
| 2025-07-16 | 13F | Essex Financial Services, Inc. | 23,562 | -6.58 | 1,533 | -7.38 | ||||
| 2025-07-14 | 13F | Toth Financial Advisory Corp | 191,474 | -1.42 | 12,457 | -2.22 | ||||
| 2025-08-12 | 13F | Steward Partners Investment Advisory, Llc | 790 | 0.00 | 51 | 0.00 | ||||
| 2025-07-21 | 13F | Empirical Financial Services, LLC d.b.a. Empirical Wealth Management | 0 | -100.00 | 0 | |||||
| 2025-08-14 | 13F | Mercer Global Advisors Inc /adv | 13,807 | -3.07 | 898 | -3.85 | ||||
| 2025-08-14 | 13F | Raymond James Financial Inc | 293,006 | -3.04 | 19,063 | -3.82 | ||||
| 2025-08-08 | 13F | United Asset Strategies, Inc. | 16,220 | -6.63 | 1,055 | -7.37 | ||||
| 2025-07-25 | 13F | Total Clarity Wealth Management, Inc. | 6,640 | -1.98 | 432 | -5.90 | ||||
| 2025-05-15 | 13F | Citadel Advisors Llc | Put | 0 | -100.00 | 0 | -100.00 | |||
| 2025-07-10 | 13F | Oliver Lagore Vanvalin Investment Group | 0 | -100.00 | 0 | |||||
| 2025-07-11 | 13F | Caldwell Securities, Inc | 2,646 | 30.22 | 172 | 29.32 | ||||
| 2025-08-14 | 13F | Stifel Financial Corp | 47,410 | 1.07 | 3,085 | 0.26 | ||||
| 2025-07-24 | 13F | Blair William & Co/il | 5,946 | 0.00 | 387 | -0.77 | ||||
| 2025-08-08 | 13F | Cetera Investment Advisers | 87,490 | -2.03 | 5,692 | -2.82 | ||||
| 2025-07-07 | 13F | Wesbanco Bank Inc | 3,833 | -29.45 | 249 | -30.06 | ||||
| 2025-07-21 | 13F | Ameritas Advisory Services, LLC | 444 | 29 | ||||||
| 2025-08-14 | 13F | Warren Averett Asset Management, LLC | 3,662 | 0.00 | 238 | -0.83 | ||||
| 2025-08-13 | 13F | Northwestern Mutual Wealth Management Co | 15,449 | -33.06 | 1,005 | -33.58 | ||||
| 2025-05-09 | 13F | Pathway Financial Advisers, LLC | 0 | -100.00 | 0 | |||||
| 2025-07-24 | 13F | Us Bancorp \de\ | 1,000 | 150.00 | 65 | 150.00 | ||||
| 2025-07-22 | 13F | Kraematon Investment Advisors, Inc | 5,222 | -2.72 | 340 | -3.69 | ||||
| 2025-08-04 | 13F | Northwest Financial Advisors | 10,695 | -11.10 | 696 | -11.91 | ||||
| 2025-08-19 | 13F | National Asset Management, Inc. | 4,819 | -8.00 | 314 | -11.58 | ||||
| 2025-08-04 | 13F | L.m. Kohn & Company | 9,789 | 13.63 | 637 | 12.57 | ||||
| 2025-08-13 | 13F | Jones Financial Companies Lllp | 11,760 | 34.72 | 768 | 34.27 | ||||
| 2025-05-08 | 13F | Endeavor Private Wealth, Inc. | 0 | -100.00 | 0 | |||||
| 2025-08-14 | 13F | Ameriprise Financial Inc | 44,356 | 72.82 | 2,886 | 71.42 | ||||
| 2025-07-15 | 13F | Bay Capital Advisors, LLC | 4,400 | 0.00 | 286 | -0.69 | ||||
| 2025-08-14 | 13F | Two Sigma Investments, Lp | 29,900 | -5.97 | 1,945 | -6.71 | ||||
| 2025-08-12 | 13F | MWA Asset Management | 4,081 | -26.88 | 265 | -27.60 | ||||
| 2025-08-04 | 13F | Pensionmark Financial Group, Llc | 7,952 | 0.00 | 517 | -0.77 | ||||
| 2025-07-28 | 13F | BRYN MAWR TRUST Co | 368 | -33.57 | 24 | -36.11 | ||||
| 2025-08-12 | 13F | Franklin Resources Inc | 735 | 48 | ||||||
| 2025-07-30 | 13F | Parcion Private Wealth LLC | 24,893 | 0.00 | 1,620 | -0.80 | ||||
| 2025-07-18 | 13F | Trilogy Capital Inc. | 0 | -100.00 | 0 | |||||
| 2025-08-14 | 13F | UBS Group AG | 377,984 | -15.42 | 24,592 | -16.10 | ||||
| 2025-07-23 | 13F | Trueblood Wealth Management, LLC | 15,481 | 0.00 | 1,007 | -0.79 | ||||
| 2025-08-12 | 13F | Proequities, Inc. | 0 | 0 | ||||||
| 2025-08-14 | 13F | CoreCap Advisors, LLC | 75 | -10.71 | 5 | -20.00 | ||||
| 2025-08-07 | 13F | Addison Advisors LLC | 50 | 0.00 | 3 | 0.00 | ||||
| 2025-08-14 | 13F | Royal Capital Wealth Management, LLC | 12,423 | 0.11 | 808 | -0.62 | ||||
| 2025-08-14 | 13F | Comerica Bank | 9,671 | -0.51 | 629 | -1.26 | ||||
| 2025-08-05 | 13F | Key FInancial Inc | 549 | 0.00 | 36 | -2.78 | ||||
| 2025-08-11 | 13F | Nations Financial Group Inc, /ia/ /adv | 15,189 | -1.43 | 988 | -2.18 | ||||
| 2025-07-30 | 13F | FNY Investment Advisers, LLC | 200 | 0 | ||||||
| 2025-08-13 | 13F | Smith, Moore & Co. | 55,164 | 3.31 | 3,589 | 2.46 | ||||
| 2025-08-12 | 13F | Nemes Rush Group LLC | 0 | -100.00 | 0 | |||||
| 2025-08-07 | 13F | Cascade Financial Partners, LLC | 11,693 | 0.00 | 761 | -0.78 | ||||
| 2025-07-18 | 13F | PFG Investments, LLC | 17,259 | -26.11 | 1,123 | -26.76 | ||||
| 2025-08-11 | 13F | Principal Securities, Inc. | 481 | 54.17 | 31 | 47.62 | ||||
| 2025-08-14 | 13F | Jane Street Group, Llc | 4,196 | 273 | ||||||
| 2025-07-08 | 13F | Arlington Trust Co LLC | 140,033 | -3.24 | 9,111 | -4.02 | ||||
| 2025-08-13 | 13F | Colonial Trust Co / SC | 43 | 0.00 | 3 | 0.00 | ||||
| 2025-07-28 | 13F | Harbour Investments, Inc. | 2,243 | 2,143.00 | 146 | 2,316.67 | ||||
| 2025-08-14 | 13F | Citadel Advisors Llc | Call | 0 | -100.00 | 0 | ||||
| 2025-07-14 | 13F | Lewis Asset Management, LLC | 6,835 | -15.01 | 445 | -15.75 | ||||
| 2025-07-24 | 13F | Capital Advisors, Ltd. LLC | 4,943 | 8.26 | 0 | |||||
| 2025-05-05 | 13F | IFP Advisors, Inc | 0 | -100.00 | 0 | |||||
| 2025-08-14 | 13F | Royal Bank Of Canada | 198,490 | -10.73 | 12,914 | -11.44 | ||||
| 2025-08-14 | 13F | Qube Research & Technologies Ltd | 257 | -55.84 | 17 | -57.89 | ||||
| 2025-08-14 | 13F | Wells Fargo & Company/mn | 348,652 | -17.15 | 22,683 | -17.82 | ||||
| 2025-08-15 | 13F | Tower Research Capital LLC (TRC) | 1,319 | -85.17 | 86 | -85.42 | ||||
| 2025-08-14 | 13F | Financial Advisory Service, Inc. | 712 | -54.24 | 46 | -54.90 | ||||
| 2025-08-06 | 13F | Paladin Advisory Group, LLC | 101 | 0.00 | 7 | 0.00 | ||||
| 2025-08-11 | 13F | United Advisor Group, LLC | 48,451 | -0.18 | 3,152 | -0.97 | ||||
| 2025-05-13 | 13F | Bank Of Montreal /can/ | 0 | -100.00 | 0 | |||||
| 2025-07-30 | 13F/A | KPP Advisory Services LLC | 3,682 | -0.46 | 240 | -1.24 | ||||
| 2025-08-05 | 13F | GPS Wealth Strategies Group, LLC | 2,201 | 0.05 | 143 | -0.69 | ||||
| 2025-08-11 | 13F | Synergy Investment Management, LLC | 0 | -100.00 | 0 | |||||
| 2025-08-11 | 13F | Annis Gardner Whiting Capital Advisors, LLC | 344 | 23 | ||||||
| 2025-08-08 | 13F | Avantax Advisory Services, Inc. | 4,402 | 3.58 | 286 | 2.88 | ||||
| 2025-08-15 | 13F | Morgan Stanley | 1,090,179 | -3.83 | 70,927 | -4.61 | ||||
| 2025-05-14 | 13F | Huntington National Bank | 12 | |||||||
| 2025-08-01 | 13F | Envestnet Asset Management Inc | 72,998 | 33.06 | 4,749 | 31.99 | ||||
| 2025-07-09 | 13F | Key Client Fiduciary Advisors, LLC | 5,917 | 0.00 | 385 | -1.03 | ||||
| 2025-07-08 | 13F | Atlas Brown,Inc. | 5,817 | -0.70 | 378 | -1.56 | ||||
| 2025-08-04 | 13F | Spire Wealth Management | 107 | 0.94 | 7 | 0.00 | ||||
| 2025-05-13 | 13F | Capstone Wealth Management Group LLC | 0 | -100.00 | 0 | |||||
| 2025-07-17 | 13F/A | Capital Investment Advisors, LLC | 419,959 | 0.41 | 27,323 | -0.40 | ||||
| 2025-07-17 | 13F | Janney Montgomery Scott LLC | 3,592 | 1.41 | 0 | |||||
| 2025-08-12 | 13F | CIBC Private Wealth Group, LLC | 272 | 0.00 | 18 | 6.25 | ||||
| 2025-08-07 | 13F | New England Private Wealth Advisors LLC | 30,078 | 1,964 | ||||||
| 2025-07-08 | 13F | Nbc Securities, Inc. | 100 | 0.00 | 0 | |||||
| 2025-08-19 | 13F | Anchor Investment Management, LLC | 1,520 | -8.82 | 99 | -10.09 | ||||
| 2025-07-18 | 13F | Truist Financial Corp | 116,781 | 1.65 | 7,598 | 0.82 | ||||
| 2025-08-14 | 13F | Wiley Bros.-aintree Capital, Llc | 156,160 | 28.41 | 10,161 | 27.51 | ||||
| 2025-08-14 | 13F | IHT Wealth Management, LLC | 3,464 | 0.12 | 225 | -0.44 | ||||
| 2025-08-11 | 13F | Private Advisor Group, LLC | 8,488 | 7.63 | 552 | 6.77 | ||||
| 2025-05-15 | 13F | Two Sigma Securities, Llc | 0 | -100.00 | 0 | -100.00 | ||||
| 2025-08-14 | 13F | Fmr Llc | 1,878 | -13.26 | 122 | -13.48 | ||||
| 2025-08-12 | 13F | Global Retirement Partners, LLC | 245 | 60.13 | 16 | 50.00 | ||||
| 2025-07-17 | 13F | Jackson, Grant Investment Advisers, Inc. | 3,455 | 0.06 | 225 | -0.88 | ||||
| 2025-04-16 | 13F | Crowley Wealth Management, Inc. | 0 | -100.00 | 0 | |||||
| 2025-08-04 | 13F | Integrity Alliance, Llc. | 0 | -100.00 | 0 | |||||
| 2025-08-04 | 13F | Creative Financial Designs Inc /adv | 8,347 | 0.01 | 543 | -0.73 | ||||
| 2025-04-08 | 13F | Parallel Advisors, LLC | 0 | -100.00 | 0 | |||||
| 2025-08-13 | 13F | Advisor Group Holdings, Inc. | 39,332 | 12.40 | 2,665 | 15.93 | ||||
| 2025-07-23 | 13F | Ameliora Wealth Management Ltd. | 500 | 0.00 | 33 | 0.00 | ||||
| 2025-08-12 | 13F | LPL Financial LLC | 274,509 | 4.29 | 17,860 | 3.45 | ||||
| 2025-08-08 | 13F | Pnc Financial Services Group, Inc. | 573 | -9.62 | 37 | -9.76 | ||||
| 2025-08-14 | 13F | Heritage Wealth Management, Inc. | 3,972 | -10.18 | 258 | -11.03 | ||||
| 2025-08-15 | 13F | Equitable Holdings, Inc. | 19,246 | -0.67 | 1,252 | -1.42 | ||||
| 2025-04-28 | 13F | Mainstream Capital Management LLC | 0 | -100.00 | 0 | |||||
| 2025-08-11 | 13F | HHM Wealth Advisors, LLC | 0 | -100.00 | 0 | |||||
| 2025-07-28 | 13F | ForthRight Wealth Management, LLC | 85,395 | 24.56 | 5,556 | 23.55 | ||||
| 2025-07-29 | 13F | Creekside Partners | 5,485 | -1.83 | 357 | -2.73 | ||||
| 2025-08-06 | 13F | Commonwealth Equity Services, Llc | 94,117 | 0.38 | 6 | 0.00 | ||||
| 2025-08-14 | 13F | Bank Of America Corp /de/ | 279,956 | -1.02 | 18,214 | -1.83 | ||||
| 2025-07-17 | 13F | Park Place Capital Corp | 29 | 0.00 | 2 | 0.00 | ||||
| 2025-08-12 | 13F | Jpmorgan Chase & Co | 2,724 | -66.31 | 177 | -66.60 | ||||
| 2025-08-14 | 13F | Goldman Sachs Group Inc | 35,312 | 58.64 | 2,297 | 57.44 | ||||
| 2025-08-11 | 13F | Wbi Investments, Inc. | 16,584 | 1.74 | 1,079 | 0.84 | ||||
| 2025-04-25 | 13F | Koshinski Asset Management, Inc. | 0 | -100.00 | 0 | |||||
| 2025-08-01 | 13F | Belvedere Trading LLC | Call | 0 | -100.00 | 0 | ||||
| 2025-08-01 | 13F | Anson Capital, Inc. | 3,579 | 4.56 | 233 | 3.57 |