Mga Batayang Estadistika
| Pemilik Institusional | 218 total, 217 long only, 0 short only, 1 long/short - change of 14.74% MRQ |
| Alokasi Portofolio Rata-rata | 0.0718 % - change of -6.05% MRQ |
| Saham Institusional (Jangka Panjang) | 18,966,222 (ex 13D/G) - change of 1.00MM shares 5.54% MRQ |
| Nilai Institusional (Jangka Panjang) | $ 844,166 USD ($1000) |
Kepemilikan Institusional dan Pemegang Saham
Chunghwa Telecom Co., Ltd. - Depositary Receipt (Common Stock) (US:CHT) memiliki 218 pemilik institusional dan pemegang saham yang telah mengajukan formulir 13D/G atau 13F kepada Komisi Bursa Efek (Securities Exchange Commission/SEC). Lembaga-lembaga ini memegang total 18,966,222 saham. Pemegang saham terbesar meliputi Renaissance Technologies Llc, BlackRock, Inc., Vanguard Group Inc, Morgan Stanley, Connor, Clark & Lunn Investment Management Ltd., VEIEX - Vanguard Emerging Markets Stock Index Fund Investor Shares, Northern Trust Corp, Schroder Investment Management Group, Td Asset Management Inc, and Acadian Asset Management Llc .
Struktur kepemilikan institusional Chunghwa Telecom Co., Ltd. - Depositary Receipt (Common Stock) (NYSE:CHT) menunjukkan posisi terkini di perusahaan oleh institusi dan dana, serta perubahan terbaru dalam ukuran posisi. Pemegang saham utama dapat mencakup investor individu, reksa dana, dana lindung nilai, atau institusi. Jadwal 13D menunjukkan bahwa investor memegang (atau pernah memegang) lebih dari 5% saham perusahaan dan bermaksud (atau pernah bermaksud) untuk secara aktif mengejar perubahan strategi bisnis. Jadwal 13G menunjukkan investasi pasif lebih dari 5%.
The share price as of September 5, 2025 is 44.18 / share. Previously, on September 9, 2024, the share price was 38.75 / share. This represents an increase of 14.01% over that period.

Skor Sentimen Dana
Skor Sentimen Dana (sebelumnya dikenal sebagai Skor Akumulasi Kepemilikan) menemukan saham-saham yang paling banyak dibeli oleh dana. Ini adalah hasil dari model kuantitatif multi-faktor yang canggih yang mengidentifikasi perusahaan dengan tingkat akumulasi institusional tertinggi. Model penilaian menggunakan kombinasi dari total peningkatan pemilik yang diungkapkan, perubahan dalam alokasi portofolio pada pemilik tersebut, dan metrik lainnya. Angka berkisar dari 0 hingga 100, dengan angka yang lebih tinggi menunjukkan tingkat akumulasi yang lebih tinggi dibandingkan dengan perusahaan sejenisnya, dan 50 adalah rata-ratanya.
Frekuensi Pembaruan: Setiap Hari
Lihat Ownership Explorer, yang menyediakan daftar perusahaan dengan peringkat tertinggi.
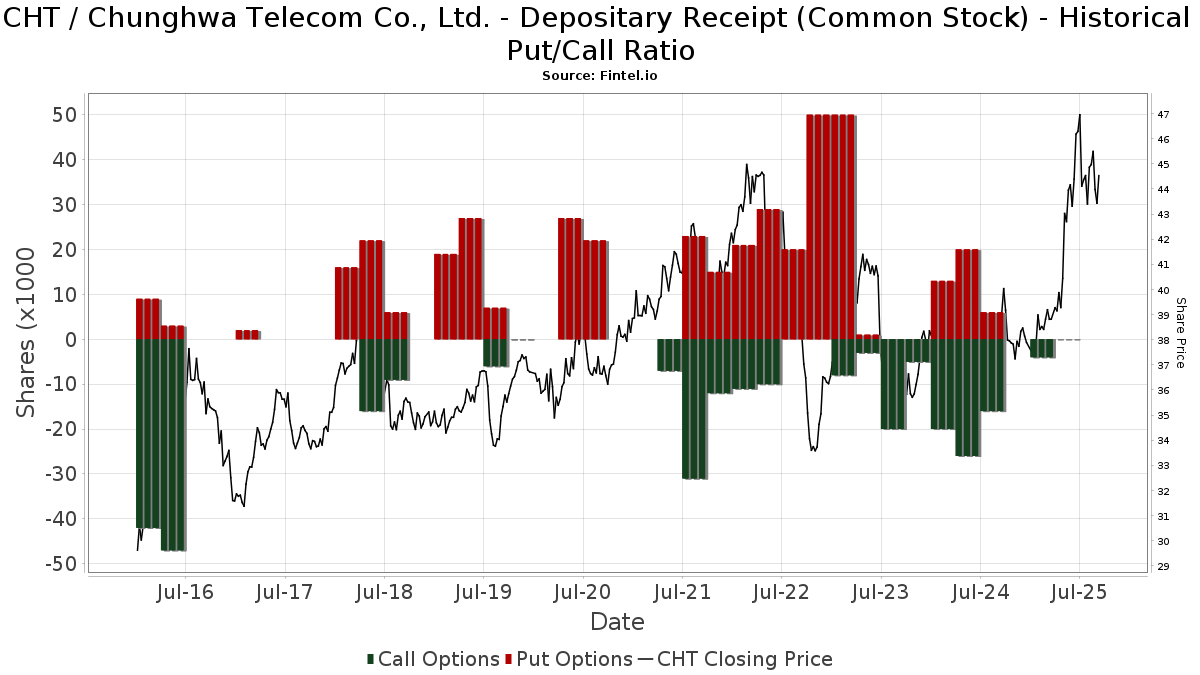
Rasio Put/Call Institusional
Selain melaporkan isu ekuitas dan utang standar, institusi dengan aset di bawah manajemen lebih dari 100 juta dolar AS juga harus mengungkapkan kepemilikan opsi put dan call mereka. Karena opsi put umumnya menunjukkan sentimen negatif, dan opsi call menunjukkan sentimen positif, kita dapat mengetahui sentimen institusional secara keseluruhan dengan memplot rasio put terhadap call. Grafik di sebelah kanan memplot rasio put/call historis untuk instrumen ini.
Menggunakan Rasio Put/Call sebagai indikator sentimen investor mengatasi salah satu kekurangan utama dari penggunaan total kepemilikan institusional, yaitu sejumlah besar aset yang dikelola diinvestasikan secara pasif untuk melacak indeks. Dana yang dikelola secara pasif biasanya tidak membeli opsi, sehingga indikator rasio put/call lebih akurat dalam melacak sentimen dana yang dikelola secara aktif.
Pengajuan 13F dan NPORT
Detail pada pengajuan 13F tersedia gratis. Detail pada pengajuan NP memerlukan keanggotaan premium. Baris berwarna hijau menunjukkan posisi baru. Baris berwarna merah menunjukkan posisi yang sudah ditutup. Klik tautan ini ikon untuk melihat riwayat transaksi selengkapnya.
Tingkatkan
untuk membuka data premium dan mengekspor ke Excel ![]() .
.
| Tanggal File | Sumber | Investor | Ketik | Presyo ng Avg (Silangan) |
Saham | Δ Saham (%) |
Dilaporkan Nilai ($1000) |
Nilai Δ (%) |
Alokasi Port (%) |
|
|---|---|---|---|---|---|---|---|---|---|---|
| 2025-07-29 | 13F | Private Trust Co Na | 25 | -68.35 | 1 | -66.67 | ||||
| 2025-06-30 | NP | VEU - Vanguard FTSE All-World ex-US Index Fund ETF Shares | 381,442 | 0.00 | 15,426 | 4.12 | ||||
| 2025-06-23 | NP | UUPIX - Ultraemerging Markets Profund Investor Class | 1,590 | 10.88 | 64 | 16.36 | ||||
| 2025-07-25 | 13F | Yousif Capital Management, Llc | 12,229 | 3.08 | 570 | 22.37 | ||||
| 2025-06-26 | NP | DFA INVESTMENT DIMENSIONS GROUP INC - World ex U.S. Core Equity Portfolio Institutional Class Shares | 3,400 | 0.00 | 137 | 3.79 | ||||
| 2025-08-26 | NP | Profunds - Profund Vp Emerging Markets | 6,484 | 9.27 | 302 | 30.17 | ||||
| 2025-07-29 | 13F | Hoese & Co LLP | 250 | 12 | ||||||
| 2025-07-28 | NP | AVXC - Avantis Emerging Markets ex-China Equity ETF | 5,393 | 4.17 | 234 | 16.42 | ||||
| 2025-08-12 | 13F | Rhumbline Advisers | 230,188 | -12.93 | 10,729 | 3.50 | ||||
| 2025-08-08 | 13F | Geode Capital Management, Llc | 0 | -100.00 | 0 | |||||
| 2025-06-26 | NP | DFAE - Dimensional Emerging Core Equity Market ETF | 88,000 | 6.02 | 3,559 | 10.39 | ||||
| 2025-06-26 | NP | TWAAX - Thrivent International Allocation Fund Class A | 1,302 | -40.60 | 53 | -38.82 | ||||
| 2025-08-05 | 13F | Key FInancial Inc | 227 | 0.00 | 11 | 25.00 | ||||
| 2025-08-14 | 13F | GWM Advisors LLC | 163 | -3.55 | 8 | 16.67 | ||||
| 2025-05-13 | 13F | Mondrian Investment Partners LTD | 201,153 | -15.00 | 7,887 | -14.19 | ||||
| 2025-08-07 | 13F | Resources Investment Advisors, LLC. | 7,767 | 0.26 | 362 | 19.47 | ||||
| 2025-08-08 | 13F | Creative Planning | 317,369 | 18.02 | 14,793 | 40.29 | ||||
| 2025-04-11 | 13F | First Affirmative Financial Network | 32,108 | 3.06 | 1,259 | 7.25 | ||||
| 2025-08-04 | 13F | Hantz Financial Services, Inc. | 840 | 1,083.10 | 0 | |||||
| 2025-07-25 | 13F | Sequoia Financial Advisors, LLC | 44,077 | 47.31 | 2,054 | 75.11 | ||||
| 2025-07-30 | 13F | Whittier Trust Co | 334 | 70.41 | 16 | 114.29 | ||||
| 2025-08-01 | 13F | Bessemer Group Inc | 11,515 | 0.88 | 1 | |||||
| 2025-08-07 | 13F | Profund Advisors Llc | 8,898 | 16.18 | 415 | 38.00 | ||||
| 2025-08-14 | 13F | Syon Capital Llc | 4,906 | 229 | ||||||
| 2025-08-13 | 13F | First Trust Advisors Lp | 22,371 | -2.68 | 1,043 | 15.65 | ||||
| 2025-08-13 | 13F | West Family Investments, Inc. | 47,872 | -0.29 | 2,231 | 18.54 | ||||
| 2025-07-18 | 13F | Robeco Institutional Asset Management B.V. | 136,807 | 0.00 | 6,377 | 18.87 | ||||
| 2025-06-26 | NP | DFEM - Dimensional Emerging Markets Core Equity 2 ETF | 38,188 | 0.00 | 1,544 | 4.11 | ||||
| 2025-08-11 | 13F | Morling Financial Advisors, LLC | 0 | -100.00 | 0 | |||||
| 2025-07-24 | 13F | Jfs Wealth Advisors, Llc | 267 | -30.65 | 12 | -20.00 | ||||
| 2025-07-30 | 13F | Whittier Trust Co Of Nevada Inc | 5,883 | -18.10 | 274 | -2.49 | ||||
| 2025-08-18 | 13F/A | National Bank Of Canada /fi/ | 210 | 388.37 | 10 | 800.00 | ||||
| 2025-07-29 | NP | RBB FUND, INC. - Aquarius International Fund | 4,171 | 0.00 | 181 | 11.73 | ||||
| 2025-07-14 | 13F | GAMMA Investing LLC | 9,530 | 85.19 | 444 | 120.90 | ||||
| 2025-05-08 | 13F | Waldron Private Wealth LLC | 0 | -100.00 | 0 | |||||
| 2025-08-13 | 13F | Northwestern Mutual Wealth Management Co | 347 | 16 | ||||||
| 2025-08-13 | 13F | Kayne Anderson Rudnick Investment Management Llc | 14,562 | 0.17 | 679 | 19.16 | ||||
| 2025-08-27 | 13F/A | Brinker Capital Investments, LLC | 56,012 | 21.54 | 2,611 | 44.44 | ||||
| 2025-08-29 | NP | MPLAX - Praxis International Index Fund Class A | 139,043 | -7.55 | 6,481 | 9.89 | ||||
| 2025-08-07 | 13F | Sierra Ocean, Llc | 1,132 | 4.62 | 53 | 23.81 | ||||
| 2025-08-14 | 13F | Citadel Advisors Llc | Call | 0 | -100.00 | 0 | ||||
| 2025-08-08 | 13F | D'Orazio & Associates, Inc. | 6,720 | 11.85 | 313 | 33.19 | ||||
| 2025-08-12 | 13F | Pathstone Holdings, LLC | 43,898 | -0.49 | 2,046 | 18.33 | ||||
| 2025-08-14 | 13F | Smartleaf Asset Management LLC | 1,133 | 53 | ||||||
| 2025-08-08 | 13F | Pnc Financial Services Group, Inc. | 18,656 | 15.19 | 870 | 36.85 | ||||
| 2025-06-26 | NP | Thrivent Core Funds - Thrivent Core Emerging Markets Equity Fund | 9,576 | -29.76 | 387 | -26.84 | ||||
| 2025-08-11 | 13F | Bell Investment Advisors, Inc | 455 | -20.87 | 21 | -4.55 | ||||
| 2025-07-25 | 13F | JustInvest LLC | 118,456 | 17.76 | 5,521 | 39.98 | ||||
| 2025-08-14 | 13F | Glenmede Investment Management, LP | 4,516 | 210 | ||||||
| 2025-08-14 | 13F | Mml Investors Services, Llc | 11,615 | 5.74 | 1 | |||||
| 2025-08-18 | 13F | Geneos Wealth Management Inc. | 144 | 29.73 | 7 | 50.00 | ||||
| 2025-08-11 | 13F | Vanguard Group Inc | 2,115,089 | -0.46 | 98,584 | 18.32 | ||||
| 2025-06-27 | NP | HAOSX - Harbor Overseas Fund Institutional Class | 8,076 | 327 | ||||||
| 2025-06-26 | NP | DAADX - Emerging Markets ex China Core Equity Portfolio Institutional Class | 18,891 | 0.00 | 764 | 4.09 | ||||
| 2025-08-12 | 13F | Dimensional Fund Advisors Lp | 452,982 | 4.04 | 21,124 | 23.72 | ||||
| 2025-07-16 | 13F | Kathmere Capital Management, LLC | 43,304 | 7.98 | 2,018 | 28.37 | ||||
| 2025-08-07 | 13F | Parkside Financial Bank & Trust | 296 | 957.14 | 14 | 1,200.00 | ||||
| 2025-06-26 | NP | DFAX - Dimensional World ex U.S. Core Equity 2 ETF | 7,515 | 0.00 | 304 | 4.12 | ||||
| 2025-07-25 | 13F | Hazlett, Burt & Watson, Inc. | 250 | 0.00 | 0 | |||||
| 2025-07-28 | NP | AVEEX - Avantis Emerging Markets Equity Fund Institutional Class This fund is a listed as child fund of American Century Companies Inc and if that institution has disclosed ownership in this security, then these positions will not be double counted when calculating total shares and total value | 25,406 | 0.00 | 1,105 | 11.85 | ||||
| 2025-05-15 | 13F | Aquatic Capital Management LLC | 0 | -100.00 | 0 | |||||
| 2025-08-13 | 13F | GeoWealth Management, LLC | 1,925 | -0.10 | 90 | 18.67 | ||||
| 2025-08-14 | 13F | Goldman Sachs Group Inc | 256,261 | 33.33 | 11,944 | 58.49 | ||||
| 2025-08-14 | 13F | Modern Wealth Management, LLC | 5,016 | -23.38 | 234 | -8.98 | ||||
| 2025-08-12 | 13F | Jpmorgan Chase & Co | 540 | -99.18 | 25 | -99.04 | ||||
| 2025-08-14 | 13F | Evergreen Capital Management Llc | 14,577 | 679 | ||||||
| 2025-06-26 | NP | SNTKX - Steward International Enhanced Index Fund Class A | 44,597 | 0.00 | 1,804 | 4.10 | ||||
| 2025-08-11 | 13F | United Capital Financial Advisers, Llc | 7,740 | -9.63 | 361 | 7.46 | ||||
| 2025-07-31 | 13F | R Squared Ltd | 0 | -100.00 | 0 | |||||
| 2025-08-06 | 13F | Texas Yale Capital Corp. | 9,000 | 0.00 | 419 | 19.03 | ||||
| 2025-07-15 | 13F | Ballentine Partners, LLC | 41,561 | 9.80 | 1,937 | 30.53 | ||||
| 2025-08-05 | 13F | Simplex Trading, Llc | Put | 100 | 0 | |||||
| 2025-08-05 | 13F | Simplex Trading, Llc | 56 | 0 | ||||||
| 2025-05-01 | 13F | Bleakley Financial Group, LLC | 0 | -100.00 | 0 | -100.00 | ||||
| 2025-07-30 | 13F | Drive Wealth Management, Llc | 8,634 | 402 | ||||||
| 2025-08-14 | 13F | Verition Fund Management LLC | 7,338 | -25.46 | 342 | -11.17 | ||||
| 2025-08-14 | 13F | Atomi Financial Group, Inc. | 9,551 | 16.18 | 445 | 38.20 | ||||
| 2025-06-26 | NP | DFA INVESTMENT DIMENSIONS GROUP INC - Emerging Markets Social Core Equity Portfolio Shares | 12,202 | 0.00 | 493 | 4.23 | ||||
| 2025-08-14 | 13F | Xponance, Inc. | 5,899 | 13.16 | 275 | 34.31 | ||||
| 2025-06-30 | NP | VT - Vanguard Total World Stock Index Fund ETF Shares | 81,784 | 0.00 | 3,307 | 4.12 | ||||
| 2025-08-14 | 13F | Vident Advisory, LLC | 109,845 | 43.69 | 5,120 | 70.80 | ||||
| 2025-06-30 | NP | VEIEX - Vanguard Emerging Markets Stock Index Fund Investor Shares | 1,176,664 | -6.03 | 47,584 | -2.15 | ||||
| 2025-08-12 | 13F | American Century Companies Inc | 329,461 | 17.59 | 15,356 | 39.78 | ||||
| 2025-08-13 | 13F | Guggenheim Capital Llc | 43,040 | 3.59 | 2,006 | 23.14 | ||||
| 2025-08-12 | 13F | SRS Capital Advisors, Inc. | 729 | 34 | ||||||
| 2025-08-14 | 13F | Boston Private Wealth Llc | 0 | -100.00 | 0 | |||||
| 2025-07-14 | 13F | Foster Group, Inc. | 11,443 | -9.85 | 533 | 7.24 | ||||
| 2025-07-25 | 13F | Cwm, Llc | 2,910 | -2.94 | 0 | |||||
| 2025-08-12 | 13F | Steward Partners Investment Advisory, Llc | 144 | 0.00 | 7 | 20.00 | ||||
| 2025-06-26 | NP | DEXC - Dimensional Emerging Markets ex China Core Equity ETF | 5,900 | 20.41 | 239 | 25.26 | ||||
| 2025-05-01 | 13F | Schechter Investment Advisors, LLC | 9,081 | -31.38 | 356 | -28.51 | ||||
| 2025-05-13 | 13F | Thrivent Financial For Lutherans | 0 | -100.00 | 0 | |||||
| 2025-05-15 | 13F | Glenmede Trust Co Na | 0 | -100.00 | 0 | |||||
| 2025-07-21 | 13F | Mirae Asset Global Investments Co., Ltd. | 172 | 8 | ||||||
| 2025-08-11 | 13F | Brown Brothers Harriman & Co | 306 | 14 | ||||||
| 2025-04-21 | 13F | Nelson, Van Denburg & Campbell Wealth Management Group, LLC | 0 | -100.00 | 0 | |||||
| 2025-08-07 | 13F | Connor, Clark & Lunn Investment Management Ltd. | 1,253,331 | 12.23 | 58,418 | 33.41 | ||||
| 2025-08-06 | 13F | Savant Capital, LLC | 29,691 | 1,384 | ||||||
| 2025-08-14 | 13F | Millennium Management Llc | 6,570 | 306 | ||||||
| 2025-05-14 | 13F | Van Hulzen Asset Management, LLC | 0 | -100.00 | 0 | |||||
| 2025-08-14 | 13F | Bank Of America Corp /de/ | 310,705 | 9.59 | 14,482 | 30.26 | ||||
| 2025-08-25 | 13F | Fulcrum Equity Management | 5,374 | 250 | ||||||
| 2025-08-04 | 13F | Capital Performance Advisors Llp | 6,558 | 306 | ||||||
| 2025-08-12 | 13F | XTX Topco Ltd | 0 | -100.00 | 0 | |||||
| 2025-08-14 | 13F | Royal Bank Of Canada | 1,308 | -37.95 | 61 | -26.51 | ||||
| 2025-07-24 | 13F | IFP Advisors, Inc | 103 | 0.00 | 5 | 0.00 | ||||
| 2025-08-14 | 13F/A | Skopos Labs, Inc. | 4,591 | 1,006.27 | 214 | 1,231.25 | ||||
| 2025-08-13 | 13F | Townsquare Capital Llc | 0 | -100.00 | 0 | |||||
| 2025-07-09 | 13F | Aaron Wealth Advisors LLC | 5,564 | 259 | ||||||
| 2025-08-13 | 13F | Schroder Investment Management Group | 675,278 | 2.70 | 31,475 | 21.89 | ||||
| 2025-08-12 | 13F | Proequities, Inc. | Put | 0 | 0 | |||||
| 2025-06-26 | NP | Dfa Investment Trust Co - The Emerging Markets Series This fund is a listed as child fund of Dimensional Fund Advisors Lp and if that institution has disclosed ownership in this security, then these positions will not be double counted when calculating total shares and total value | 111,161 | 0.00 | 4,495 | 4.12 | ||||
| 2025-08-12 | 13F | Proequities, Inc. | Call | 0 | 0 | |||||
| 2025-08-15 | 13F | WealthCollab, LLC | 291 | 0.00 | 14 | 18.18 | ||||
| 2025-08-12 | 13F | Proequities, Inc. | 0 | 0 | ||||||
| 2025-07-14 | 13F | Abound Wealth Management | 32 | -13.51 | 1 | 0.00 | ||||
| 2025-07-23 | 13F | High Note Wealth, LLC | 5 | 0.00 | 0 | |||||
| 2025-08-27 | 13F/A | Squarepoint Ops LLC | 0 | -100.00 | 0 | -100.00 | ||||
| 2025-08-14 | 13F | Driehaus Capital Management Llc | 36,471 | 0.00 | 1,700 | 18.81 | ||||
| 2025-08-12 | 13F | Global Retirement Partners, LLC | 246 | 11 | ||||||
| 2025-08-14 | 13F | Ieq Capital, Llc | 28,423 | 338.90 | 1,325 | 423.32 | ||||
| 2025-07-08 | 13F | Gallacher Capital Management LLC | 9,283 | -7.34 | 433 | 10.20 | ||||
| 2025-07-21 | 13F | Ameritas Advisory Services, LLC | 531 | 25 | ||||||
| 2025-07-18 | 13F | Deltec Asset Management Llc | 10,398 | 0.00 | 485 | 18.92 | ||||
| 2025-08-14 | 13F | D. E. Shaw & Co., Inc. | 0 | -100.00 | 0 | |||||
| 2025-08-27 | NP | THRIVENT SERIES FUND INC - Thrivent International Allocation Portfolio Class A | 5,226 | 116.94 | 244 | 158.51 | ||||
| 2025-07-16 | 13F | Highline Wealth Partners Llc | 158 | 20.61 | 7 | 40.00 | ||||
| 2025-08-06 | 13F | True Wealth Design, LLC | 49 | -41.67 | 2 | -33.33 | ||||
| 2025-08-14 | 13F | Riggs Asset Managment Co. Inc. | 93 | 4 | ||||||
| 2025-08-12 | 13F | Putnam Fl Investment Management Co | 7,477 | 349 | ||||||
| 2025-08-07 | 13F | Vise Technologies, Inc. | 5,500 | 256 | ||||||
| 2025-07-11 | 13F | Farther Finance Advisors, LLC | 522 | -11.97 | 24 | 4.35 | ||||
| 2025-08-12 | 13F | CIBC Private Wealth Group, LLC | 352 | 5.39 | 16 | 33.33 | ||||
| 2025-08-14 | 13F | Citadel Advisors Llc | Put | 0 | -100.00 | 0 | ||||
| 2025-08-14 | 13F | DZ BANK AG Deutsche Zentral Genossenschafts Bank, Frankfurt am Main | 145,000 | 0.00 | 6,758 | 18.87 | ||||
| 2025-05-15 | 13F | CAPROCK Group, Inc. | 11,305 | -1.96 | 443 | 2.07 | ||||
| 2025-08-12 | 13F | Legal & General Group Plc | 1,240 | 0.00 | 58 | 18.75 | ||||
| 2025-08-05 | 13F | Westside Investment Management, Inc. | 719 | 34 | ||||||
| 2025-07-14 | 13F | UMA Financial Services, Inc. | 568 | 11.59 | 26 | 36.84 | ||||
| 2025-07-29 | NP | SGLIX - SGI Global Equity Fund Class I Shares | 5,391 | -62.95 | 234 | -57.76 | ||||
| 2025-07-16 | 13F | Augustine Asset Management Inc | 17,696 | 0.00 | 825 | 18.90 | ||||
| 2025-08-14 | 13F | Wellington Management Group Llp | 39,488 | 1,841 | ||||||
| 2025-07-28 | NP | AVEM - Avantis Emerging Markets Equity ETF This fund is a listed as child fund of American Century Companies Inc and if that institution has disclosed ownership in this security, then these positions will not be double counted when calculating total shares and total value | 290,559 | 21.06 | 12,634 | 35.39 | ||||
| 2025-08-14 | 13F | Sei Investments Co | 61,030 | 13.30 | 2,844 | 34.66 | ||||
| 2025-08-29 | NP | John Hancock Hedged Equity & Income Fund | 15,087 | 703 | ||||||
| 2025-06-27 | NP | SPWO - SP Funds S&P World (ex-US) ETF | 3,573 | 41.73 | 144 | 48.45 | ||||
| 2025-08-14 | 13F | State Street Corp | 74,522 | 1.08 | 3,473 | 20.17 | ||||
| 2025-08-07 | 13F | Acadian Asset Management Llc | 572,484 | 22.96 | 27 | 44.44 | ||||
| 2025-08-01 | 13F | GoalVest Advisory LLC | 4 | 0.00 | 0 | |||||
| 2025-08-13 | 13F | Cerity Partners LLC | 71,794 | -9.54 | 3,346 | 7.55 | ||||
| 2025-08-11 | 13F | Citigroup Inc | 13,940 | 5.30 | 650 | 25.05 | ||||
| 2025-07-28 | 13F | Td Asset Management Inc | 653,104 | -20.05 | 30,441 | -4.96 | ||||
| 2025-08-14 | 13F | Mariner, LLC | 28,899 | 8.15 | 1,347 | 28.65 | ||||
| 2025-05-09 | 13F | Allianz Se | 0 | -100.00 | 0 | -100.00 | ||||
| 2025-07-24 | 13F | Ronald Blue Trust, Inc. | 20,557 | 5.68 | 958 | 25.72 | ||||
| 2025-08-08 | 13F | Larson Financial Group LLC | 2,040 | 304.76 | 95 | 400.00 | ||||
| 2025-08-14 | 13F | Bnp Paribas Arbitrage, Sa | 13,161 | 548.96 | 613 | 675.95 | ||||
| 2025-07-28 | NP | NSI - National Security Emerging Markets Index ETF | 6,051 | 38.44 | 263 | 55.62 | ||||
| 2025-09-04 | 13F/A | Advisor Group Holdings, Inc. | 4,195 | 664.12 | 195 | 828.57 | ||||
| 2025-07-24 | 13F | PDS Planning, Inc | 16,095 | -10.36 | 750 | 6.53 | ||||
| 2025-08-25 | 13F/A | Neuberger Berman Group LLC | 79,238 | 21.10 | 3,702 | 44.63 | ||||
| 2025-08-12 | 13F | Advisors Asset Management, Inc. | 3,711 | 57.71 | 173 | 86.96 | ||||
| 2025-07-17 | 13F | V-Square Quantitative Management LLC | 4,065 | 0.00 | 189 | 18.87 | ||||
| 2025-08-13 | 13F | Northern Trust Corp | 706,378 | 4.62 | 32,924 | 24.37 | ||||
| 2025-08-28 | NP | CWI - SPDR(R) MSCI ACWI EX-US ETF | 47,194 | 0.35 | 2,200 | 19.25 | ||||
| 2025-08-05 | 13F | NewSquare Capital LLC | 829 | 17.26 | 39 | 40.74 | ||||
| 2025-08-14 | 13F | Principal Street Partners, LLC | 6,174 | 288 | ||||||
| 2025-08-07 | 13F | Campbell & CO Investment Adviser LLC | 26,908 | 1,254 | ||||||
| 2025-08-13 | 13F | EverSource Wealth Advisors, LLC | 9,141 | 127.56 | 426 | 171.34 | ||||
| 2025-08-07 | 13F | Allworth Financial LP | 2,370 | 125.93 | 110 | 168.29 | ||||
| 2025-07-08 | 13F | Northwest & Ethical Investments L.P. | 0 | -100.00 | 0 | |||||
| 2025-08-14 | 13F | Quantinno Capital Management LP | 129,440 | 142.61 | 6,033 | 188.52 | ||||
| 2025-07-21 | 13F | Ascent Group, LLC | 24,568 | 56.30 | 1,145 | 85.88 | ||||
| 2025-08-14 | 13F | Wells Fargo & Company/mn | 2,924 | -24.15 | 136 | -9.93 | ||||
| 2025-08-27 | NP | THRIVENT SERIES FUND INC - Thrivent Partner Emerging Markets Equity Portfolio Class A | 2,214 | 107.11 | 103 | 151.22 | ||||
| 2025-08-15 | 13F | Tower Research Capital LLC (TRC) | 48 | -52.00 | 2 | -33.33 | ||||
| 2025-08-28 | NP | SPGM - SPDR(R) Portfolio MSCI Global Stock Market ETF | 21,889 | 2.96 | 1,020 | 22.45 | ||||
| 2025-08-12 | 13F | Summit Global Investments | 12,999 | 1 | ||||||
| 2025-08-14 | 13F | Citadel Advisors Llc | 31,941 | 31.98 | 1,489 | 56.96 | ||||
| 2025-06-30 | NP | VGTSX - Vanguard Total International Stock Index Fund Investor Shares | 277,613 | 0.00 | 11,227 | 4.12 | ||||
| 2025-08-12 | 13F | Coldstream Capital Management Inc | 0 | -100.00 | 0 | |||||
| 2025-07-15 | 13F | Public Employees Retirement System Of Ohio | 143,425 | 7.00 | 6,685 | 27.21 | ||||
| 2025-05-15 | 13F/A | Orion Portfolio Solutions, LLC | 46,087 | -11.31 | 1,807 | -7.62 | ||||
| 2025-07-23 | 13F | Venturi Wealth Management, LLC | 5,201 | 242 | ||||||
| 2025-08-12 | 13F | O'shaughnessy Asset Management, Llc | 107,480 | 10.28 | 5,010 | 31.09 | ||||
| 2025-08-13 | 13F | Quadrant Capital Group Llc | 48,845 | -15.70 | 2,277 | 0.22 | ||||
| 2025-07-25 | 13F | Allspring Global Investments Holdings, LLC | 0 | -100.00 | 0 | |||||
| 2025-07-29 | 13F | Wealthstream Advisors, Inc. | 5,073 | 236 | ||||||
| 2025-08-14 | 13F | Two Sigma Advisers, Lp | 0 | -100.00 | 0 | |||||
| 2025-05-15 | 13F | WPG Advisers, LLC | 0 | -100.00 | 0 | |||||
| 2025-08-14 | 13F | UBS Group AG | 46,894 | 11.63 | 2,186 | 32.67 | ||||
| 2025-06-30 | NP | VMNVX - Vanguard Global Minimum Volatility Fund Admiral Shares | 114,346 | 0.00 | 4,624 | 4.12 | ||||
| 2025-07-24 | 13F | Us Bancorp \de\ | 40,869 | 5.85 | 1,905 | 25.84 | ||||
| 2025-07-18 | 13F | BSW Wealth Partners | 4,777 | -7.67 | 223 | 9.90 | ||||
| 2025-08-13 | 13F | Hsbc Holdings Plc | 6,238 | 291 | ||||||
| 2025-08-15 | 13F | CI Private Wealth, LLC | 30,459 | -0.87 | 1,420 | 17.86 | ||||
| 2025-08-12 | 13F | Deutsche Bank Ag\ | 29,521 | 0.00 | 1,376 | 18.84 | ||||
| 2025-05-05 | 13F | Lindbrook Capital, Llc | 5,585 | 6.24 | 219 | 10.66 | ||||
| 2025-08-13 | 13F | Jones Financial Companies Lllp | 431 | 331.00 | 20 | 566.67 | ||||
| 2025-08-14 | 13F/A | Barclays Plc | 818 | 0 | ||||||
| 2025-08-13 | 13F | Natixis Advisors, L.p. | 39,098 | -10.50 | 2 | 0.00 | ||||
| 2025-08-13 | 13F | Bare Financial Services, Inc | 215 | 10 | ||||||
| 2025-07-18 | 13F | Generali Investments CEE, investicni spolecnost, a.s. | 16,929 | 0.00 | 789 | 19.00 | ||||
| 2025-08-14 | 13F | Mercer Global Advisors Inc /adv | 7,430 | -1.72 | 346 | 16.89 | ||||
| 2025-07-14 | 13F | AdvisorNet Financial, Inc | 142 | 0.00 | 7 | 20.00 | ||||
| 2025-08-13 | 13F | Invesco Ltd. | 10,318 | -1.00 | 481 | 17.65 | ||||
| 2025-08-11 | 13F | HighTower Advisors, LLC | 4,425 | 206 | ||||||
| 2025-06-30 | NP | AIM INTERNATIONAL MUTUAL FUNDS (INVESCO INTERNATIONAL MUTUAL FUNDS) - Invesco Oppenheimer Global Multi-Asset Growth Fund Class R6 | 6,350 | 109.09 | 257 | 118.80 | ||||
| 2025-08-13 | 13F | Marshall Wace, Llp | 43,434 | 14.20 | 2,024 | 35.75 | ||||
| 2025-08-14 | 13F | Fmr Llc | 47,835 | 43.29 | 2,230 | 70.41 | ||||
| 2025-08-14 | 13F | Wetherby Asset Management Inc | 31,651 | -4.26 | 1,475 | 18.57 | ||||
| 2025-07-28 | NP | AVSE - Avantis Responsible Emerging Markets Equity ETF | 1,559 | 13.13 | 68 | 26.42 | ||||
| 2025-06-26 | NP | HFIGX - Hartford Schroders Diversified Growth Fund Class I | 3,827 | 17.68 | 155 | 22.22 | ||||
| 2025-07-30 | 13F | Ethic Inc. | 53,719 | -18.24 | 2,518 | -2.59 | ||||
| 2025-04-21 | 13F | Catalina Capital Group, LLC | 0 | -100.00 | 0 | |||||
| 2025-08-08 | 13F | SBI Securities Co., Ltd. | 312 | -0.32 | 15 | 16.67 | ||||
| 2025-07-30 | 13F | Cullen/frost Bankers, Inc. | 0 | -100.00 | 0 | |||||
| 2025-08-12 | 13F | BlackRock, Inc. | 2,679,481 | 7.03 | 124,891 | 27.23 | ||||
| 2025-05-05 | 13F | Transce3nd, LLC | 0 | -100.00 | 0 | |||||
| 2025-08-12 | 13F | Atlas Capital Advisors Llc | 199 | 0.00 | 9 | 28.57 | ||||
| 2025-07-28 | 13F | Rosenberg Matthew Hamilton | 397 | 0.00 | 19 | 20.00 | ||||
| 2025-08-12 | 13F | MAI Capital Management | 3,899 | 16,145.83 | 182 | |||||
| 2025-08-14 | 13F | Ameriprise Financial Inc | 217,162 | -18.68 | 8,441 | -3.04 | ||||
| 2025-08-13 | 13F | Twin Peaks Wealth Advisors, LLC | 269 | 12 | ||||||
| 2025-04-22 | 13F | Mizuho Securities Co. Ltd. | 0 | -100.00 | 0 | -100.00 | ||||
| 2025-07-28 | 13F | Morningstar Investment Management LLC | 68,000 | 0 | ||||||
| 2025-08-15 | 13F | Morgan Stanley | 1,300,893 | 6.70 | 60,635 | 26.84 | ||||
| 2025-04-23 | 13F | Continuum Advisory, LLC | 0 | -100.00 | 0 | -100.00 | ||||
| 2025-07-08 | 13F | Parallel Advisors, LLC | 23,624 | 2.80 | 1,101 | 22.20 | ||||
| 2025-08-14 | 13F | Aqr Capital Management Llc | 23,675 | 211.06 | 1,103 | 270.13 | ||||
| 2025-08-13 | 13F | Renaissance Technologies Llc | 2,894,055 | -5.52 | 134,892 | 12.31 | ||||
| 2025-08-27 | NP | RYWTX - Emerging Markets 2x Strategy Fund Class A | 2,021 | 143.79 | 94 | 193.75 | ||||
| 2025-08-15 | 13F | Binnacle Investments Inc | 302 | 0.00 | 14 | 27.27 | ||||
| 2025-08-13 | 13F | Arrowstreet Capital, Limited Partnership | 297,704 | 411.11 | 13,876 | 507.75 | ||||
| 2025-07-22 | 13F | Simplicity Wealth,LLC | 9,294 | 433 | ||||||
| 2025-06-26 | NP | DFCEX - Emerging Markets Core Equity Portfolio - Institutional Class This fund is a listed as child fund of Dimensional Fund Advisors Lp and if that institution has disclosed ownership in this security, then these positions will not be double counted when calculating total shares and total value | 64,400 | 0.00 | 2,604 | 4.12 | ||||
| 2025-08-05 | 13F | Bridgewater Advisors Inc. | 9,038 | 6.69 | 394 | 16.57 | ||||
| 2025-08-13 | 13F | Russell Investments Group, Ltd. | 32 | 1 | ||||||
| 2025-06-26 | NP | DFSE - Dimensional Emerging Markets Sustainability Core 1 ETF | 4,613 | 17.89 | 187 | 23.18 | ||||
| 2025-07-09 | 13F | Sivia Capital Partners, LLC | 7,752 | -16.94 | 361 | -1.10 | ||||
| 2025-08-11 | 13F | Principal Securities, Inc. | 0 | -100.00 | 0 | |||||
| 2025-08-05 | 13F | Bank Of Montreal /can/ | 35,830 | -0.87 | 1,670 | 17.85 | ||||
| 2025-07-28 | 13F | BRYN MAWR TRUST Co | 78 | 0.00 | 4 | 0.00 | ||||
| 2025-07-24 | 13F | Lester Murray Antman dba SimplyRich | 14,902 | 0.00 | 1 | |||||
| 2025-07-16 | 13F | Signaturefd, Llc | 35,457 | -1.99 | 1,653 | 16.50 | ||||
| 2025-08-04 | 13F | Assetmark, Inc | 63 | 3 | ||||||
| 2025-08-04 | 13F | Simon Quick Advisors, Llc | 7,740 | 361 | ||||||
| 2025-08-05 | 13F | Tsfg, Llc | 98 | 0.00 | 0 | |||||
| 2025-07-29 | 13F | Harbor Asset Planning, Inc. | 167 | 8 | ||||||
| 2025-08-14 | 13F | Axa S.a. | 13,024 | 0.00 | 607 | 19.02 | ||||
| 2025-04-22 | NP | APIE - ActivePassive International Equity ETF | 0 | -100.00 | 0 | -100.00 | ||||
| 2025-08-08 | 13F | Crossmark Global Holdings, Inc. | 63,974 | -29.12 | 2,982 | -15.77 |
Other Listings
| DE:CHWD | € 37.40 |