Mga Batayang Estadistika
| Pemilik Institusional | 95 total, 95 long only, 0 short only, 0 long/short - change of 9.20% MRQ |
| Alokasi Portofolio Rata-rata | 0.3898 % - change of -26.15% MRQ |
| Saham Institusional (Jangka Panjang) | 4,821,859 (ex 13D/G) - change of 0.04MM shares 0.93% MRQ |
| Nilai Institusional (Jangka Panjang) | $ 217,330 USD ($1000) |
Kepemilikan Institusional dan Pemegang Saham
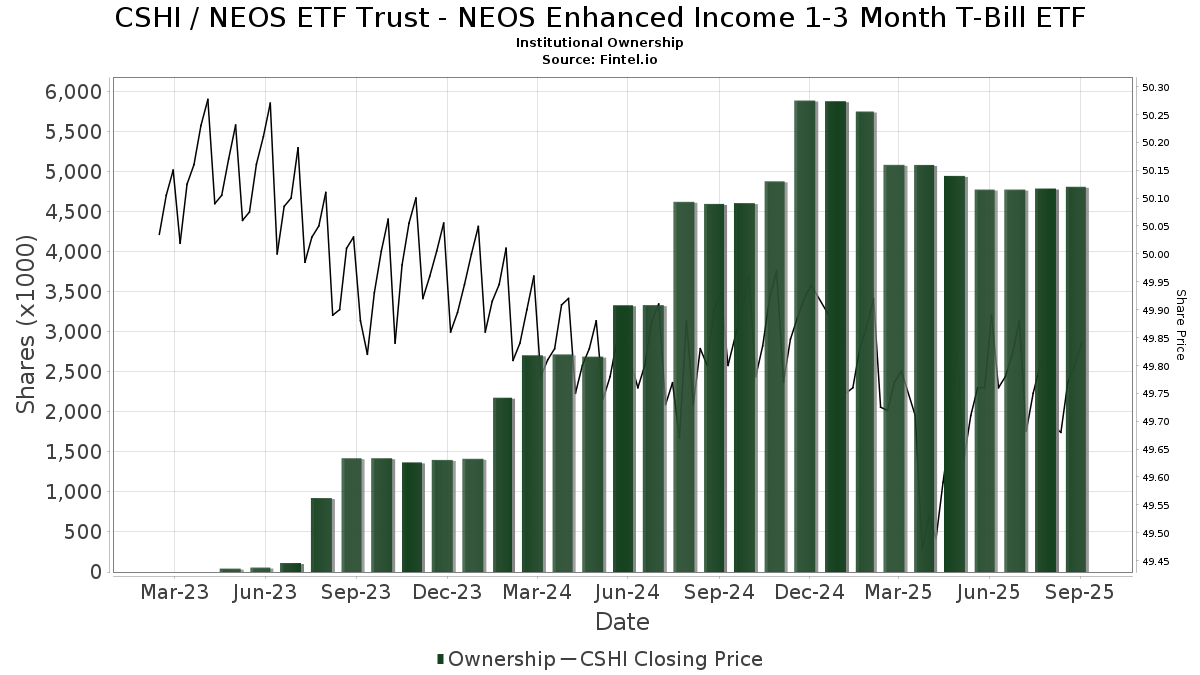
NEOS ETF Trust - NEOS Enhanced Income 1-3 Month T-Bill ETF (US:CSHI) memiliki 95 pemilik institusional dan pemegang saham yang telah mengajukan formulir 13D/G atau 13F kepada Komisi Bursa Efek (Securities Exchange Commission/SEC). Lembaga-lembaga ini memegang total 4,821,859 saham. Pemegang saham terbesar meliputi Richard P Slaughter Associates Inc, Gradient Investments LLC, LPL Financial LLC, Atticus Wealth Management, Llc, Commonwealth Equity Services, Llc, Retirement Planning Group, Gainplan LLC, Grantvest Financial Group LLC, Stratos Wealth Partners, LTD., and Integrated Wealth Concepts LLC .
Struktur kepemilikan institusional NEOS ETF Trust - NEOS Enhanced Income 1-3 Month T-Bill ETF (ARCA:CSHI) menunjukkan posisi terkini di perusahaan oleh institusi dan dana, serta perubahan terbaru dalam ukuran posisi. Pemegang saham utama dapat mencakup investor individu, reksa dana, dana lindung nilai, atau institusi. Jadwal 13D menunjukkan bahwa investor memegang (atau pernah memegang) lebih dari 5% saham perusahaan dan bermaksud (atau pernah bermaksud) untuk secara aktif mengejar perubahan strategi bisnis. Jadwal 13G menunjukkan investasi pasif lebih dari 5%.
The share price as of September 5, 2025 is 49.76 / share. Previously, on September 9, 2024, the share price was 49.84 / share. This represents a decline of 0.16% over that period.
Skor Sentimen Dana
Skor Sentimen Dana (sebelumnya dikenal sebagai Skor Akumulasi Kepemilikan) menemukan saham-saham yang paling banyak dibeli oleh dana. Ini adalah hasil dari model kuantitatif multi-faktor yang canggih yang mengidentifikasi perusahaan dengan tingkat akumulasi institusional tertinggi. Model penilaian menggunakan kombinasi dari total peningkatan pemilik yang diungkapkan, perubahan dalam alokasi portofolio pada pemilik tersebut, dan metrik lainnya. Angka berkisar dari 0 hingga 100, dengan angka yang lebih tinggi menunjukkan tingkat akumulasi yang lebih tinggi dibandingkan dengan perusahaan sejenisnya, dan 50 adalah rata-ratanya.
Frekuensi Pembaruan: Setiap Hari
Lihat Ownership Explorer, yang menyediakan daftar perusahaan dengan peringkat tertinggi.
Rasio Put/Call Institusional
Selain melaporkan isu ekuitas dan utang standar, institusi dengan aset di bawah manajemen lebih dari 100 juta dolar AS juga harus mengungkapkan kepemilikan opsi put dan call mereka. Karena opsi put umumnya menunjukkan sentimen negatif, dan opsi call menunjukkan sentimen positif, kita dapat mengetahui sentimen institusional secara keseluruhan dengan memplot rasio put terhadap call. Grafik di sebelah kanan memplot rasio put/call historis untuk instrumen ini.
Menggunakan Rasio Put/Call sebagai indikator sentimen investor mengatasi salah satu kekurangan utama dari penggunaan total kepemilikan institusional, yaitu sejumlah besar aset yang dikelola diinvestasikan secara pasif untuk melacak indeks. Dana yang dikelola secara pasif biasanya tidak membeli opsi, sehingga indikator rasio put/call lebih akurat dalam melacak sentimen dana yang dikelola secara aktif.
Pengajuan 13F dan NPORT
Detail pada pengajuan 13F tersedia gratis. Detail pada pengajuan NP memerlukan keanggotaan premium. Baris berwarna hijau menunjukkan posisi baru. Baris berwarna merah menunjukkan posisi yang sudah ditutup. Klik tautan ini ikon untuk melihat riwayat transaksi selengkapnya.
Tingkatkan
untuk membuka data premium dan mengekspor ke Excel ![]() .
.
| Tanggal File | Sumber | Investor | Ketik | Presyo ng Avg (Silangan) |
Saham | Δ Saham (%) |
Dilaporkan Nilai ($1000) |
Nilai Δ (%) |
Alokasi Port (%) |
|
|---|---|---|---|---|---|---|---|---|---|---|
| 2025-07-09 | 13F | Dynamic Advisor Solutions LLC | 28,432 | -15.82 | 1,414 | -15.69 | ||||
| 2025-08-01 | 13F | Brinker Capital Investments, LLC | 0 | -100.00 | 0 | -100.00 | ||||
| 2025-08-12 | 13F | Global Retirement Partners, LLC | 5,374 | -8.15 | 267 | -8.25 | ||||
| 2025-07-16 | 13F | Essex Financial Services, Inc. | 10,334 | 6.11 | 514 | 6.21 | ||||
| 2025-08-14 | 13F | IHT Wealth Management, LLC | 5,000 | -1.98 | 249 | -1.98 | ||||
| 2025-08-14 | 13F | UBS Group AG | 1,672 | 83 | ||||||
| 2025-08-05 | 13F | Claro Advisors LLC | 18,528 | -20.10 | 921 | -19.91 | ||||
| 2025-08-14 | 13F | Royal Bank Of Canada | 0 | -100.00 | 0 | |||||
| 2025-08-11 | 13F | Cannon Advisors, Inc. | 24,626 | -21.08 | 1,225 | -20.93 | ||||
| 2025-08-14 | 13F | Citadel Advisors Llc | 8,935 | -39.63 | 444 | -39.51 | ||||
| 2025-07-14 | 13F | Ridgewood Investments LLC | 900 | 0.00 | 45 | 0.00 | ||||
| 2025-08-06 | 13F | Commonwealth Equity Services, Llc | 271,409 | 6,165.21 | 13 | |||||
| 2025-08-14 | 13F | Raymond James Financial Inc | 77 | 4 | ||||||
| 2025-04-23 | 13F | International Assets Investment Management, Llc | 0 | -100.00 | 0 | -100.00 | ||||
| 2025-07-23 | 13F | Gainplan LLC | 176,822 | 7.40 | 8,793 | 7.63 | ||||
| 2025-07-08 | 13F | Parallel Advisors, LLC | 306 | 150.82 | 15 | 150.00 | ||||
| 2025-07-29 | 13F | Mattson Financial Services, LLC | 7,221 | -2.71 | 359 | -2.45 | ||||
| 2025-08-08 | 13F | Capital Investment Advisory Services, LLC | 117,845 | 12.15 | 5,860 | 12.37 | ||||
| 2025-08-14 | 13F | Stifel Financial Corp | 68,734 | -3.41 | 3,418 | -3.20 | ||||
| 2025-08-07 | 13F | Summit X, LLC | 47,766 | 2,375 | ||||||
| 2025-04-30 | 13F | Capital Insight Partners, Llc | 0 | -100.00 | 0 | |||||
| 2025-08-11 | 13F | Private Advisor Group, LLC | 15,547 | 773 | ||||||
| 2025-08-11 | 13F | Nations Financial Group Inc, /ia/ /adv | 7,294 | 363 | ||||||
| 2025-07-08 | 13F | Nbc Securities, Inc. | 5,260 | -8.59 | 0 | |||||
| 2025-07-10 | 13F | Worth Asset Management, LLC | 7,976 | -92.57 | 397 | -92.57 | ||||
| 2025-04-24 | 13F | Decker Retirement Planning Inc. | 0 | -100.00 | 0 | |||||
| 2025-08-14 | 13F | MGB Wealth Management, LLC | 1,500 | 75 | ||||||
| 2025-07-10 | 13F | Secure Asset Management, LLC | 4,117 | -17.84 | 205 | -17.74 | ||||
| 2025-07-22 | 13F | Wealthcare Advisory Partners LLC | 58,976 | 1,004.21 | 2,933 | 1,006.42 | ||||
| 2025-08-06 | 13F | Rps Advisory Solutions Llc | 4,501 | -64.12 | 224 | -64.15 | ||||
| 2025-07-25 | 13F | Cwm, Llc | 22,011 | 1 | ||||||
| 2025-08-06 | 13F | New Millennium Group LLC | 1 | 0 | ||||||
| 2025-08-08 | 13F | Hartland & Co., LLC | 7,187 | 0.28 | 357 | 0.56 | ||||
| 2025-08-14 | 13F | Napa Wealth Management | 26,989 | -82.56 | 1,342 | -82.53 | ||||
| 2025-05-13 | 13F | Aptus Capital Advisors, LLC | 0 | -100.00 | 0 | |||||
| 2025-05-16 | 13F | Coppell Advisory Solutions LLC | 0 | -100.00 | 0 | |||||
| 2025-07-08 | 13F | Gradient Investments LLC | 429,661 | -0.68 | 21,367 | -0.48 | ||||
| 2025-08-08 | 13F | Larson Financial Group LLC | 328 | 1.55 | 16 | 0.00 | ||||
| 2025-07-21 | 13F | DHJJ Financial Advisors, Ltd. | 410 | 0.00 | 20 | 0.00 | ||||
| 2025-07-17 | 13F | Nelson, Van Denburg & Campbell Wealth Management Group, LLC | 0 | -100.00 | 0 | |||||
| 2025-07-30 | 13F | Retirement Planning Group | 242,407 | -9.37 | 12,055 | -9.19 | ||||
| 2025-07-08 | 13F | Richard P Slaughter Associates Inc | 600,007 | 2.17 | 29,838 | 2.38 | ||||
| 2025-08-14 | 13F | Old Mission Capital Llc | 30,326 | -72.15 | 1,508 | -72.09 | ||||
| 2025-08-18 | 13F | Tactive Advisors, LLC | 24,179 | 181.25 | 1,202 | 180.84 | ||||
| 2025-08-13 | 13F | Empire Financial Management Company, LLC | 11,894 | -0.31 | 592 | -0.17 | ||||
| 2025-07-10 | 13F | PMV Capital Advisers, LLC | 8,170 | -1.74 | 406 | -1.46 | ||||
| 2025-05-14 | 13F | Ameriprise Financial Inc | 0 | -100.00 | 0 | -100.00 | ||||
| 2025-07-11 | 13F | Farther Finance Advisors, LLC | 2,428 | 121 | ||||||
| 2025-07-18 | 13F | Precision Wealth Strategies, LLC | 115,220 | 11.01 | 5,730 | 11.22 | ||||
| 2025-07-29 | 13F | Latitude Advisors, LLC | 27,214 | -5.79 | 1,353 | -5.58 | ||||
| 2025-08-06 | 13F | Cherry Creek Investment Advisors, Inc. | 5,287 | 28.51 | 263 | 28.43 | ||||
| 2025-04-22 | 13F | Bright Futures Wealth Management, LLC. | 13,849 | 117.55 | 686 | 116.77 | ||||
| 2025-08-01 | 13F | Gwn Securities Inc. | 0 | -100.00 | 0 | |||||
| 2025-05-19 | 13F/A | Jane Street Group, Llc | 0 | -100.00 | 0 | -100.00 | ||||
| 2025-08-13 | 13F | Flow Traders U.s. Llc | 5,948 | -79.55 | 0 | -100.00 | ||||
| 2025-08-14 | 13F | Susquehanna International Group, Llp | 0 | -100.00 | 0 | |||||
| 2025-08-01 | 13F | FSA Advisors, Inc. | 70,165 | 343.41 | 3,489 | 322.91 | ||||
| 2025-07-25 | 13F | We Are One Seven, LLC | 7,051 | -48.89 | 351 | -48.83 | ||||
| 2025-07-28 | 13F | Mutual Advisors, LLC | 50,710 | 39.36 | 2,522 | 39.82 | ||||
| 2025-08-04 | 13F | Creative Financial Designs Inc /adv | 600 | 0.00 | 30 | 0.00 | ||||
| 2025-08-14 | 13F | Mml Investors Services, Llc | 145,960 | -16.14 | 7 | -12.50 | ||||
| 2025-08-11 | 13F | Cornerstone Planning Group LLC | 0 | -100.00 | 0 | |||||
| 2025-07-22 | 13F | Berger Financial Group, Inc | 4,064 | 202 | ||||||
| 2025-08-12 | 13F | LPL Financial LLC | 414,929 | 29.80 | 20,634 | 30.06 | ||||
| 2025-07-14 | 13F | AdvisorNet Financial, Inc | 0 | -100.00 | 0 | |||||
| 2025-07-29 | 13F | Private Trust Co Na | 2,000 | 0.00 | 99 | 0.00 | ||||
| 2025-08-14 | 13F | CoreCap Advisors, LLC | 17,695 | 79.28 | 880 | 79.75 | ||||
| 2025-08-14 | 13F | Atomi Financial Group, Inc. | 142,523 | 25.30 | 7,088 | 25.54 | ||||
| 2025-09-04 | 13F/A | Advisor Group Holdings, Inc. | 28,715 | -88.36 | 1,428 | -88.34 | ||||
| 2025-08-14 | 13F | Ausdal Financial Partners, Inc. | 7,447 | 370 | ||||||
| 2025-08-15 | 13F | Global View Capital Management LLC | 34,655 | -9.73 | 1,723 | -9.55 | ||||
| 2025-08-01 | 13F | United Capital Management of KS, Inc. | 4,991 | -2.61 | 248 | -2.36 | ||||
| 2025-08-14 | 13F | Mercer Global Advisors Inc /adv | 61,861 | -23.55 | 3,076 | -23.39 | ||||
| 2025-08-14 | 13F | GWM Advisors LLC | 53,479 | -2.35 | 2,660 | -2.13 | ||||
| 2025-08-14 | 13F | Integrated Wealth Concepts LLC | 149,629 | 5.35 | 7,441 | 5.58 | ||||
| 2025-05-15 | 13F | Bank Of America Corp /de/ | 0 | -100.00 | 0 | |||||
| 2025-08-14 | 13F | Camarda Financial Advisors, LLC | 28,928 | -57.77 | 1,439 | -57.69 | ||||
| 2025-08-06 | 13F | AE Wealth Management LLC | 80 | 9.59 | 4 | 0.00 | ||||
| 2025-07-16 | 13F | Owen LaRue, LLC | 29,088 | 89.81 | 1,447 | 90.26 | ||||
| 2025-08-13 | 13F | First Trust Advisors Lp | 4,187 | -4.56 | 208 | -4.15 | ||||
| 2025-08-12 | 13F | Gladstone Institutional Advisory LLC | 60,219 | 5.63 | 2,995 | 5.83 | ||||
| 2025-08-15 | 13F | Equitable Holdings, Inc. | 10,307 | -8.84 | 513 | -8.73 | ||||
| 2025-08-15 | 13F | Brown Financial Advisors | 16,965 | -2.49 | 844 | -2.32 | ||||
| 2025-05-06 | 13F | WT Wealth Management | 48,352 | -45.19 | 2,400 | -45.42 | ||||
| 2025-08-06 | 13F | Able Wealth Management LLC | 17,714 | 881 | ||||||
| 2025-08-12 | 13F | Steward Partners Investment Advisory, Llc | 1,956 | 5.50 | 97 | 5.43 | ||||
| 2025-08-01 | 13F | Ashton Thomas Private Wealth, LLC | 19,807 | 2.30 | 985 | 2.60 | ||||
| 2025-07-29 | 13F | Stratos Wealth Partners, LTD. | 156,635 | 32.20 | 7,789 | 32.47 | ||||
| 2025-07-23 | 13F | MADDEN SECURITIES Corp | 25,865 | 1,286 | ||||||
| 2025-07-31 | 13F | Cambridge Investment Research Advisors, Inc. | 0 | -100.00 | 0 | |||||
| 2025-07-11 | 13F | SILVER OAK SECURITIES, Inc | 9,921 | -1.28 | 493 | -1.00 | ||||
| 2025-07-23 | 13F | Heck Capital Advisors, LLC | 13,594 | 20.00 | 676 | 20.28 | ||||
| 2025-08-14 | 13F | Sunbelt Securities, Inc. | 0 | -100.00 | 0 | |||||
| 2025-05-14 | 13F | Delta Investment Management, LLC | 0 | -100.00 | 0 | |||||
| 2025-04-28 | 13F | D.a. Davidson & Co. | 0 | -100.00 | 0 | |||||
| 2025-08-11 | 13F | Inspire Advisors, LLC | 42,224 | 20.59 | 2,100 | 20.84 | ||||
| 2025-08-01 | 13F | Envestnet Asset Management Inc | 12,071 | -5.25 | 600 | -5.06 | ||||
| 2025-08-15 | 13F | Morgan Stanley | 1 | 0.00 | 0 | |||||
| 2025-05-14 | 13F | Orion Portfolio Solutions, LLC | 25,394 | 0.00 | 1,265 | 0.00 | ||||
| 2025-08-06 | 13F | Legacy Investment Solutions, LLC | 2 | -98.40 | 0 | -100.00 | ||||
| 2025-08-12 | 13F | Proequities, Inc. | 0 | 0 | ||||||
| 2025-04-17 | 13F | Great Lakes Retirement, Inc. | 0 | -100.00 | 0 | |||||
| 2025-08-11 | 13F | HighTower Advisors, LLC | 39,625 | 9.09 | 1,971 | 9.32 | ||||
| 2025-07-08 | 13F | Paladin Wealth, LLC | 17,826 | -7.75 | 886 | -7.61 | ||||
| 2025-08-22 | 13F | Carter Financial Group, INC. | 9,562 | 476 | ||||||
| 2025-08-12 | 13F | CIBC Private Wealth Group, LLC | 720 | 0.00 | 36 | 0.00 | ||||
| 2025-07-29 | 13F | Madison Wealth Partners, Inc | 13,525 | -37.49 | 673 | -37.37 | ||||
| 2025-08-14 | 13F | Fmr Llc | 4 | 300.00 | 0 | |||||
| 2025-08-13 | 13F | Capital Analysts, Inc. | 545 | 0 | ||||||
| 2025-07-10 | 13F | Atticus Wealth Management, Llc | 336,056 | -10.49 | 16,712 | -10.30 | ||||
| 2025-08-13 | 13F | Grantvest Financial Group LLC | 162,287 | 18.81 | 8,071 | 19.06 | ||||
| 2025-08-06 | 13F | Legacy Wealth Managment, LLC/ID | 2 | -95.12 | 0 | -100.00 | ||||
| 2025-04-23 | 13F | Spire Wealth Management | 0 | -100.00 | 0 | |||||
| 2025-07-22 | 13F | Belpointe Asset Management LLC | 17,391 | -9.86 | 865 | -9.72 | ||||
| 2025-08-04 | 13F | Impact Partnership Wealth, LLC | 12,497 | 621 | ||||||
| 2025-08-07 | 13F | Allworth Financial LP | 11,633 | 2.86 | 578 | 3.21 | ||||
| 2025-08-14 | 13F | Warren Averett Asset Management, LLC | 7,734 | -10.50 | 385 | -10.28 |