Mga Batayang Estadistika
| Pemilik Institusional | 144 total, 144 long only, 0 short only, 0 long/short - change of 7.41% MRQ |
| Alokasi Portofolio Rata-rata | 0.4807 % - change of 8.29% MRQ |
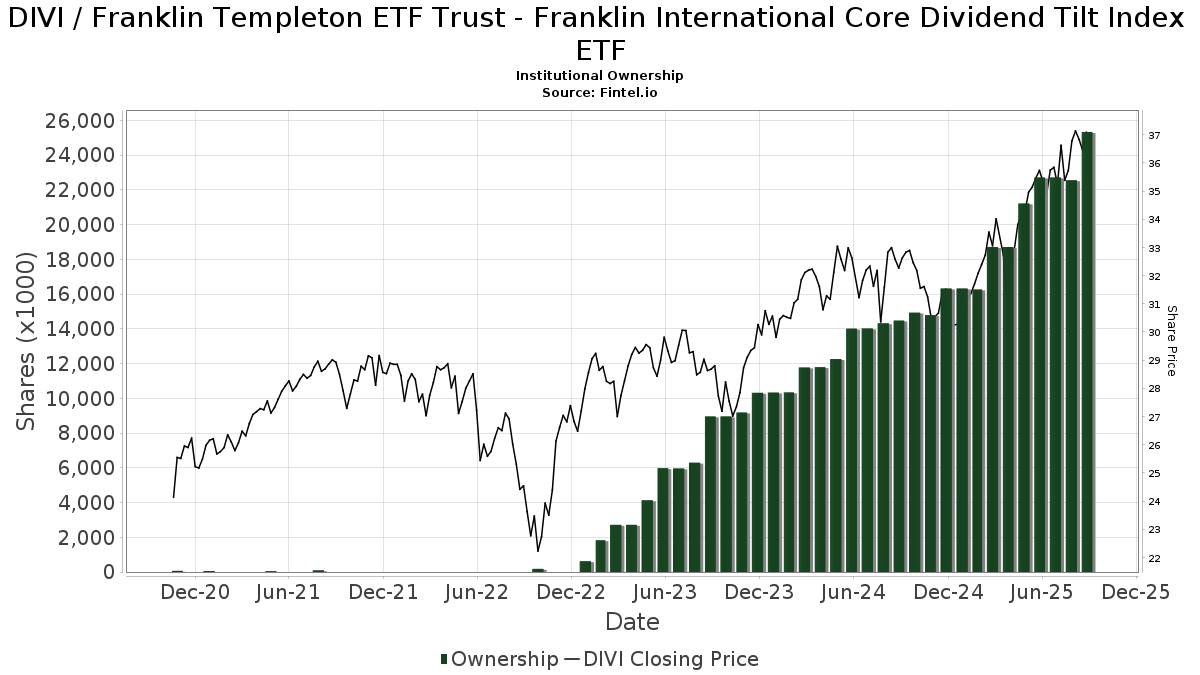
| Saham Institusional (Jangka Panjang) | 25,335,825 (ex 13D/G) - change of 2.62MM shares 11.55% MRQ |
| Nilai Institusional (Jangka Panjang) | $ 782,787 USD ($1000) |
Kepemilikan Institusional dan Pemegang Saham
Franklin Templeton ETF Trust - Franklin International Core Dividend Tilt Index ETF (US:DIVI) memiliki 144 pemilik institusional dan pemegang saham yang telah mengajukan formulir 13D/G atau 13F kepada Komisi Bursa Efek (Securities Exchange Commission/SEC). Lembaga-lembaga ini memegang total 25,335,825 saham. Pemegang saham terbesar meliputi Retirement Planning Group, LPL Financial LLC, Bank Of America Corp /de/, Capital Analysts, Inc., Legacy Financial Advisors, Inc., Cwm, Llc, Raymond James Financial Inc, Northwestern Mutual Wealth Management Co, GWM Advisors LLC, and Baron Wealth Management LLC .
Struktur kepemilikan institusional Franklin Templeton ETF Trust - Franklin International Core Dividend Tilt Index ETF (ARCA:DIVI) menunjukkan posisi terkini di perusahaan oleh institusi dan dana, serta perubahan terbaru dalam ukuran posisi. Pemegang saham utama dapat mencakup investor individu, reksa dana, dana lindung nilai, atau institusi. Jadwal 13D menunjukkan bahwa investor memegang (atau pernah memegang) lebih dari 5% saham perusahaan dan bermaksud (atau pernah bermaksud) untuk secara aktif mengejar perubahan strategi bisnis. Jadwal 13G menunjukkan investasi pasif lebih dari 5%.
The share price as of September 5, 2025 is 36.85 / share. Previously, on September 6, 2024, the share price was 31.98 / share. This represents an increase of 15.23% over that period.
Skor Sentimen Dana
Skor Sentimen Dana (sebelumnya dikenal sebagai Skor Akumulasi Kepemilikan) menemukan saham-saham yang paling banyak dibeli oleh dana. Ini adalah hasil dari model kuantitatif multi-faktor yang canggih yang mengidentifikasi perusahaan dengan tingkat akumulasi institusional tertinggi. Model penilaian menggunakan kombinasi dari total peningkatan pemilik yang diungkapkan, perubahan dalam alokasi portofolio pada pemilik tersebut, dan metrik lainnya. Angka berkisar dari 0 hingga 100, dengan angka yang lebih tinggi menunjukkan tingkat akumulasi yang lebih tinggi dibandingkan dengan perusahaan sejenisnya, dan 50 adalah rata-ratanya.
Frekuensi Pembaruan: Setiap Hari
Lihat Ownership Explorer, yang menyediakan daftar perusahaan dengan peringkat tertinggi.
Rasio Put/Call Institusional
Selain melaporkan isu ekuitas dan utang standar, institusi dengan aset di bawah manajemen lebih dari 100 juta dolar AS juga harus mengungkapkan kepemilikan opsi put dan call mereka. Karena opsi put umumnya menunjukkan sentimen negatif, dan opsi call menunjukkan sentimen positif, kita dapat mengetahui sentimen institusional secara keseluruhan dengan memplot rasio put terhadap call. Grafik di sebelah kanan memplot rasio put/call historis untuk instrumen ini.
Menggunakan Rasio Put/Call sebagai indikator sentimen investor mengatasi salah satu kekurangan utama dari penggunaan total kepemilikan institusional, yaitu sejumlah besar aset yang dikelola diinvestasikan secara pasif untuk melacak indeks. Dana yang dikelola secara pasif biasanya tidak membeli opsi, sehingga indikator rasio put/call lebih akurat dalam melacak sentimen dana yang dikelola secara aktif.
Pengajuan 13F dan NPORT
Detail pada pengajuan 13F tersedia gratis. Detail pada pengajuan NP memerlukan keanggotaan premium. Baris berwarna hijau menunjukkan posisi baru. Baris berwarna merah menunjukkan posisi yang sudah ditutup. Klik tautan ini ikon untuk melihat riwayat transaksi selengkapnya.
Tingkatkan
untuk membuka data premium dan mengekspor ke Excel ![]() .
.
| Tanggal File | Sumber | Investor | Ketik | Presyo ng Avg (Silangan) |
Saham | Δ Saham (%) |
Dilaporkan Nilai ($1000) |
Nilai Δ (%) |
Alokasi Port (%) |
|
|---|---|---|---|---|---|---|---|---|---|---|
| 2025-08-13 | 13F | Cary Street Partners Financial Llc | 140,173 | 0.00 | 4,996 | 9.35 | ||||
| 2025-07-16 | 13F/A | CX Institutional | 23,254 | -6.14 | 1 | |||||
| 2025-07-18 | 13F | Powers Advisory Group, LLC | 30,329 | 55.58 | 1,081 | 70.08 | ||||
| 2025-07-15 | 13F | Burns Matteson Capital Management, LLC | 8,100 | -3.77 | 289 | 5.11 | ||||
| 2025-08-12 | 13F | Proequities, Inc. | 0 | 0 | ||||||
| 2025-08-12 | 13F | LPL Financial LLC | 3,905,450 | 3.69 | 139,190 | 13.40 | ||||
| 2025-08-06 | 13F | AE Wealth Management LLC | 70 | 0.00 | 2 | 0.00 | ||||
| 2025-07-31 | 13F | Sage Mountain Advisors LLC | 379 | 0.00 | 14 | 8.33 | ||||
| 2025-08-14 | 13F | Bank Of America Corp /de/ | 1,519,906 | 138.40 | 54,169 | 160.72 | ||||
| 2025-08-14 | 13F | Mml Investors Services, Llc | 53,544 | 12.05 | 2 | 0.00 | ||||
| 2025-07-25 | 13F | Cwm, Llc | 830,491 | 17.00 | 30 | 26.09 | ||||
| 2025-07-24 | 13F | Ridgeline Wealth Planning, LLC | 111,469 | 7.62 | 3,973 | 17.69 | ||||
| 2025-08-05 | 13F | Bank Of Montreal /can/ | 6,773 | 6.91 | 241 | 16.99 | ||||
| 2025-08-14 | 13F | Royal Bank Of Canada | 23,157 | 350.09 | 825 | 391.07 | ||||
| 2025-07-28 | 13F | Harbour Investments, Inc. | 54,281 | -49.33 | 1,935 | -44.60 | ||||
| 2025-07-08 | 13F | Parallel Advisors, LLC | 121 | 1.68 | 4 | 33.33 | ||||
| 2025-07-24 | 13F | IFP Advisors, Inc | 5,813 | -19.92 | 207 | -12.29 | ||||
| 2025-07-11 | 13F | SILVER OAK SECURITIES, Inc | 6,765 | -6.46 | 241 | 1.69 | ||||
| 2025-08-14 | 13F | Fmr Llc | 5,529 | 120.89 | 197 | 143.21 | ||||
| 2025-08-14 | 13F | Benjamin Edwards Inc | 26,473 | 0.00 | 943 | 9.40 | ||||
| 2025-07-17 | 13F | Kelly Financial Services LLC | 47,719 | 1,701 | ||||||
| 2025-08-13 | 13F | EverSource Wealth Advisors, LLC | 0 | -100.00 | 0 | |||||
| 2025-08-15 | 13F | Morgan Stanley | 622 | -88.19 | 22 | -87.13 | ||||
| 2025-07-09 | 13F | Baron Wealth Management LLC | 678,704 | 93.77 | 24,189 | 111.91 | ||||
| 2025-08-12 | 13F | SRS Capital Advisors, Inc. | 1,224 | 44 | ||||||
| 2025-08-11 | 13F | Tidemark, LLC | 4,559 | 59.85 | 162 | 76.09 | ||||
| 2025-08-13 | 13F | Jones Financial Companies Lllp | 120,073 | 57.67 | 4,277 | 71.04 | ||||
| 2025-08-25 | 13F | Silverlake Wealth Management Llc | 21,787 | 12.55 | 776 | 23.17 | ||||
| 2025-08-07 | 13F | LOM Asset Management Ltd | 7,155 | 0 | ||||||
| 2025-04-28 | 13F | Rosenberg Matthew Hamilton | 0 | -100.00 | 0 | -100.00 | ||||
| 2025-08-06 | 13F | Commonwealth Equity Services, Llc | 174,616 | -11.66 | 6 | 0.00 | ||||
| 2025-08-13 | 13F | StoneX Group Inc. | 6,665 | 238 | ||||||
| 2025-07-16 | 13F | Perigon Wealth Management, LLC | 6,934 | 247 | ||||||
| 2025-08-11 | 13F | Cascade Wealth Advisors, Inc | 7,720 | 280 | ||||||
| 2025-08-14 | 13F | Federation des caisses Desjardins du Quebec | 715 | 0.00 | 25 | 8.70 | ||||
| 2025-07-29 | 13F | Stratos Wealth Partners, LTD. | 7,488 | 5.30 | 267 | 15.15 | ||||
| 2025-08-05 | 13F | GPS Wealth Strategies Group, LLC | 200 | 0.00 | 7 | 16.67 | ||||
| 2025-08-13 | 13F | Northwestern Mutual Wealth Management Co | 734,473 | 30.07 | 26,177 | 42.25 | ||||
| 2025-05-12 | 13F | Independent Advisor Alliance | 0 | -100.00 | 0 | |||||
| 2025-07-25 | 13F | Atria Wealth Solutions, Inc. | 0 | -100.00 | 0 | |||||
| 2025-07-22 | 13F | Valley National Advisers Inc | 0 | -100.00 | 0 | |||||
| 2025-08-12 | 13F | Titleist Asset Management, Llc | 20,548 | -20.92 | 732 | -13.48 | ||||
| 2025-05-06 | 13F | PFG Advisors | 0 | -100.00 | 0 | |||||
| 2025-08-12 | 13F | Coldstream Capital Management Inc | 0 | -100.00 | 0 | |||||
| 2025-08-12 | 13F | Jpmorgan Chase & Co | 14,395 | 23.36 | 513 | 35.00 | ||||
| 2025-08-14 | 13F | Visionary Wealth Advisors | 81,671 | 2,911 | ||||||
| 2025-08-14 | 13F | Wells Fargo & Company/mn | 288 | 28,700.00 | 10 | |||||
| 2025-08-14 | 13F | Stifel Financial Corp | 242,446 | 18.89 | 8,641 | 30.02 | ||||
| 2025-08-04 | 13F | Savvy Advisors, Inc. | 13,146 | -2.81 | 469 | 6.36 | ||||
| 2025-08-04 | 13F | Atria Investments Llc | 6,164 | 220 | ||||||
| 2025-08-07 | 13F | Winch Advisory Services, LLC | 246 | 0.00 | 9 | 0.00 | ||||
| 2025-08-19 | 13F | Advisory Services Network, LLC | 5,842 | 205 | ||||||
| 2025-07-17 | 13F | Nelson, Van Denburg & Campbell Wealth Management Group, LLC | 6,157 | 0.00 | 219 | 9.50 | ||||
| 2025-08-11 | 13F | Ritter Daniher Financial Advisory LLC / DE | 2 | 0 | ||||||
| 2025-07-22 | 13F | Integrated Capital Management, LLC | 303,380 | 5.50 | 11 | 11.11 | ||||
| 2025-08-13 | 13F | Lido Advisors, LLC | 24,781 | 22.14 | 883 | 33.59 | ||||
| 2025-07-29 | 13F | Fundamentun, Llc | 15,964 | 569 | ||||||
| 2025-07-10 | 13F | Redhawk Wealth Advisors, Inc. | 8,244 | 1.80 | 294 | 11.41 | ||||
| 2025-08-08 | 13F | Empower Advisory Group, LLC | 11,489 | 0.00 | 409 | 9.36 | ||||
| 2025-08-11 | 13F | Slagle Financial, LLC | 37,316 | 17.05 | 1,330 | 28.03 | ||||
| 2025-07-29 | 13F | Goldstein Advisors, LLC | 16,796 | -0.55 | 599 | 8.73 | ||||
| 2025-07-16 | 13F | Owen LaRue, LLC | 107,419 | -0.51 | 3,828 | 8.81 | ||||
| 2025-07-31 | 13F | Hartford Financial Management Inc. | 1,946 | -19.52 | 69 | -11.54 | ||||
| 2025-07-14 | 13F | Sowell Financial Services LLC | 34,611 | 15.64 | 1,234 | 26.46 | ||||
| 2025-08-14 | 13F | Jane Street Group, Llc | 381,022 | 1.14 | 13,580 | 10.61 | ||||
| 2025-07-16 | 13F | Novem Group | 58,601 | -2.50 | 2,089 | 6.64 | ||||
| 2025-08-14 | 13F | Susquehanna International Group, Llp | 0 | -100.00 | 0 | |||||
| 2025-08-01 | 13F | Envestnet Asset Management Inc | 210,825 | 41.08 | 7,514 | 54.27 | ||||
| 2025-08-14 | 13F | Betterment LLC | 9,397 | -3.89 | 0 | |||||
| 2025-08-07 | 13F | Allworth Financial LP | 350 | 0.86 | 12 | 9.09 | ||||
| 2025-08-14 | 13F | Raymond James Financial Inc | 752,548 | 35.11 | 26,821 | 47.75 | ||||
| 2025-07-29 | 13F | Tradewinds Capital Management, LLC | 0 | -100.00 | 0 | |||||
| 2025-07-31 | 13F | CAP Partners, LLC | 19,468 | 6.45 | 694 | 16.28 | ||||
| 2025-08-12 | 13F | Cornerstone Wealth Management, LLC | 26,107 | 3.44 | 930 | 13.14 | ||||
| 2025-07-25 | 13F | Evolution Advisers, Inc. | 2 | 0.00 | 0 | |||||
| 2025-08-14 | 13F | Ameriprise Financial Inc | 91,711 | 79.71 | 3,269 | 96.63 | ||||
| 2025-07-28 | 13F | RFG Advisory, LLC | 30,441 | 19.17 | 1,085 | 30.29 | ||||
| 2025-07-17 | 13F | Prepared Retirement Institute LLC | 114,223 | 1.24 | 4,071 | 10.72 | ||||
| 2025-08-12 | 13F | Steward Partners Investment Advisory, Llc | 56,240 | 99.33 | 2,004 | 118.06 | ||||
| 2025-08-14 | 13F | GWM Advisors LLC | 683,764 | 3.83 | 24,369 | 13.55 | ||||
| 2025-07-10 | 13F | Exchange Traded Concepts, Llc | 874 | 31 | ||||||
| 2025-08-14 | 13F | CoreCap Advisors, LLC | 959 | 0.00 | 34 | 9.68 | ||||
| 2025-08-13 | 13F | Royal Fund Management, LLC | 16,083 | -1.06 | 573 | 8.32 | ||||
| 2025-05-13 | 13F | UBS Group AG | 0 | -100.00 | 0 | |||||
| 2025-07-07 | 13F | Whitaker-Myers Wealth Managers, LTD. | 22,018 | 9.44 | 785 | 19.69 | ||||
| 2025-08-11 | 13F | Principal Securities, Inc. | 3,608 | -3.24 | 129 | 15.32 | ||||
| 2025-08-08 | 13F | Avantax Advisory Services, Inc. | 24,882 | 14.91 | 887 | 25.67 | ||||
| 2025-07-29 | 13F | Private Trust Co Na | 7,926 | -0.60 | 282 | 8.88 | ||||
| 2025-07-29 | 13F | LMG Wealth Partners, LLC | 249,684 | 2.31 | 8,899 | 11.88 | ||||
| 2025-08-08 | 13F | Crossmark Global Holdings, Inc. | 12,167 | 1.82 | 432 | 11.95 | ||||
| 2025-08-08 | 13F | Thoroughbred Financial Services, Llc | 131,978 | -38.81 | 5 | -42.86 | ||||
| 2025-07-11 | 13F | OxenFree Capital LLC | 47,594 | 0.03 | 1,696 | 10.78 | ||||
| 2025-08-12 | 13F | Change Path, LLC | 69,655 | 6.12 | 2,482 | 16.04 | ||||
| 2025-08-18 | 13F | Geneos Wealth Management Inc. | 250 | 0.00 | 9 | 0.00 | ||||
| 2025-07-02 | 13F | HBW Advisory Services LLC | 45,253 | 230.80 | 1,613 | 262.25 | ||||
| 2025-07-24 | 13F | Ronald Blue Trust, Inc. | 250 | 0.00 | 9 | 0.00 | ||||
| 2025-08-08 | 13F | Capital Investment Advisory Services, LLC | 70 | 0.00 | 2 | 0.00 | ||||
| 2025-08-14 | 13F | Great Valley Advisor Group, Inc. | 20,616 | 96.03 | 734 | 113.99 | ||||
| 2025-07-29 | 13F | Koshinski Asset Management, Inc. | 353,793 | 14.01 | 12,609 | 24.68 | ||||
| 2025-08-27 | 13F | Barnes Wealth Management Group, Inc | 7,759 | -2.22 | 277 | 6.98 | ||||
| 2025-07-30 | 13F | Castle Wealth Management Llc | 127,160 | 2.09 | 4,532 | 11.63 | ||||
| 2025-09-04 | 13F/A | Advisor Group Holdings, Inc. | 107,454 | 6.16 | 3,830 | 16.10 | ||||
| 2025-08-05 | 13F | Bank of New York Mellon Corp | 261,023 | 46.17 | 9,303 | 59.86 | ||||
| 2025-08-13 | 13F | Flow Traders U.s. Llc | 65,452 | -32.04 | 2 | -33.33 | ||||
| 2025-07-09 | 13F | Defined Wealth Management, Llc | 119,474 | -1.28 | 4,258 | 7.96 | ||||
| 2025-07-30 | 13F | Crewe Advisors LLC | 1,592 | 57 | ||||||
| 2025-08-07 | 13F | AllGen Financial Advisors, Inc. | 303,123 | 10,803 | ||||||
| 2025-07-14 | 13F | AdvisorNet Financial, Inc | 3,010 | 0.00 | 107 | 9.18 | ||||
| 2025-07-16 | 13F | Highline Wealth Partners Llc | 0 | -100.00 | 0 | |||||
| 2025-07-18 | 13F | Midwest Financial Group LLC | 34,511 | 94.26 | 1,230 | 112.63 | ||||
| 2025-08-12 | 13F | Global Retirement Partners, LLC | 1,208 | 1,489.47 | 43 | 2,050.00 | ||||
| 2025-08-27 | 13F/A | Brinker Capital Investments, LLC | 45,903 | 0.04 | 1,636 | 9.36 | ||||
| 2025-08-12 | 13F | Absolute Capital Management, LLC | 45,000 | 0.00 | 1,604 | 9.35 | ||||
| 2025-06-11 | 13F | Fortitude Financial, LLC | 29,225 | 0.00 | 952 | 8.55 | ||||
| 2025-08-15 | 13F | Equitable Holdings, Inc. | 136,352 | 8.50 | 4,860 | 18.66 | ||||
| 2025-07-16 | 13F | Meridian Financial, LLC | 11,714 | 9.04 | 417 | 19.14 | ||||
| 2025-07-14 | 13F | Southland Equity Partners LLC | 40,423 | 6.45 | 1,441 | 16.41 | ||||
| 2025-04-28 | 13F | Financial Advocates Investment Management | 0 | -100.00 | 0 | |||||
| 2025-07-17 | 13F | Janney Montgomery Scott LLC | 117,339 | -29.23 | 4 | -20.00 | ||||
| 2025-07-23 | 13F | TriaGen Wealth Management LLC | 468,136 | 13.33 | 16,684 | 23.93 | ||||
| 2025-04-21 | 13F | Envestnet Portfolio Solutions, Inc. | 0 | -100.00 | 0 | |||||
| 2025-04-28 | 13F | Smart Money Group LLC | 0 | -100.00 | 0 | |||||
| 2025-08-19 | 13F | Cape Investment Advisory, Inc. | 1,316 | 0.00 | 47 | 9.52 | ||||
| 2025-07-28 | 13F | Mutual Advisors, LLC | 106,332 | 0.83 | 3,859 | 9.20 | ||||
| 2025-08-11 | 13F | Private Advisor Group, LLC | 97,106 | -34.76 | 3,461 | -28.66 | ||||
| 2025-08-13 | 13F | Capital Analysts, Inc. | 1,335,749 | 116.33 | 48 | 135.00 | ||||
| 2025-08-08 | 13F | Cetera Investment Advisers | 636,711 | 9.51 | 22,692 | 19.76 | ||||
| 2025-08-12 | 13F | O'shaughnessy Asset Management, Llc | 391 | 14 | ||||||
| 2025-08-05 | 13F | Sigma Planning Corp | 5,943 | 212 | ||||||
| 2025-08-28 | NP | AAMAX - Absolute Capital Asset Allocator Fund Class A Shares | 45,000 | 0.00 | 1,604 | 9.35 | ||||
| 2025-07-18 | 13F | Truist Financial Corp | 8,228 | 293 | ||||||
| 2025-05-15 | 13F/A | Orion Portfolio Solutions, LLC | 45,886 | 1.38 | 1,495 | 10.09 | ||||
| 2025-08-05 | 13F | BCGM Wealth Management, LLC | 12,610 | -88.09 | 449 | -86.99 | ||||
| 2025-08-14 | 13F | Citadel Advisors Llc | 73,294 | 661.10 | 2,612 | 734.50 | ||||
| 2025-08-07 | 13F | Kestra Private Wealth Services, Llc | 449,890 | 10.18 | 16,034 | 20.49 | ||||
| 2025-07-30 | 13F | Retirement Planning Group | 4,475,833 | 5.09 | 159,519 | 14.93 | ||||
| 2025-07-31 | 13F | Oppenheimer & Co Inc | 59,880 | 0.44 | 2,134 | 9.89 | ||||
| 2025-08-15 | 13F | Kestra Advisory Services, LLC | 226,501 | 14.61 | 8,072 | 25.34 | ||||
| 2025-08-14 | 13F | Mariner, LLC | 432,808 | -15.70 | 15,425 | -7.81 | ||||
| 2025-08-15 | 13F | Koesten, Hirschmann & Crabtree, INC. | 20 | 0.00 | 1 | |||||
| 2025-08-07 | 13F | Legacy Financial Advisors, Inc. | 877,208 | 2.02 | 31,264 | 11.56 | ||||
| 2025-07-03 | 13F | First Hawaiian Bank | 139,987 | 41.79 | 4,989 | 55.08 | ||||
| 2025-07-21 | 13F | Ameritas Advisory Services, LLC | 1,963 | 70 | ||||||
| 2025-08-04 | 13F | Flagship Harbor Advisors, Llc | 404,307 | -0.39 | 14,409 | 8.93 | ||||
| 2025-07-31 | 13F | Cambridge Investment Research Advisors, Inc. | 228,842 | -74.01 | 8 | -71.43 | ||||
| 2025-08-14 | 13F | Wiley Bros.-aintree Capital, Llc | 141,930 | 99.58 | 5,058 | 116.62 | ||||
| 2025-08-15 | 13F | Cornerstone Financial Group, LLC /NE/ | 7,441 | 0.45 | 265 | 4.33 | ||||
| 2025-08-14 | 13F | Comerica Bank | 2,960 | -9.40 | 105 | -0.94 | ||||
| 2025-08-08 | 13F | Emerald Investment Partners, Llc | 5,276 | 1.00 | 188 | 10.59 | ||||
| 2025-07-11 | 13F | Farther Finance Advisors, LLC | 1,187 | 1.80 | 42 | 10.53 | ||||
| 2025-08-12 | 13F | Vickerman Investment Advisors, Inc. | 354,086 | 6.80 | 12,620 | 16.79 | ||||
| 2025-08-26 | NP | FTRAX - Franklin LifeSmart Retirement Income Fund CLASS A | 40,500 | -1.70 | 1,443 | 7.53 | ||||
| 2025-08-14 | 13F | Clark Capital Management Group, Inc. | 26,113 | 0.00 | 931 | 9.28 | ||||
| 2025-08-15 | 13F/A | MONECO Advisors, LLC | 0 | -100.00 | 0 | -100.00 | ||||
| 2025-07-23 | 13F | Godsey & Gibb Associates | 0 | -100.00 | 0 | -100.00 | ||||
| 2025-08-12 | 13F | J.w. Cole Advisors, Inc. | 19,296 | 0.07 | 688 | 9.39 | ||||
| 2025-08-12 | 13F | Franklin Resources Inc | 40,966 | -1.75 | 1,460 | 7.51 | ||||
| 2025-08-06 | 13F | Prospera Financial Services Inc | 38,217 | -0.26 | 1,362 | 9.05 | ||||
| 2025-08-07 | 13F | Blackston Financial Advisory Group, LLC | 10,550 | -9.32 | 376 | -0.79 | ||||
| 2025-08-14 | 13F | Sunbelt Securities, Inc. | 85 | 0.00 | 3 | 0.00 | ||||
| 2025-08-26 | 13F/A | Thrivent Financial For Lutherans | 87,614 | 3 |