Mga Batayang Estadistika
| Pemilik Institusional | 181 total, 181 long only, 0 short only, 0 long/short - change of 7.10% MRQ |
| Alokasi Portofolio Rata-rata | 0.2026 % - change of -11.53% MRQ |
| Saham Institusional (Jangka Panjang) | 16,008,501 (ex 13D/G) - change of 0.71MM shares 4.66% MRQ |
| Nilai Institusional (Jangka Panjang) | $ 841,720 USD ($1000) |
Kepemilikan Institusional dan Pemegang Saham
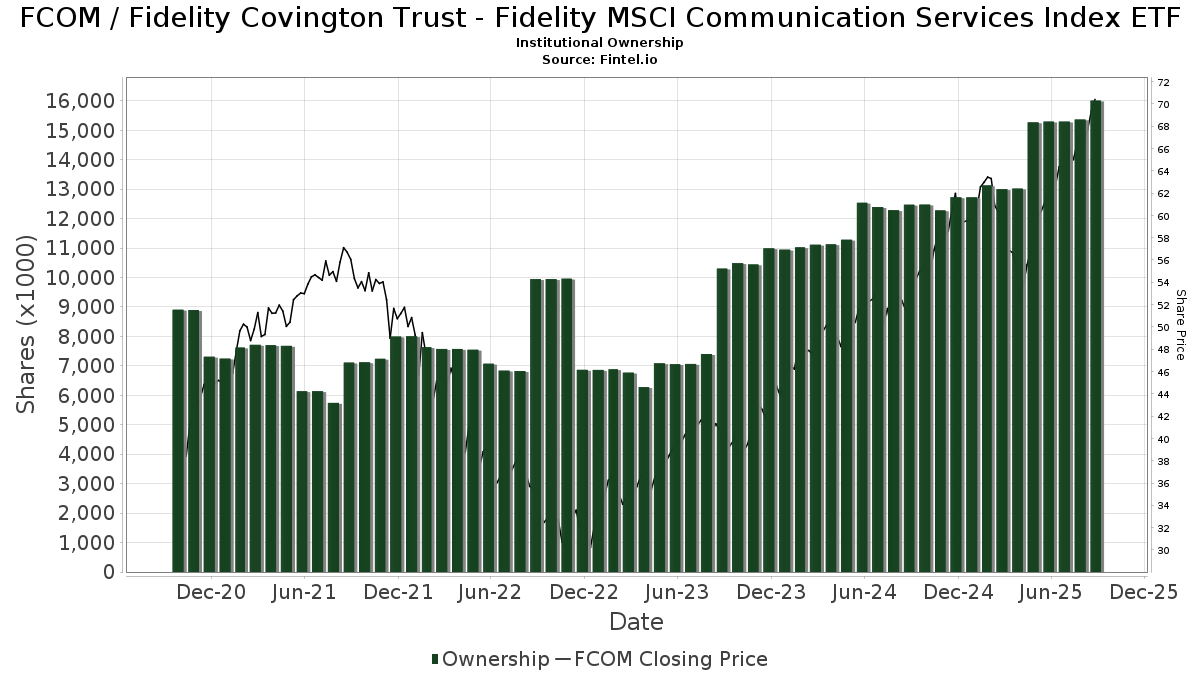
Fidelity Covington Trust - Fidelity MSCI Communication Services Index ETF (US:FCOM) memiliki 181 pemilik institusional dan pemegang saham yang telah mengajukan formulir 13D/G atau 13F kepada Komisi Bursa Efek (Securities Exchange Commission/SEC). Lembaga-lembaga ini memegang total 16,008,501 saham. Pemegang saham terbesar meliputi Charles Schwab Investment Management Inc, Harel Insurance Investments & Financial Services Ltd., Lido Advisors, LLC, Northwestern Mutual Wealth Management Co, Agf Management Ltd, Morgan Stanley, Vicus Capital, Wells Fargo & Company/mn, Commonwealth Equity Services, Llc, and LPL Financial LLC .
Struktur kepemilikan institusional Fidelity Covington Trust - Fidelity MSCI Communication Services Index ETF (ARCA:FCOM) menunjukkan posisi terkini di perusahaan oleh institusi dan dana, serta perubahan terbaru dalam ukuran posisi. Pemegang saham utama dapat mencakup investor individu, reksa dana, dana lindung nilai, atau institusi. Jadwal 13D menunjukkan bahwa investor memegang (atau pernah memegang) lebih dari 5% saham perusahaan dan bermaksud (atau pernah bermaksud) untuk secara aktif mengejar perubahan strategi bisnis. Jadwal 13G menunjukkan investasi pasif lebih dari 5%.
The share price as of September 5, 2025 is 70.28 / share. Previously, on September 6, 2024, the share price was 50.62 / share. This represents an increase of 38.84% over that period.
Skor Sentimen Dana
Skor Sentimen Dana (sebelumnya dikenal sebagai Skor Akumulasi Kepemilikan) menemukan saham-saham yang paling banyak dibeli oleh dana. Ini adalah hasil dari model kuantitatif multi-faktor yang canggih yang mengidentifikasi perusahaan dengan tingkat akumulasi institusional tertinggi. Model penilaian menggunakan kombinasi dari total peningkatan pemilik yang diungkapkan, perubahan dalam alokasi portofolio pada pemilik tersebut, dan metrik lainnya. Angka berkisar dari 0 hingga 100, dengan angka yang lebih tinggi menunjukkan tingkat akumulasi yang lebih tinggi dibandingkan dengan perusahaan sejenisnya, dan 50 adalah rata-ratanya.
Frekuensi Pembaruan: Setiap Hari
Lihat Ownership Explorer, yang menyediakan daftar perusahaan dengan peringkat tertinggi.
Rasio Put/Call Institusional
Selain melaporkan isu ekuitas dan utang standar, institusi dengan aset di bawah manajemen lebih dari 100 juta dolar AS juga harus mengungkapkan kepemilikan opsi put dan call mereka. Karena opsi put umumnya menunjukkan sentimen negatif, dan opsi call menunjukkan sentimen positif, kita dapat mengetahui sentimen institusional secara keseluruhan dengan memplot rasio put terhadap call. Grafik di sebelah kanan memplot rasio put/call historis untuk instrumen ini.
Menggunakan Rasio Put/Call sebagai indikator sentimen investor mengatasi salah satu kekurangan utama dari penggunaan total kepemilikan institusional, yaitu sejumlah besar aset yang dikelola diinvestasikan secara pasif untuk melacak indeks. Dana yang dikelola secara pasif biasanya tidak membeli opsi, sehingga indikator rasio put/call lebih akurat dalam melacak sentimen dana yang dikelola secara aktif.
Pengajuan 13F dan NPORT
Detail pada pengajuan 13F tersedia gratis. Detail pada pengajuan NP memerlukan keanggotaan premium. Baris berwarna hijau menunjukkan posisi baru. Baris berwarna merah menunjukkan posisi yang sudah ditutup. Klik tautan ini ikon untuk melihat riwayat transaksi selengkapnya.
Tingkatkan
untuk membuka data premium dan mengekspor ke Excel ![]() .
.
| Tanggal File | Sumber | Investor | Ketik | Presyo ng Avg (Silangan) |
Saham | Δ Saham (%) |
Dilaporkan Nilai ($1000) |
Nilai Δ (%) |
Alokasi Port (%) |
|
|---|---|---|---|---|---|---|---|---|---|---|
| 2025-05-12 | 13F | Founders Financial Securities Llc | 0 | -100.00 | 0 | |||||
| 2025-04-29 | 13F | Element Wealth, LLC | 0 | -100.00 | 0 | |||||
| 2025-05-15 | 13F | Minot DeBlois Advisors LLC | 0 | -100.00 | 0 | |||||
| 2025-08-14 | 13F | Full Sail Capital, LLC | 234,794 | -2.38 | 15,217 | 12.45 | ||||
| 2025-08-14 | 13F | GWM Advisors LLC | 9,204 | -1.60 | 597 | 13.31 | ||||
| 2025-07-17 | 13F | Janney Montgomery Scott LLC | 67,249 | 15.96 | 4 | 33.33 | ||||
| 2025-08-04 | 13F | Creative Financial Designs Inc /adv | 1,223 | 0.00 | 79 | 16.18 | ||||
| 2025-08-08 | 13F | Capital Investment Advisory Services, LLC | 74 | 0.00 | 5 | 0.00 | ||||
| 2025-07-21 | 13F | Ameritas Advisory Services, LLC | 68 | 4 | ||||||
| 2025-08-12 | 13F | Coldstream Capital Management Inc | 0 | -100.00 | 0 | |||||
| 2025-08-12 | 13F | Integrated Advisors Network LLC | 7,230 | -38.14 | 469 | -28.77 | ||||
| 2025-08-14 | 13F | Fmr Llc | 26,237 | 21.59 | 1,700 | 40.03 | ||||
| 2025-08-01 | 13F | Envestnet Asset Management Inc | 47,388 | -56.78 | 3,071 | -50.21 | ||||
| 2025-08-07 | 13F | Kestra Private Wealth Services, Llc | 32,244 | 2.19 | 2,090 | 17.69 | ||||
| 2025-08-14 | 13F | Snowden Capital Advisors LLC | 24,646 | -7.55 | 1,597 | 6.54 | ||||
| 2025-08-12 | 13F | Charles Schwab Investment Management Inc | 4,421,397 | -1.07 | 286,551 | 13.97 | ||||
| 2025-08-12 | 13F | Howe & Rusling Inc | 363 | 24 | ||||||
| 2025-08-14 | 13F | Quantinno Capital Management LP | 4,783 | 25.87 | 310 | 45.07 | ||||
| 2025-07-02 | 13F | Crumly & Associates Inc. | 123,933 | 11.17 | 8,032 | 28.08 | ||||
| 2025-08-14 | 13F | Stifel Financial Corp | 146,682 | -5.37 | 9,507 | 9.01 | ||||
| 2025-07-30 | 13F | Retirement Planning Group | 0 | -100.00 | 0 | |||||
| 2025-07-14 | 13F | AdvisorNet Financial, Inc | 679 | 0.30 | 44 | 13.16 | ||||
| 2025-04-30 | 13F | Personal Cfo Solutions, Llc | 0 | -100.00 | 0 | -100.00 | ||||
| 2025-07-17 | 13F | Wolff Wiese Magana Llc | 69 | 0.00 | 4 | 33.33 | ||||
| 2025-08-01 | 13F | Ashton Thomas Private Wealth, LLC | 9,650 | 0.35 | 625 | 15.74 | ||||
| 2025-08-07 | 13F | Allworth Financial LP | 486 | -38.87 | 31 | -27.91 | ||||
| 2025-07-14 | 13F | Mechanics Bank Trust Department | 23,816 | -3.05 | 1,544 | 11.65 | ||||
| 2025-07-16 | 13F | Fischer Financial Services, Inc. | 106,462 | 0.17 | 6,878 | 15.04 | ||||
| 2025-04-23 | 13F | Oppenheimer & Co Inc | 0 | -100.00 | 0 | -100.00 | ||||
| 2025-08-14 | 13F | Sunbelt Securities, Inc. | 2,356 | -0.13 | 138 | 4.55 | ||||
| 2025-07-16 | 13F | Brown, Lisle/cummings, Inc. | 43 | 0.00 | 3 | 0.00 | ||||
| 2025-07-23 | 13F | Pillar Financial Advisors, LLC | 97 | 0.00 | 6 | 20.00 | ||||
| 2025-09-04 | 13F/A | Advisor Group Holdings, Inc. | 72,479 | -23.28 | 4,709 | -11.55 | ||||
| 2025-08-06 | 13F | Soltis Investment Advisors LLC | 11,538 | -0.62 | 748 | 14.40 | ||||
| 2025-05-15 | 13F/A | Orion Portfolio Solutions, LLC | 46,461 | 0.14 | 2,614 | -4.04 | ||||
| 2025-08-12 | 13F | Jpmorgan Chase & Co | 20,710 | 155.90 | 1,342 | 194.95 | ||||
| 2025-08-15 | 13F | Kestra Advisory Services, LLC | 164,073 | 8.88 | 10,634 | 25.42 | ||||
| 2025-08-08 | 13F | Pnc Financial Services Group, Inc. | 128 | 8 | ||||||
| 2025-08-12 | 13F | Steward Partners Investment Advisory, Llc | 48,305 | 150,853.12 | 3,131 | 312,900.00 | ||||
| 2025-07-16 | 13F | Southern Capital Advisors, Llc | 77,730 | -0.22 | 5,038 | 14.95 | ||||
| 2025-04-25 | 13F | Colonial River Wealth Management, LLC | 0 | -100.00 | 0 | |||||
| 2025-07-22 | 13F | Yoder Wealth Management, Inc. | 76,265 | 5.20 | 4,943 | 21.19 | ||||
| 2025-05-14 | 13F | BOK Financial Private Wealth, Inc. | 0 | -100.00 | 0 | |||||
| 2025-07-31 | 13F | Cambridge Investment Research Advisors, Inc. | 90,418 | 35.70 | 6 | 66.67 | ||||
| 2025-07-29 | 13F | Stratos Wealth Partners, LTD. | 4,710 | -19.31 | 305 | -7.01 | ||||
| 2025-05-15 | 13F | Hrt Financial Lp | 0 | -100.00 | 0 | |||||
| 2025-07-31 | 13F | Moment Partners, LLC | 3,228 | -12.92 | 209 | 0.48 | ||||
| 2025-08-13 | 13F | KDK Private Wealth Management, LLC | 20,669 | -2.11 | 1,339 | 12.90 | ||||
| 2025-07-24 | 13F | Live Oak Investment Partners | 15,964 | 10.53 | 1,035 | 27.34 | ||||
| 2025-04-25 | 13F | Red Tortoise LLC | 0 | -100.00 | 0 | |||||
| 2025-07-30 | 13F | Gables Capital Management Inc. | 662 | 0.00 | 43 | 13.51 | ||||
| 2025-05-09 | 13F | CoreCap Advisors, LLC | 0 | -100.00 | 0 | |||||
| 2025-04-23 | 13F | Gimbal Financial | 0 | -100.00 | 0 | -100.00 | ||||
| 2025-08-06 | 13F | Agf Management Ltd | 632,275 | 10.62 | 40,978 | 27.43 | ||||
| 2025-07-16 | 13F | Signature Resources Capital Management, LLC | 624 | 40 | ||||||
| 2025-08-08 | 13F | Cetera Investment Advisers | 17,034 | -19.04 | 1,104 | -6.76 | ||||
| 2025-07-18 | 13F | Bartlett & Co. Wealth Management Llc | 39 | 0.00 | 3 | 0.00 | ||||
| 2025-04-29 | 13F | Lee Danner & Bass Inc | 0 | -100.00 | 0 | -100.00 | ||||
| 2025-07-16 | 13F | Badgley Phelps Wealth Managers, LLC | 5,316 | 0.00 | 345 | 15.05 | ||||
| 2025-08-12 | 13F | O'shaughnessy Asset Management, Llc | 3,339 | -7.38 | 216 | 6.93 | ||||
| 2025-07-31 | 13F | Moser Wealth Advisors, LLC | 171 | 11 | ||||||
| 2025-08-08 | 13F | Meridian Wealth Management, LLC | 12,599 | 1.03 | 817 | 16.41 | ||||
| 2025-08-05 | 13F | Beckerman Institutional, LLC | 22,107 | -4.92 | 1 | 0.00 | ||||
| 2025-08-14 | 13F | Jane Street Group, Llc | 0 | -100.00 | 0 | |||||
| 2025-08-12 | 13F | Leigh Baldwin & Co., Llc | 4,181 | 0.05 | 271 | 14.89 | ||||
| 2025-07-16 | 13F | RWM Asset Management, LLC | 194,911 | 4.60 | 12,632 | 20.50 | ||||
| 2025-07-17 | 13F | Independence Bank of Kentucky | 70 | -56.25 | 5 | -55.56 | ||||
| 2025-08-05 | 13F | Sigma Planning Corp | 15,010 | -21.79 | 973 | -9.92 | ||||
| 2025-08-13 | 13F | Jones Financial Companies Lllp | 13,903 | 1.99 | 896 | 17.43 | ||||
| 2025-08-15 | 13F | Tower Research Capital LLC (TRC) | 4,721 | 306 | ||||||
| 2025-08-12 | 13F | Proequities, Inc. | 0 | 0 | ||||||
| 2025-07-25 | 13F | Apollon Wealth Management, LLC | 7,774 | -4.12 | 504 | 10.31 | ||||
| 2025-08-08 | 13F | Crossmark Global Holdings, Inc. | 15,283 | 0.00 | 990 | 15.25 | ||||
| 2025-08-14 | 13F | UBS Group AG | 74,709 | 3.55 | 4,842 | 19.27 | ||||
| 2025-08-14 | 13F | Susquehanna International Group, Llp | 39,443 | 275.11 | 2,556 | 332.49 | ||||
| 2025-08-05 | 13F | Harel Insurance Investments & Financial Services Ltd. | 2,484,280 | 22.67 | 161 | 42.48 | ||||
| 2025-05-09 | 13F | Pathway Financial Advisers, LLC | 0 | -100.00 | 0 | |||||
| 2025-07-16 | 13F/A | CX Institutional | 19,815 | 12.19 | 1 | |||||
| 2025-08-04 | 13F | Creekmur Asset Management LLC | 1 | 0.00 | 0 | |||||
| 2025-08-06 | 13F | Golden State Wealth Management, LLC | 12 | 1 | ||||||
| 2025-04-23 | 13F | Mascagni Wealth Management, Inc. | 0 | -100.00 | 0 | -100.00 | ||||
| 2025-08-12 | 13F | AlphaCore Capital LLC | 162 | 10 | ||||||
| 2025-08-12 | 13F | SRS Capital Advisors, Inc. | 428 | 28 | ||||||
| 2025-07-30 | 13F | Pacific Sun Financial Corp | 19,406 | 2.09 | 1,258 | 17.59 | ||||
| 2025-08-05 | 13F | Dunhill Financial, LLC | 109 | 0.00 | 7 | 16.67 | ||||
| 2025-07-23 | 13F | Elm3 Financial Group, LLC | 7,263 | 471 | ||||||
| 2025-08-12 | 13F | CIBC Private Wealth Group, LLC | 64 | 0.00 | 4 | 33.33 | ||||
| 2025-07-10 | 13F | Charter Oak Capital Management, LLC | 6,265 | -20.08 | 406 | -7.94 | ||||
| 2025-08-13 | 13F | Quadrature Capital Ltd | 0 | -100.00 | 0 | |||||
| 2025-08-08 | 13F | Financial Gravity Companies, Inc. | 151 | 10 | ||||||
| 2025-07-24 | 13F | IFP Advisors, Inc | 699 | 0.00 | 45 | 15.38 | ||||
| 2025-08-19 | 13F | Advisory Services Network, LLC | 11,340 | -82.98 | 752 | -79.96 | ||||
| 2025-08-14 | 13F | Wells Fargo & Company/mn | 269,359 | -5.18 | 17,457 | 9.23 | ||||
| 2025-08-11 | 13F | Capital Square, LLC | 3,365 | -23.07 | 215 | -12.60 | ||||
| 2025-08-12 | 13F | Guerra Advisors Inc | 129,640 | -25.59 | 8,402 | -14.29 | ||||
| 2025-08-14 | 13F | Raymond James Financial Inc | 49,361 | 0.57 | 3,199 | 15.86 | ||||
| 2025-04-23 | 13F | Aspetuck Financial Management LLC | 0 | -100.00 | 0 | -100.00 | ||||
| 2025-08-14 | 13F | Citadel Advisors Llc | 0 | -100.00 | 0 | |||||
| 2025-05-09 | 13F | Legacy Capital Group California, Inc. | 0 | -100.00 | 0 | |||||
| 2025-08-14 | 13F | Kovitz Investment Group Partners, LLC | 65,963 | 44.84 | 4,275 | 66.86 | ||||
| 2025-08-05 | 13F | Lifeworks Advisors, LLC | 31,567 | 0.34 | 2,046 | 15.60 | ||||
| 2025-08-14 | 13F | Federation des caisses Desjardins du Quebec | 922 | 60 | ||||||
| 2025-07-28 | 13F | Rosenberg Matthew Hamilton | 3,110 | 0.00 | 202 | 15.52 | ||||
| 2025-07-29 | 13F | Private Trust Co Na | 24 | 26.32 | 2 | 0.00 | ||||
| 2025-08-13 | 13F | Marshall Wace, Llp | 3,218 | -86.08 | 209 | -84.00 | ||||
| 2025-08-14 | 13F | Boston Private Wealth Llc | 3,342 | 217 | ||||||
| 2025-07-22 | 13F | Grimes & Company, Inc. | 21,192 | 1,373 | ||||||
| 2025-07-18 | 13F | Trust Co Of Vermont | 0 | -100.00 | 0 | |||||
| 2025-07-14 | 13F | GAMMA Investing LLC | 132 | 0.00 | 9 | 14.29 | ||||
| 2025-07-25 | 13F | Atria Wealth Solutions, Inc. | 17,298 | -41.29 | 1,121 | -32.41 | ||||
| 2025-08-26 | 13F/A | Thrivent Financial For Lutherans | 38,103 | 2 | ||||||
| 2025-07-24 | 13F | Court Place Advisors, LLC | 16,805 | 1.22 | 1,089 | 16.60 | ||||
| 2025-05-01 | 13F | Q3 Asset Management | 0 | -100.00 | 0 | |||||
| 2025-08-12 | 13F | Global Retirement Partners, LLC | 187 | -44.01 | 12 | -36.84 | ||||
| 2025-07-17 | 13F | Fifth Third Securities, Inc. | 16,816 | 0.17 | 1,090 | 15.36 | ||||
| 2025-08-06 | 13F | New Millennium Group LLC | 727 | 38.21 | 47 | 62.07 | ||||
| 2025-07-24 | 13F | Blair William & Co/il | 557 | 24.33 | 36 | 44.00 | ||||
| 2025-08-11 | 13F | Aptus Capital Advisors, LLC | 604 | 0.17 | 39 | 18.18 | ||||
| 2025-08-14 | 13F | Mml Investors Services, Llc | 13,592 | 15.31 | 1 | |||||
| 2025-07-09 | 13F | Bank of New Hampshire | 204 | 0.00 | 13 | 18.18 | ||||
| 2025-07-11 | 13F | Farther Finance Advisors, LLC | 1,186 | 0.25 | 77 | 15.15 | ||||
| 2025-08-27 | 13F/A | Brinker Capital Investments, LLC | 30,448 | -34.47 | 1,973 | -24.49 | ||||
| 2025-08-08 | 13F | Avantax Advisory Services, Inc. | 4,902 | -15.10 | 318 | -2.16 | ||||
| 2025-08-13 | 13F | Hsbc Holdings Plc | 4,392 | -58.97 | 285 | -52.82 | ||||
| 2025-04-09 | 13F | HBW Advisory Services LLC | 0 | -100.00 | 0 | -100.00 | ||||
| 2025-04-23 | 13F | PMV Capital Advisers, LLC | 0 | -100.00 | 0 | |||||
| 2025-07-28 | 13F | Harbour Investments, Inc. | 1,595 | 14.42 | 103 | 32.05 | ||||
| 2025-07-31 | 13F | Sage Mountain Advisors LLC | 1,243 | 0.00 | 81 | 15.94 | ||||
| 2025-08-08 | 13F | Hartland & Co., LLC | 375 | 24 | ||||||
| 2025-08-15 | 13F | Morgan Stanley | 428,311 | 5.45 | 27,759 | 21.48 | ||||
| 2025-05-13 | 13F | Heck Capital Advisors, LLC | 0 | -100.00 | 0 | -100.00 | ||||
| 2025-07-22 | 13F | PUREfi Wealth, LLC | 4,233 | 0.00 | 274 | 15.13 | ||||
| 2025-05-13 | 13F | Adviser Investments LLC | 0 | -100.00 | 0 | |||||
| 2025-08-06 | 13F | AE Wealth Management LLC | 119,757 | 7.28 | 7,761 | 23.58 | ||||
| 2025-08-05 | 13F | EPG Wealth Management LLC | 19,458 | -13.78 | 1,261 | -0.63 | ||||
| 2025-04-10 | 13F | Secure Asset Management, LLC | 0 | -100.00 | 0 | |||||
| 2025-05-14 | 13F | Truvestments Capital Llc | 0 | -100.00 | 0 | |||||
| 2025-08-11 | 13F | HighTower Advisors, LLC | 184,383 | 0.93 | 11,950 | 16.26 | ||||
| 2025-08-11 | 13F | Private Advisor Group, LLC | 4,163 | 0.31 | 270 | 15.45 | ||||
| 2025-07-15 | 13F | Lynch & Associates/in | 25,292 | 3.74 | 1,639 | 19.55 | ||||
| 2025-08-12 | 13F | J.w. Cole Advisors, Inc. | 3,642 | 1.53 | 236 | 17.41 | ||||
| 2025-07-22 | 13F | Merit Financial Group, LLC | 17,524 | -30.58 | 1,136 | -20.07 | ||||
| 2025-07-24 | 13F | Williams & Novak, LLC | 4,573 | -3.48 | 296 | 10.45 | ||||
| 2025-08-14 | 13F | IHT Wealth Management, LLC | 4,807 | 312 | ||||||
| 2025-08-14 | 13F | Bank Of America Corp /de/ | 70,285 | 7.73 | 4,555 | 24.11 | ||||
| 2025-05-12 | 13F | Independent Advisor Alliance | 0 | -100.00 | 0 | |||||
| 2025-08-06 | 13F | Decker Retirement Planning Inc. | 573 | 0.00 | 37 | 15.63 | ||||
| 2025-08-08 | 13F | Independence Financial Advisors, LLC | 146,441 | -8.33 | 9,491 | 5.60 | ||||
| 2025-07-25 | 13F | Cwm, Llc | 200 | 100.00 | 0 | |||||
| 2025-08-12 | 13F | Franklin Resources Inc | 0 | -100.00 | 0 | |||||
| 2025-08-08 | 13F | Creative Planning | 10,702 | 43.79 | 694 | 65.79 | ||||
| 2025-08-04 | 13F | Integrity Alliance, Llc. | 0 | -100.00 | 0 | |||||
| 2025-05-21 | 13F/A | Geneos Wealth Management Inc. | 46 | 3 | ||||||
| 2025-07-16 | 13F | Legend Financial Advisors, Inc. | 283 | 18 | ||||||
| 2025-05-15 | 13F | Prospera Financial Services Inc | 0 | -100.00 | 0 | |||||
| 2025-08-04 | 13F | Arkadios Wealth Advisors | 23,978 | 1.48 | 1,554 | 16.85 | ||||
| 2025-07-28 | 13F | Kiker Wealth Management, LLC | 0 | -100.00 | 0 | |||||
| 2025-07-24 | 13F | Us Bancorp \de\ | 36 | -77.78 | 2 | -77.78 | ||||
| 2025-07-10 | 13F | Wealth Enhancement Advisory Services, Llc | 9,310 | -1.89 | 603 | 13.13 | ||||
| 2025-08-15 | 13F | CI Private Wealth, LLC | 3,113 | 202 | ||||||
| 2025-08-04 | 13F | Assetmark, Inc | 228 | 15 | ||||||
| 2025-08-13 | 13F | Colonial Trust Co / SC | 691 | -24.89 | 45 | -13.73 | ||||
| 2025-08-14 | 13F | Main Street Financial Solutions, LLC | 14,256 | -4.35 | 924 | 10.14 | ||||
| 2025-08-11 | 13F | Brown Brothers Harriman & Co | 8,361 | 243.93 | 542 | 297.79 | ||||
| 2025-07-08 | 13F | Atlas Brown,Inc. | 10,356 | -1.12 | 671 | 13.92 | ||||
| 2025-07-16 | 13F | American National Bank | 12,878 | -1.69 | 835 | 13.16 | ||||
| 2025-08-06 | 13F | Atlantic Union Bankshares Corp | 400 | 26 | ||||||
| 2025-08-13 | 13F | Northwestern Mutual Wealth Management Co | 1,382,346 | 9.42 | 89,590 | 26.05 | ||||
| 2025-08-14 | 13F | Mariner, LLC | 10,338 | 15.61 | 670 | 33.20 | ||||
| 2025-04-24 | 13F | HighMark Wealth Management LLC | 0 | -100.00 | 0 | |||||
| 2025-08-04 | 13F | Savvy Advisors, Inc. | 4,788 | -1.05 | 310 | 13.97 | ||||
| 2025-08-11 | 13F | Anfield Capital Management, LLC | 163 | 185.96 | 11 | 233.33 | ||||
| 2025-08-14 | 13F | Comerica Bank | 2,817 | 0.11 | 183 | 15.19 | ||||
| 2025-05-01 | 13F | Fulcrum Equity Management | 0 | -100.00 | 0 | |||||
| 2025-07-28 | 13F | Copia Wealth Management | 125 | 0.00 | 8 | 14.29 | ||||
| 2025-08-14 | 13F | Royal Bank Of Canada | 11,009 | 0.20 | 714 | 15.53 | ||||
| 2025-05-12 | 13F | Sandy Spring Bank | 400 | 0.00 | 23 | -4.35 | ||||
| 2025-08-12 | 13F | Pathstone Holdings, LLC | 4,491 | 15.54 | 291 | 33.49 | ||||
| 2025-08-06 | 13F | Kcm Investment Advisors Llc | 7,302 | 0.00 | 473 | 15.37 | ||||
| 2025-07-18 | 13F | Vicus Capital | 289,689 | 4.39 | 18,775 | 20.25 | ||||
| 2025-08-06 | 13F | Stonebridge Financial Planning Group, LLC | 16,225 | 3.85 | 1,052 | 19.70 | ||||
| 2025-08-07 | 13F | Birchcreek Wealth Management, LLC | 19,342 | 12.11 | 1,254 | 29.18 | ||||
| 2025-08-13 | 13F | Lido Advisors, LLC | 1,867,729 | 4.49 | 121,048 | 20.37 | ||||
| 2025-05-08 | 13F | Plante Moran Financial Advisors, LLC | 0 | -100.00 | 0 | -100.00 | ||||
| 2025-08-19 | 13F | Asset Dedication, LLC | 334 | 22 | ||||||
| 2025-05-15 | 13F | Mercer Global Advisors Inc /adv | 0 | -100.00 | 0 | |||||
| 2025-08-14 | 13F | Vista Investment Management | 18,037 | 0.51 | 1,169 | 15.76 | ||||
| 2025-08-14 | 13F | Two Sigma Investments, Lp | 43,000 | 2,787 | ||||||
| 2025-08-06 | 13F | Mcrae Capital Management Inc | 3,116 | 202 | ||||||
| 2025-08-14 | 13F | Qube Research & Technologies Ltd | 4,920 | 1,423.22 | 319 | 1,666.67 | ||||
| 2025-08-04 | 13F | Prairie Wealth Advisors, Inc. | 4,166 | 1.21 | 270 | 16.45 | ||||
| 2025-08-12 | 13F | Atlas Capital Advisors Llc | 48,474 | -26.72 | 3,142 | -15.59 | ||||
| 2025-08-15 | 13F | Chapman Financial Group, Llc | 49 | 3 | ||||||
| 2025-07-28 | 13F | Acorn Financial Advisory Services Inc /adv | 5,977 | 31.91 | 387 | 52.36 | ||||
| 2025-07-21 | 13F | Exchange Capital Management, Inc. | 30,879 | -6.30 | 2,001 | 7.99 | ||||
| 2025-07-14 | 13F | Park Avenue Securities Llc | 3,098 | 0 | ||||||
| 2025-07-15 | 13F | Elevated Capital Advisors, LLC | 5,919 | 0.00 | 333 | 0.00 | ||||
| 2025-07-23 | 13F | Kingswood Wealth Advisors, Llc | 8,510 | 5.49 | 552 | 21.63 | ||||
| 2025-08-06 | 13F | Valued Wealth Advisors LLC | 178 | 0.00 | 12 | 10.00 | ||||
| 2025-07-14 | 13F | UMA Financial Services, Inc. | 166 | 0.00 | 11 | 11.11 | ||||
| 2025-07-17 | 13F | Sound Income Strategies, LLC | 546 | 0.00 | 35 | 16.67 | ||||
| 2025-08-12 | 13F | Trexquant Investment LP | 4,845 | 11.56 | 314 | 28.69 | ||||
| 2025-05-14 | 13F | River Wealth Advisors LLC | 0 | -100.00 | 0 | |||||
| 2025-08-13 | 13F | Congress Wealth Management LLC / DE / | 43,008 | 24.61 | 2,787 | 43.59 | ||||
| 2025-07-17 | 13F | Smith, Salley & Associates | 58,636 | 0.18 | 3,800 | 15.43 | ||||
| 2025-05-01 | 13F | High Note Wealth, LLC | 0 | -100.00 | 0 | |||||
| 2025-08-15 | 13F | Equitable Holdings, Inc. | 6,889 | -0.13 | 446 | 14.95 | ||||
| 2025-08-13 | 13F | Russell Investments Group, Ltd. | 189 | 26.85 | 12 | 50.00 | ||||
| 2025-07-30 | 13F | VCI Wealth Management LLC | 21,409 | 7.40 | 1,388 | 23.73 | ||||
| 2025-08-12 | 13F | Nemes Rush Group LLC | 0 | -100.00 | 0 | |||||
| 2025-07-16 | 13F | Beaumont Financial Advisors, LLC | 28,557 | 1,851 | ||||||
| 2025-08-05 | 13F | Bank Of Montreal /can/ | 0 | -100.00 | 0 | |||||
| 2025-08-14 | 13F | Colony Group, LLC | 12,274 | -3.13 | 795 | 11.66 | ||||
| 2025-08-11 | 13F | Citigroup Inc | 26,029 | 40.68 | 1,687 | 62.12 | ||||
| 2025-08-08 | 13F | Smithfield Trust Co | 6,650 | 41.19 | 0 | |||||
| 2025-07-25 | 13F | Envestnet Portfolio Solutions, Inc. | 0 | -100.00 | 0 | |||||
| 2025-07-28 | 13F | Axxcess Wealth Management, Llc | 0 | -100.00 | 0 | |||||
| 2025-08-14 | 13F | LaSalle St. Investment Advisors, LLC | 4,053 | -18.17 | 0 | |||||
| 2025-08-06 | 13F | Maltin Wealth Management, Inc. | 58,061 | 2.03 | 3,763 | 17.53 | ||||
| 2025-08-11 | 13F | Principal Securities, Inc. | 9,184 | 1,166.76 | 595 | 1,316.67 | ||||
| 2025-08-06 | 13F | Commonwealth Equity Services, Llc | 265,779 | 5.26 | 17 | 21.43 | ||||
| 2025-08-12 | 13F | LPL Financial LLC | 241,133 | 32.54 | 15,628 | 52.68 | ||||
| 2025-07-10 | 13F | Sovran Advisors, LLC | 6,256 | 10.61 | 401 | 35.02 | ||||
| 2025-08-01 | 13F | Rossby Financial, LCC | 531 | 0.00 | 34 | 17.24 | ||||
| 2025-08-11 | 13F | Beaumont Capital Management, LLC | 0 | -100.00 | 0 | |||||
| 2025-08-14 | 13F | Ameriprise Financial Inc | 4,280 | 1.21 | 277 | 16.88 | ||||
| 2025-08-11 | 13F | WPG Advisers, LLC | 79 | 0.00 | 5 | 25.00 |