Mga Batayang Estadistika
| Pemilik Institusional | 159 total, 159 long only, 0 short only, 0 long/short - change of 11.19% MRQ |
| Alokasi Portofolio Rata-rata | 0.2102 % - change of -19.74% MRQ |
| Saham Institusional (Jangka Panjang) | 13,820,699 (ex 13D/G) - change of -2.75MM shares -16.60% MRQ |
| Nilai Institusional (Jangka Panjang) | $ 810,335 USD ($1000) |
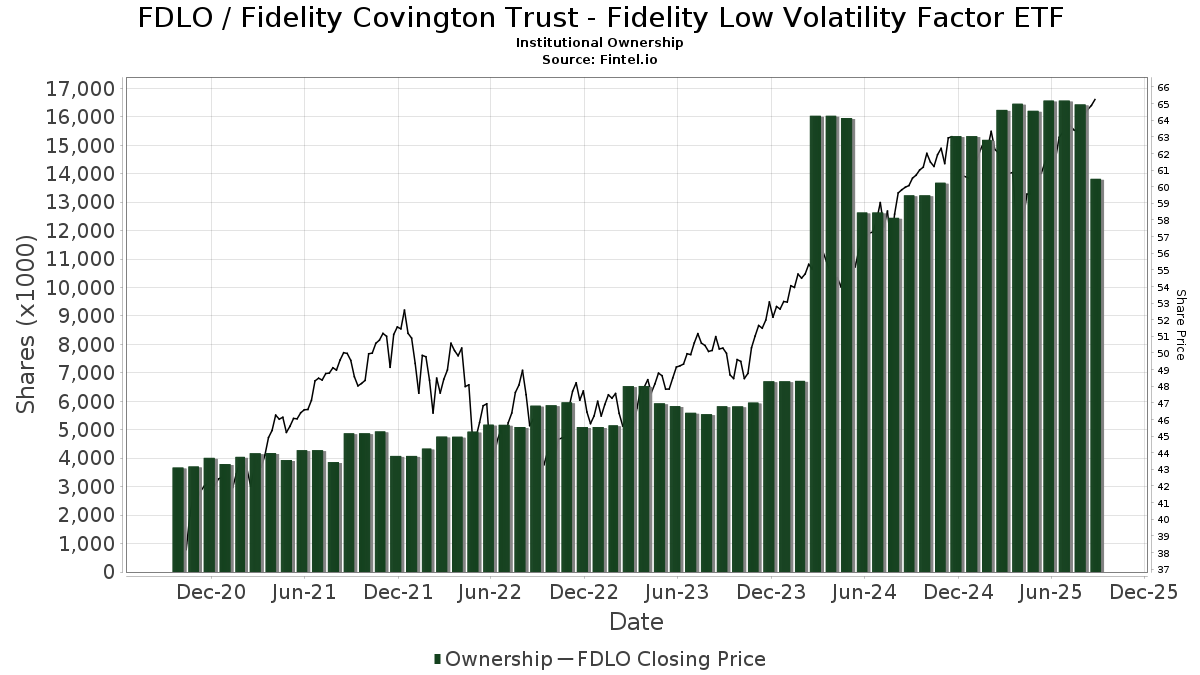
Kepemilikan Institusional dan Pemegang Saham
Fidelity Covington Trust - Fidelity Low Volatility Factor ETF (US:FDLO) memiliki 159 pemilik institusional dan pemegang saham yang telah mengajukan formulir 13D/G atau 13F kepada Komisi Bursa Efek (Securities Exchange Commission/SEC). Lembaga-lembaga ini memegang total 13,820,699 saham. Pemegang saham terbesar meliputi Fmr Llc, Commonwealth Equity Services, Llc, Envestnet Asset Management Inc, Bank Of America Corp /de/, Kestra Advisory Services, LLC, Campbell Deegan Wealth Management, LLC, CI Private Wealth, LLC, Segall Bryant & Hamill, Llc, LPL Financial LLC, and GWM Advisors LLC .
Struktur kepemilikan institusional Fidelity Covington Trust - Fidelity Low Volatility Factor ETF (ARCA:FDLO) menunjukkan posisi terkini di perusahaan oleh institusi dan dana, serta perubahan terbaru dalam ukuran posisi. Pemegang saham utama dapat mencakup investor individu, reksa dana, dana lindung nilai, atau institusi. Jadwal 13D menunjukkan bahwa investor memegang (atau pernah memegang) lebih dari 5% saham perusahaan dan bermaksud (atau pernah bermaksud) untuk secara aktif mengejar perubahan strategi bisnis. Jadwal 13G menunjukkan investasi pasif lebih dari 5%.
The share price as of September 5, 2025 is 65.13 / share. Previously, on September 9, 2024, the share price was 59.63 / share. This represents an increase of 9.22% over that period.
Skor Sentimen Dana
Skor Sentimen Dana (sebelumnya dikenal sebagai Skor Akumulasi Kepemilikan) menemukan saham-saham yang paling banyak dibeli oleh dana. Ini adalah hasil dari model kuantitatif multi-faktor yang canggih yang mengidentifikasi perusahaan dengan tingkat akumulasi institusional tertinggi. Model penilaian menggunakan kombinasi dari total peningkatan pemilik yang diungkapkan, perubahan dalam alokasi portofolio pada pemilik tersebut, dan metrik lainnya. Angka berkisar dari 0 hingga 100, dengan angka yang lebih tinggi menunjukkan tingkat akumulasi yang lebih tinggi dibandingkan dengan perusahaan sejenisnya, dan 50 adalah rata-ratanya.
Frekuensi Pembaruan: Setiap Hari
Lihat Ownership Explorer, yang menyediakan daftar perusahaan dengan peringkat tertinggi.
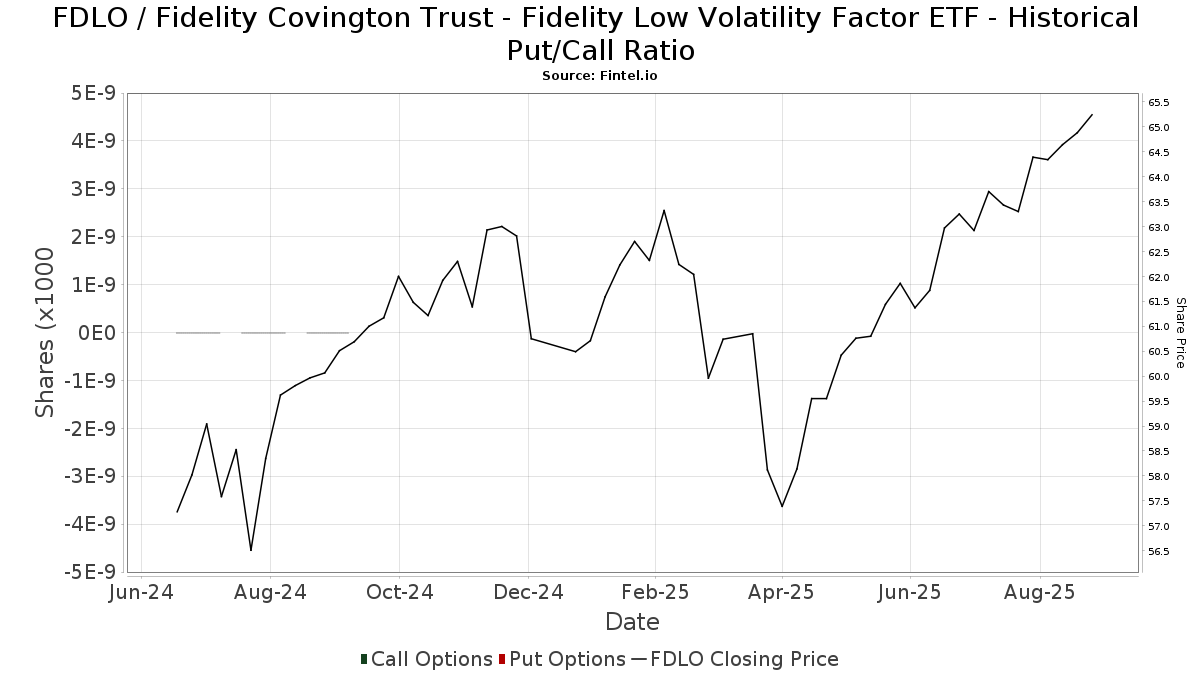
Rasio Put/Call Institusional
Selain melaporkan isu ekuitas dan utang standar, institusi dengan aset di bawah manajemen lebih dari 100 juta dolar AS juga harus mengungkapkan kepemilikan opsi put dan call mereka. Karena opsi put umumnya menunjukkan sentimen negatif, dan opsi call menunjukkan sentimen positif, kita dapat mengetahui sentimen institusional secara keseluruhan dengan memplot rasio put terhadap call. Grafik di sebelah kanan memplot rasio put/call historis untuk instrumen ini.
Menggunakan Rasio Put/Call sebagai indikator sentimen investor mengatasi salah satu kekurangan utama dari penggunaan total kepemilikan institusional, yaitu sejumlah besar aset yang dikelola diinvestasikan secara pasif untuk melacak indeks. Dana yang dikelola secara pasif biasanya tidak membeli opsi, sehingga indikator rasio put/call lebih akurat dalam melacak sentimen dana yang dikelola secara aktif.
Pengajuan 13F dan NPORT
Detail pada pengajuan 13F tersedia gratis. Detail pada pengajuan NP memerlukan keanggotaan premium. Baris berwarna hijau menunjukkan posisi baru. Baris berwarna merah menunjukkan posisi yang sudah ditutup. Klik tautan ini ikon untuk melihat riwayat transaksi selengkapnya.
Tingkatkan
untuk membuka data premium dan mengekspor ke Excel ![]() .
.
| Tanggal File | Sumber | Investor | Ketik | Presyo ng Avg (Silangan) |
Saham | Δ Saham (%) |
Dilaporkan Nilai ($1000) |
Nilai Δ (%) |
Alokasi Port (%) |
|
|---|---|---|---|---|---|---|---|---|---|---|
| 2025-08-08 | 13F | Glassman Wealth Services | 0 | -100.00 | 0 | |||||
| 2025-08-14 | 13F | Mercer Global Advisors Inc /adv | 7,834 | -13.80 | 492 | -10.73 | ||||
| 2025-08-08 | 13F | Foundations Investment Advisors, LLC | 74,355 | 12.88 | 4,670 | 16.93 | ||||
| 2025-05-13 | 13F | Coston, McIsaac & Partners | 0 | -100.00 | 0 | |||||
| 2025-08-13 | 13F | Colonial Trust Advisors | 9 | 1 | ||||||
| 2025-07-28 | 13F | BRYN MAWR TRUST Co | 360 | 0.00 | 23 | 4.76 | ||||
| 2025-08-07 | 13F | Samalin Investment Counsel, LLC | 5,494 | 0.05 | 345 | 3.92 | ||||
| 2025-07-08 | 13F | RMR Wealth Builders | 3,540 | -6.99 | 222 | -3.48 | ||||
| 2025-09-04 | 13F/A | Advisor Group Holdings, Inc. | 118,808 | -22.53 | 7,466 | -19.73 | ||||
| 2025-07-25 | 13F | Atria Wealth Solutions, Inc. | 8,861 | -8.67 | 556 | -5.44 | ||||
| 2025-08-11 | 13F | Aptus Capital Advisors, LLC | 6,024 | 88.90 | 378 | 95.85 | ||||
| 2025-08-14 | 13F | Mml Investors Services, Llc | 6,641 | -36.69 | 0 | |||||
| 2025-08-11 | 13F | Empowered Funds, LLC | 0 | -100.00 | 0 | |||||
| 2025-07-11 | 13F | Farther Finance Advisors, LLC | 436 | 19.45 | 27 | 22.73 | ||||
| 2025-08-12 | 13F | Integrated Advisors Network LLC | 7,603 | -30.12 | 477 | -27.62 | ||||
| 2025-08-06 | 13F | Hoxton Planning & Management, LLC | 3,561 | 0.00 | 224 | 3.72 | ||||
| 2025-07-28 | 13F | Harbour Investments, Inc. | 96 | -92.10 | 6 | -91.78 | ||||
| 2025-08-01 | 13F | Envestnet Asset Management Inc | 555,092 | -9.25 | 34,860 | -5.98 | ||||
| 2025-08-15 | 13F | Morgan Stanley | 77,179 | -28.32 | 4,847 | -25.75 | ||||
| 2025-08-14 | 13F | Clarity Asset Management, Inc. | 2,228 | 0.36 | 140 | 3.73 | ||||
| 2025-07-18 | 13F | Provident Wealth Management, LLC | 2,886 | 0.00 | 181 | 4.02 | ||||
| 2025-08-07 | 13F | Kestra Private Wealth Services, Llc | 26,095 | 6.30 | 1,639 | 10.08 | ||||
| 2025-08-08 | 13F | Avantax Advisory Services, Inc. | 12,509 | 1.08 | 786 | 4.67 | ||||
| 2025-08-27 | 13F/A | Brinker Capital Investments, LLC | 3,360 | 211 | ||||||
| 2025-07-17 | 13F | Beacon Capital Management, LLC | 70 | 4 | ||||||
| 2025-08-14 | 13F | Qube Research & Technologies Ltd | 0 | -100.00 | 0 | |||||
| 2025-08-12 | 13F | Absolute Capital Management, LLC | 3,473 | -25.52 | 218 | -22.70 | ||||
| 2025-07-21 | 13F | Ameritas Advisory Services, LLC | 130,449 | -48.98 | 8,192 | -47.14 | ||||
| 2025-08-08 | 13F | Advisors Capital Management, LLC | 34,774 | -2.44 | 2,184 | 1.06 | ||||
| 2025-08-14 | 13F | Stifel Financial Corp | 49,645 | 4.39 | 3,118 | 8.15 | ||||
| 2025-07-24 | 13F | Capital Advisors, Ltd. LLC | 10 | 0 | ||||||
| 2025-08-14 | 13F | Fmr Llc | 7,934,912 | -23.10 | 498,312 | -20.33 | ||||
| 2025-07-25 | 13F | Cwm, Llc | 700 | 233.33 | 0 | |||||
| 2025-08-13 | 13F | Cresset Asset Management, LLC | 6,304 | -0.02 | 396 | 3.40 | ||||
| 2025-08-04 | 13F | Savvy Advisors, Inc. | 3,329 | 209 | ||||||
| 2025-07-24 | 13F | Us Bancorp \de\ | 120 | -6.98 | 8 | 0.00 | ||||
| 2025-08-12 | 13F | Running Point Capital Advisors, LLC | 165,902 | 1.36 | 10,419 | 5.00 | ||||
| 2025-07-28 | 13F | Private Wealth Asset Management, LLC | 1,050 | 0.00 | 66 | 3.17 | ||||
| 2025-08-04 | 13F | AMG National Trust Bank | 3,518 | 0.23 | 221 | 3.77 | ||||
| 2025-08-14 | 13F | Bank Of America Corp /de/ | 443,513 | 9.54 | 27,853 | 13.48 | ||||
| 2025-07-31 | 13F | Buckingham Strategic Partners | 10,068 | 0.24 | 632 | 3.95 | ||||
| 2025-08-13 | 13F | Capital Analysts, Inc. | 33,953 | 1.90 | 2 | 0.00 | ||||
| 2025-07-14 | 13F | Mechanics Bank Trust Department | 73,282 | 17.87 | 4,602 | 22.13 | ||||
| 2025-05-16 | 13F | Coppell Advisory Solutions LLC | 0 | -100.00 | 0 | |||||
| 2025-08-07 | 13F | Allworth Financial LP | 74 | -64.08 | 5 | -66.67 | ||||
| 2025-08-12 | 13F | MAI Capital Management | 264 | 42.70 | 17 | 45.45 | ||||
| 2025-08-18 | 13F | Hershey Financial Advisers, LLC | 0 | -100.00 | 0 | |||||
| 2025-08-11 | 13F | Private Advisor Group, LLC | 5,014 | -16.35 | 315 | -13.50 | ||||
| 2025-08-12 | 13F | J.w. Cole Advisors, Inc. | 5,043 | 1.67 | 317 | 5.33 | ||||
| 2025-08-14 | 13F | Betterment LLC | 7,494 | -2.24 | 0 | |||||
| 2025-08-14 | 13F | AllSquare Wealth Management LLC | 9,933 | 0.00 | 624 | 3.49 | ||||
| 2025-08-12 | 13F | SRS Capital Advisors, Inc. | 1,817 | 0.39 | 114 | 4.59 | ||||
| 2025-08-08 | 13F | OmniStar Financial Group, Inc. | 8,493 | 0.41 | 533 | 3.29 | ||||
| 2025-05-15 | 13F | EP Wealth Advisors, Inc. | 0 | -100.00 | 0 | -100.00 | ||||
| 2025-08-06 | 13F | Nvwm, Llc | 19,688 | 5.94 | 1,236 | 9.77 | ||||
| 2025-08-12 | 13F | Global Retirement Partners, LLC | 2,160 | 0.56 | 136 | 3.85 | ||||
| 2025-08-08 | 13F | Pnc Financial Services Group, Inc. | 44 | 76.00 | 3 | 100.00 | ||||
| 2025-05-14 | 13F | Orion Portfolio Solutions, LLC | 4,032 | 0.00 | 244 | 0.00 | ||||
| 2025-08-15 | 13F | Kestra Advisory Services, LLC | 346,284 | 7.32 | 21,747 | 11.18 | ||||
| 2025-08-13 | 13F | Cary Street Partners Financial Llc | 8,955 | -8.91 | 562 | -5.55 | ||||
| 2025-05-16 | 13F/A | Kestra Investment Management, LLC | 0 | -100.00 | 0 | |||||
| 2025-07-30 | 13F | Exencial Wealth Advisors, Llc | 78,286 | -7.41 | 4,916 | -4.08 | ||||
| 2025-08-13 | 13F | Transce3nd, LLC | 133 | 0.00 | 8 | 0.00 | ||||
| 2025-07-30 | 13F | Avidian Wealth Solutions, LLC | 9,666 | -0.30 | 607 | 3.41 | ||||
| 2025-08-12 | 13F | Argent Trust Co | 22,759 | -5.03 | 1,429 | -1.58 | ||||
| 2025-07-31 | 13F | Sequent Asset Management, LLC | 22,710 | 0.00 | 1,426 | 3.63 | ||||
| 2025-08-12 | 13F | Segall Bryant & Hamill, Llc | 227,641 | -2.94 | 14,296 | 0.54 | ||||
| 2025-08-14 | 13F | Valley Financial Group, Inc. | 5,554 | -0.61 | 349 | 2.96 | ||||
| 2025-08-15 | 13F | Semmax Financial Advisors Inc. | 55 | 0.00 | 3 | 0.00 | ||||
| 2025-08-12 | 13F | Steward Partners Investment Advisory, Llc | 4,035 | -5.79 | 253 | -2.32 | ||||
| 2025-08-13 | 13F | Truvestments Capital Llc | 800 | 0.00 | 50 | 4.17 | ||||
| 2025-07-18 | 13F | Dogwood Wealth Management LLC | 6 | 0 | ||||||
| 2025-07-30 | 13F | Rehmann Capital Advisory Group | 20,897 | 0.00 | 1,312 | 3.63 | ||||
| 2025-08-12 | 13F | Jpmorgan Chase & Co | 76,116 | -3.60 | 4,780 | -0.13 | ||||
| 2025-07-17 | 13F | Tempus Wealth Planning, LLC | 27,794 | 0.34 | 1,745 | 3.93 | ||||
| 2025-07-10 | 13F | Wealth Enhancement Advisory Services, Llc | 16,987 | -20.48 | 1,080 | -16.54 | ||||
| 2025-05-09 | 13F | Blair William & Co/il | 0 | -100.00 | 0 | |||||
| 2025-08-14 | 13F | GWM Advisors LLC | 176,211 | 49.47 | 11,066 | 54.86 | ||||
| 2025-08-08 | 13F | Campbell Deegan Wealth Management, LLC | 314,733 | 3.08 | 19,765 | 6.79 | ||||
| 2025-08-04 | 13F | Assetmark, Inc | 143 | 197.92 | 9 | 300.00 | ||||
| 2025-07-30 | 13F | Brookstone Capital Management | 8,581 | 10.51 | 539 | 14.47 | ||||
| 2025-08-15 | 13F | CI Private Wealth, LLC | 236,209 | 0.29 | 14,834 | 3.89 | ||||
| 2025-08-04 | 13F | Spire Wealth Management | 16 | 0.00 | 1 | |||||
| 2025-08-05 | 13F | Westside Investment Management, Inc. | 14,750 | 0.14 | 926 | 3.81 | ||||
| 2025-07-31 | 13F | Carnegie Capital Asset Management, LLC | 3,912 | 0.00 | 246 | 13.95 | ||||
| 2025-08-15 | 13F | Asset Allocation Strategies LLC | 21,830 | -31.72 | 1,371 | -29.31 | ||||
| 2025-07-24 | 13F | Ronald Blue Trust, Inc. | 1,071 | 67 | ||||||
| 2025-07-31 | 13F | Cambridge Investment Research Advisors, Inc. | 41,154 | -3.81 | 3 | 0.00 | ||||
| 2025-08-14 | 13F/A | Rockefeller Capital Management L.P. | 14,634 | -67.79 | 919 | -66.63 | ||||
| 2025-08-14 | 13F | Jane Street Group, Llc | 15,034 | 4.82 | 944 | 8.63 | ||||
| 2025-08-14 | 13F | Integrated Wealth Concepts LLC | 8,153 | 0.97 | 512 | 4.70 | ||||
| 2025-07-31 | 13F | Briaud Financial Planning, Inc | 722 | 0 | ||||||
| 2025-07-21 | 13F | Ascent Group, LLC | 3,674 | -0.43 | 231 | 3.14 | ||||
| 2025-08-14 | 13F | Royal Bank Of Canada | 51,430 | -53.21 | 3,230 | -51.52 | ||||
| 2025-08-01 | 13F | Howard Capital Management Inc. | 80,838 | 91.48 | 5,077 | 98.36 | ||||
| 2025-07-14 | 13F | Abound Wealth Management | 529 | 33 | ||||||
| 2025-08-13 | 13F | Northwestern Mutual Wealth Management Co | 25,113 | -12.44 | 1,577 | -9.26 | ||||
| 2025-08-14 | 13F | Harwood Advisory Group, LLC | 3,069 | -2.39 | 193 | 1.05 | ||||
| 2025-08-14 | 13F | Sunbelt Securities, Inc. | 6,126 | -46.56 | 371 | -46.54 | ||||
| 2025-05-02 | 13F | Transcendent Capital Group LLC | 0 | -100.00 | 0 | |||||
| 2025-05-14 | 13F | Islay Capital Management, Llc | 0 | -100.00 | 0 | |||||
| 2025-07-10 | 13F | ARS Wealth Advisors Group, LLC | 4,727 | 0.36 | 297 | 3.86 | ||||
| 2025-07-15 | 13F | Maseco Llp | 374 | 23 | ||||||
| 2025-08-06 | 13F | Atlantic Union Bankshares Corp | 291 | 18 | ||||||
| 2025-07-25 | 13F | Johnson Investment Counsel Inc | 4,604 | -5.91 | 289 | -2.36 | ||||
| 2025-08-08 | 13F | Cetera Investment Advisers | 172,247 | 2.56 | 10,817 | 6.25 | ||||
| 2025-08-05 | 13F | Bank Of Montreal /can/ | 65 | 0.00 | 4 | 33.33 | ||||
| 2025-07-15 | 13F | Regatta Capital Group, Llc | 7,578 | 476 | ||||||
| 2025-07-21 | 13F | Abundance Wealth Counselors | 79,114 | -5.65 | 5 | 0.00 | ||||
| 2025-08-08 | 13F | Citizens Financial Group Inc/ri | 3,461 | 217 | ||||||
| 2025-08-14 | 13F | Comerica Bank | 394 | 0.00 | 25 | 4.35 | ||||
| 2025-08-12 | 13F | O'shaughnessy Asset Management, Llc | 10,881 | 2,350.68 | 683 | 2,526.92 | ||||
| 2025-05-12 | 13F | Independent Advisor Alliance | 0 | -100.00 | 0 | |||||
| 2025-07-11 | 13F | SILVER OAK SECURITIES, Inc | 6,374 | 0.05 | 400 | 4.44 | ||||
| 2025-07-08 | 13F | Strategic Advocates LLC | 7,779 | 489 | ||||||
| 2025-07-16 | 13F | RWM Asset Management, LLC | 5,169 | 0.00 | 325 | 3.51 | ||||
| 2025-08-14 | 13F | Mariner, LLC | 6,607 | 16.28 | 415 | 20.35 | ||||
| 2025-08-05 | 13F | Aviance Capital Partners, LLC | 3,546 | 0.00 | 223 | 3.74 | ||||
| 2025-05-12 | 13F | Sandy Spring Bank | 291 | 18 | ||||||
| 2025-07-14 | 13F | AdvisorNet Financial, Inc | 106 | 0.00 | 7 | 0.00 | ||||
| 2025-08-26 | 13F/A | Thrivent Financial For Lutherans | 0 | -100.00 | 0 | -100.00 | ||||
| 2025-05-02 | 13F | Capital A Wealth Management, LLC | 14 | 0.00 | 1 | |||||
| 2025-08-06 | 13F | Stonebridge Financial Planning Group, LLC | 5,250 | 0.00 | 330 | 3.46 | ||||
| 2025-08-12 | 13F | Ameritas Investment Partners, Inc. | 994 | 0.30 | 62 | 3.33 | ||||
| 2025-08-13 | 13F | Jones Financial Companies Lllp | 75 | 5 | ||||||
| 2025-07-30 | 13F | Strategic Blueprint, LLC | 14,494 | 910 | ||||||
| 2025-08-05 | 13F | Sigma Planning Corp | 8,279 | 8.52 | 520 | 12.34 | ||||
| 2025-07-24 | 13F | GFG Capital, LLC | 118,446 | -7.39 | 7,438 | -4.05 | ||||
| 2025-08-19 | 13F | Asset Dedication, LLC | 11 | 0.00 | 1 | |||||
| 2025-07-07 | 13F | Roxbury Financial LLC | 2,124 | 494.96 | 133 | 504.55 | ||||
| 2025-08-12 | 13F | Weaver Consulting Group | 43,877 | -0.98 | 2,755 | 2.57 | ||||
| 2025-08-13 | 13F | Lido Advisors, LLC | 115,900 | -7.90 | 7,279 | -4.59 | ||||
| 2025-08-12 | 13F | Proequities, Inc. | 0 | 0 | ||||||
| 2025-08-14 | 13F | Goldman Sachs Group Inc | 73,927 | -0.66 | 4,643 | 2.90 | ||||
| 2025-08-08 | 13F | MTM Investment Management, LLC | 919 | 58 | ||||||
| 2025-08-06 | 13F | AE Wealth Management LLC | 70,575 | -6.50 | 4,432 | -3.13 | ||||
| 2025-08-18 | 13F | Tyler-Stone Wealth Management | 33,877 | -0.83 | 2,127 | 2.75 | ||||
| 2025-08-14 | 13F | Two Sigma Investments, Lp | 0 | -100.00 | 0 | |||||
| 2025-08-14 | 13F | UBS Group AG | 2,636 | -66.30 | 166 | -65.19 | ||||
| 2025-07-14 | 13F | UMA Financial Services, Inc. | 33 | 0.00 | 2 | 0.00 | ||||
| 2025-07-24 | 13F | JB Capital LLC | 3,594 | 2.02 | 226 | 5.63 | ||||
| 2025-07-23 | 13F | Kingswood Wealth Advisors, Llc | 4,928 | -0.36 | 309 | 3.34 | ||||
| 2025-08-01 | 13F | Gwn Securities Inc. | 0 | -100.00 | 0 | |||||
| 2025-08-14 | 13F | Susquehanna International Group, Llp | 21,833 | 1,371 | ||||||
| 2025-07-17 | 13F | Sound Income Strategies, LLC | 14 | -95.85 | 1 | -100.00 | ||||
| 2025-07-30 | 13F | Cullen/frost Bankers, Inc. | 8,249 | 6.66 | 518 | 10.68 | ||||
| 2025-08-15 | 13F | Equitable Holdings, Inc. | 3,587 | 8.04 | 225 | 11.94 | ||||
| 2025-04-21 | 13F | Nelson, Van Denburg & Campbell Wealth Management Group, LLC | 0 | -100.00 | 0 | |||||
| 2025-05-08 | 13F | Eastern Bank | 0 | -100.00 | 0 | |||||
| 2025-07-14 | 13F | GAMMA Investing LLC | 192 | 0.00 | 12 | 9.09 | ||||
| 2025-08-01 | 13F | Logan Capital Management Inc | 3 | 0.00 | 0 | |||||
| 2025-07-14 | 13F | Buttonwood Financial Group, LLC | 9,157 | 2.88 | 579 | 14.00 | ||||
| 2025-08-13 | 13F | Russell Investments Group, Ltd. | 26 | 2 | ||||||
| 2025-07-25 | 13F | Sovereign Financial Group, Inc. | 5,057 | 0.38 | 318 | 3.93 | ||||
| 2025-08-12 | 13F | CIBC Private Wealth Group, LLC | 6 | 0.00 | 0 | |||||
| 2025-08-08 | 13F | Creative Planning | 8,196 | 6.06 | 515 | 9.83 | ||||
| 2025-08-13 | 13F | EverSource Wealth Advisors, LLC | 278 | 0.00 | 17 | 6.25 | ||||
| 2025-08-14 | 13F | Citadel Advisors Llc | 49,455 | 159.61 | 3,106 | 169.06 | ||||
| 2025-08-13 | 13F | Twin Peaks Wealth Advisors, LLC | 387 | 25 | ||||||
| 2025-08-19 | 13F | Advisory Services Network, LLC | 11,103 | -0.23 | 701 | 3.86 | ||||
| 2025-08-14 | 13F | Great Valley Advisor Group, Inc. | 12,986 | -9.06 | 816 | -5.78 | ||||
| 2025-08-11 | 13F | Principal Securities, Inc. | 130 | -37.50 | 8 | -33.33 | ||||
| 2025-08-13 | 13F | Cerity Partners LLC | 3,510 | -15.28 | 220 | -12.35 | ||||
| 2025-05-02 | 13F | Apollon Wealth Management, LLC | 0 | -100.00 | 0 | |||||
| 2025-07-25 | 13F | Envestnet Portfolio Solutions, Inc. | 15,777 | 14.84 | 991 | 18.99 | ||||
| 2025-08-13 | 13F | Luminist Capital LLC | 13 | 0.00 | 1 | |||||
| 2025-08-14 | 13F | Wells Fargo & Company/mn | 2,387 | 109.02 | 150 | 115.94 | ||||
| 2025-08-05 | 13F | Snider Financial Group | 8,542 | -12.46 | 536 | -9.31 | ||||
| 2025-05-08 | 13F | Regions Financial Corp | 0 | -100.00 | 0 | |||||
| 2025-07-25 | 13F | Concord Wealth Partners | 193 | 12 | ||||||
| 2025-08-12 | 13F | LPL Financial LLC | 177,522 | -9.96 | 11,148 | -6.72 | ||||
| 2025-07-09 | 13F | Pallas Capital Advisors LLC | 14,128 | 2.97 | 887 | 6.74 | ||||
| 2025-08-11 | 13F | Citigroup Inc | 772 | 48 | ||||||
| 2025-08-06 | 13F | Commonwealth Equity Services, Llc | 747,249 | -1.12 | 47 | 2.22 | ||||
| 2025-07-24 | 13F | IFP Advisors, Inc | 3,511 | 14.44 | 220 | 18.92 | ||||
| 2025-07-15 | 13F | Unified Investment Management | 6,150 | 0.00 | 386 | 3.76 | ||||
| 2025-08-14 | 13F | Raymond James Financial Inc | 104,585 | 1.84 | 6,568 | 5.49 | ||||
| 2025-08-05 | 13F | Key FInancial Inc | 2,427 | 0.00 | 152 | 3.40 | ||||
| 2025-08-08 | 13F | Security Financial Services, INC. | 11,004 | 691 |