Mga Batayang Estadistika
| Pemilik Institusional | 144 total, 144 long only, 0 short only, 0 long/short - change of 27.19% MRQ |
| Alokasi Portofolio Rata-rata | 0.3221 % - change of -12.01% MRQ |
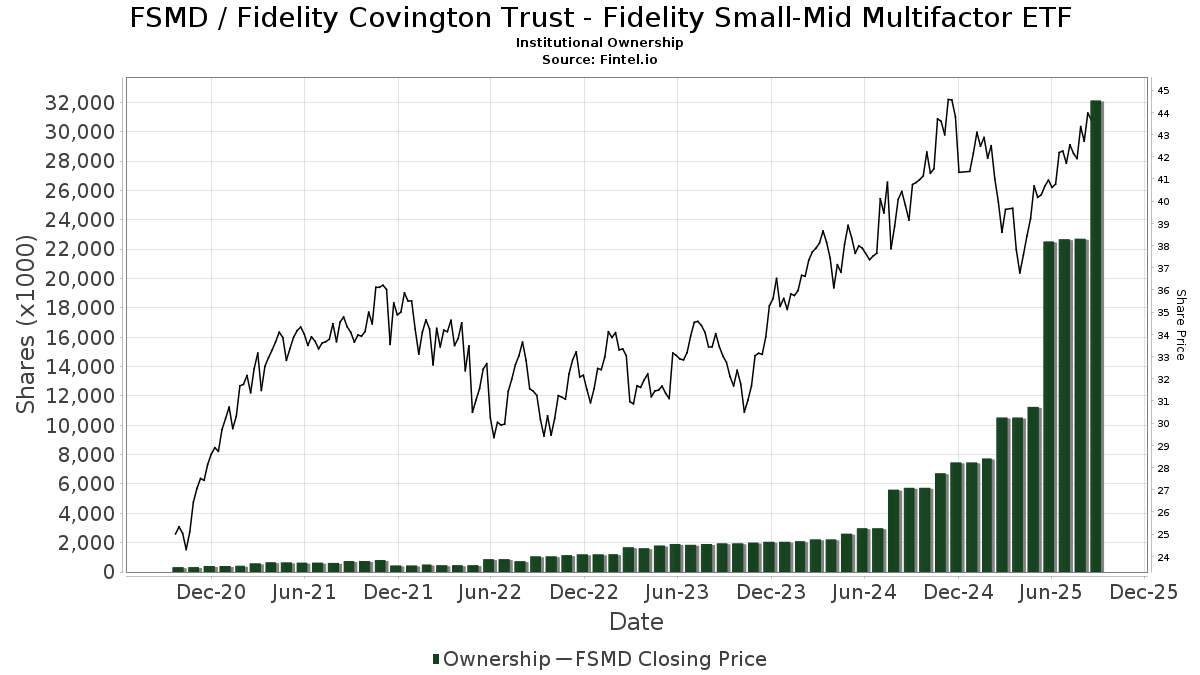
| Saham Institusional (Jangka Panjang) | 32,129,941 (ex 13D/G) - change of 9.61MM shares 42.68% MRQ |
| Nilai Institusional (Jangka Panjang) | $ 1,223,445 USD ($1000) |
Kepemilikan Institusional dan Pemegang Saham
Fidelity Covington Trust - Fidelity Small-Mid Multifactor ETF (US:FSMD) memiliki 144 pemilik institusional dan pemegang saham yang telah mengajukan formulir 13D/G atau 13F kepada Komisi Bursa Efek (Securities Exchange Commission/SEC). Lembaga-lembaga ini memegang total 32,129,941 saham. Pemegang saham terbesar meliputi Fmr Llc, Retirement Planning Group, Commonwealth Equity Services, Llc, Bank Of America Corp /de/, LPL Financial LLC, Advocacy Wealth Management Services, LLC, Envestnet Asset Management Inc, Kestra Advisory Services, LLC, Systelligence, LLC, and Cetera Investment Advisers .
Struktur kepemilikan institusional Fidelity Covington Trust - Fidelity Small-Mid Multifactor ETF (ARCA:FSMD) menunjukkan posisi terkini di perusahaan oleh institusi dan dana, serta perubahan terbaru dalam ukuran posisi. Pemegang saham utama dapat mencakup investor individu, reksa dana, dana lindung nilai, atau institusi. Jadwal 13D menunjukkan bahwa investor memegang (atau pernah memegang) lebih dari 5% saham perusahaan dan bermaksud (atau pernah bermaksud) untuk secara aktif mengejar perubahan strategi bisnis. Jadwal 13G menunjukkan investasi pasif lebih dari 5%.
The share price as of September 5, 2025 is 44.30 / share. Previously, on September 9, 2024, the share price was 39.21 / share. This represents an increase of 12.98% over that period.
Skor Sentimen Dana
Skor Sentimen Dana (sebelumnya dikenal sebagai Skor Akumulasi Kepemilikan) menemukan saham-saham yang paling banyak dibeli oleh dana. Ini adalah hasil dari model kuantitatif multi-faktor yang canggih yang mengidentifikasi perusahaan dengan tingkat akumulasi institusional tertinggi. Model penilaian menggunakan kombinasi dari total peningkatan pemilik yang diungkapkan, perubahan dalam alokasi portofolio pada pemilik tersebut, dan metrik lainnya. Angka berkisar dari 0 hingga 100, dengan angka yang lebih tinggi menunjukkan tingkat akumulasi yang lebih tinggi dibandingkan dengan perusahaan sejenisnya, dan 50 adalah rata-ratanya.
Frekuensi Pembaruan: Setiap Hari
Lihat Ownership Explorer, yang menyediakan daftar perusahaan dengan peringkat tertinggi.
Rasio Put/Call Institusional
Selain melaporkan isu ekuitas dan utang standar, institusi dengan aset di bawah manajemen lebih dari 100 juta dolar AS juga harus mengungkapkan kepemilikan opsi put dan call mereka. Karena opsi put umumnya menunjukkan sentimen negatif, dan opsi call menunjukkan sentimen positif, kita dapat mengetahui sentimen institusional secara keseluruhan dengan memplot rasio put terhadap call. Grafik di sebelah kanan memplot rasio put/call historis untuk instrumen ini.
Menggunakan Rasio Put/Call sebagai indikator sentimen investor mengatasi salah satu kekurangan utama dari penggunaan total kepemilikan institusional, yaitu sejumlah besar aset yang dikelola diinvestasikan secara pasif untuk melacak indeks. Dana yang dikelola secara pasif biasanya tidak membeli opsi, sehingga indikator rasio put/call lebih akurat dalam melacak sentimen dana yang dikelola secara aktif.
Pengajuan 13F dan NPORT
Detail pada pengajuan 13F tersedia gratis. Detail pada pengajuan NP memerlukan keanggotaan premium. Baris berwarna hijau menunjukkan posisi baru. Baris berwarna merah menunjukkan posisi yang sudah ditutup. Klik tautan ini ikon untuk melihat riwayat transaksi selengkapnya.
Tingkatkan
untuk membuka data premium dan mengekspor ke Excel ![]() .
.
| Tanggal File | Sumber | Investor | Ketik | Presyo ng Avg (Silangan) |
Saham | Δ Saham (%) |
Dilaporkan Nilai ($1000) |
Nilai Δ (%) |
Alokasi Port (%) |
|
|---|---|---|---|---|---|---|---|---|---|---|
| 2025-07-29 | 13F | Private Trust Co Na | 42 | 0.00 | 2 | 0.00 | ||||
| 2025-09-04 | 13F/A | Advisor Group Holdings, Inc. | 236,855 | 26.53 | 9,826 | 34.00 | ||||
| 2025-07-14 | 13F | Sweeney & Michel, Llc | 10,785 | -0.14 | 453 | 21.12 | ||||
| 2025-08-12 | 13F/A | Cozad Asset Management Inc | 6,021 | 250 | ||||||
| 2025-04-15 | 13F | Noble Wealth Management PBC | 1,300 | 0.00 | 51 | -5.66 | ||||
| 2025-07-30 | 13F | Parcion Private Wealth LLC | 0 | -100.00 | 0 | |||||
| 2025-07-07 | 13F | Nova Wealth Management, Inc. | 3,704 | 19.95 | 154 | 27.50 | ||||
| 2025-07-09 | 13F | Sterling Manor Financial, LLC | 111,628 | -2.53 | 4,629 | 3.23 | ||||
| 2025-07-30 | 13F | Rehmann Capital Advisory Group | 0 | -100.00 | 0 | |||||
| 2025-08-01 | 13F | Envestnet Asset Management Inc | 631,790 | 44.27 | 26,200 | 52.78 | ||||
| 2025-08-13 | 13F | Twin Peaks Wealth Advisors, LLC | 543 | 23 | ||||||
| 2025-07-25 | 13F | Cwm, Llc | 6,845 | 94.52 | 0 | |||||
| 2025-07-24 | 13F | Blair William & Co/il | 255 | 11 | ||||||
| 2025-07-25 | 13F | Atria Wealth Solutions, Inc. | 13,197 | 0.15 | 547 | 6.01 | ||||
| 2025-08-11 | 13F | United Capital Financial Advisers, Llc | 8,134 | -0.12 | 337 | 5.97 | ||||
| 2025-08-15 | 13F | Montag & Caldwell, Llc | 16,819 | 0.01 | 697 | 5.93 | ||||
| 2025-08-15 | 13F | Kestra Advisory Services, LLC | 441,185 | 43.10 | 18,296 | 51.55 | ||||
| 2025-05-15 | 13F | Creative Planning | 0 | -100.00 | 0 | |||||
| 2025-08-07 | 13F | Kestra Private Wealth Services, Llc | 55,152 | 2.38 | 2,287 | 8.44 | ||||
| 2025-08-06 | 13F | Hoxton Planning & Management, LLC | 4,910 | 204 | ||||||
| 2025-08-08 | 13F | Avantax Advisory Services, Inc. | 54,221 | 26.62 | 2,249 | 34.13 | ||||
| 2025-08-14 | 13F | Stifel Financial Corp | 247,254 | 11.24 | 10,254 | 17.81 | ||||
| 2025-08-04 | 13F | Spire Wealth Management | 20,438 | 85,058.33 | 848 | |||||
| 2025-08-14 | 13F | Mml Investors Services, Llc | 139,142 | 2,394.93 | 6 | |||||
| 2025-08-13 | 13F | Renaissance Technologies Llc | 8,300 | 344 | ||||||
| 2025-08-15 | 13F | Equitable Holdings, Inc. | 34,905 | 41.63 | 1,448 | 49.95 | ||||
| 2025-07-18 | 13F | Provident Wealth Management, LLC | 161,237 | 0.12 | 6,686 | 6.03 | ||||
| 2025-08-14 | 13F | Visionary Wealth Advisors | 29,947 | 1,242 | ||||||
| 2025-08-13 | 13F | EverSource Wealth Advisors, LLC | 787 | 33 | ||||||
| 2025-08-14 | 13F | Hilltop Holdings Inc. | 31,681 | -1.16 | 1,314 | 4.62 | ||||
| 2025-08-14 | 13F | Fmr Llc | 16,578,869 | 82.93 | 687,526 | 93.72 | ||||
| 2025-08-14 | 13F | Susquehanna International Group, Llp | 30,352 | -64.98 | 1,259 | -62.93 | ||||
| 2025-07-21 | 13F | Ameritas Advisory Services, LLC | 470 | 19 | ||||||
| 2025-08-14 | 13F/A | Rockefeller Capital Management L.P. | 20,426 | 26.75 | 847 | 34.23 | ||||
| 2025-08-14 | 13F | Qube Research & Technologies Ltd | 77 | 3 | ||||||
| 2025-08-13 | 13F | Advocacy Wealth Management Services, LLC | 686,805 | -4.54 | 28,482 | 1.09 | ||||
| 2025-08-13 | 13F | Summit Wealth Group Llc / Co | 8,263 | 343 | ||||||
| 2025-08-12 | 13F | MAI Capital Management | 42 | 2 | ||||||
| 2025-08-15 | 13F | Tower Research Capital LLC (TRC) | 0 | -100.00 | 0 | |||||
| 2025-08-07 | 13F | Resources Investment Advisors, LLC. | 48,778 | 2,023 | ||||||
| 2025-07-28 | 13F | Holistic Planning, LLC | 5,358 | -10.18 | 222 | -4.72 | ||||
| 2025-07-16 | 13F | Novem Group | 167,625 | 6,951 | ||||||
| 2025-08-11 | 13F | HighTower Advisors, LLC | 5,561 | -0.30 | 231 | 5.50 | ||||
| 2025-08-12 | 13F | Howe & Rusling Inc | 155 | 6 | ||||||
| 2025-08-04 | 13F | Atria Investments Llc | 375,662 | 15,579 | ||||||
| 2025-08-14 | 13F | Bank Of America Corp /de/ | 1,116,813 | 30.62 | 46,314 | 38.33 | ||||
| 2025-08-12 | 13F | J.w. Cole Advisors, Inc. | 22,725 | 33.71 | 942 | 41.65 | ||||
| 2025-08-11 | 13F | Private Advisor Group, LLC | 15,778 | -15.49 | 654 | -10.53 | ||||
| 2025-08-06 | 13F | First Horizon Advisors, Inc. | 2,926 | 121 | ||||||
| 2025-07-29 | 13F | Fundamentun, Llc | 7,156 | -94.44 | 297 | -94.12 | ||||
| 2025-08-26 | NP | EVTTX - The E-Valuator Conservative/Moderate (30%-50%) RMS Fund Service Class Shares | 13,652 | -0.55 | 566 | 5.40 | ||||
| 2025-07-11 | 13F | Farther Finance Advisors, LLC | 66,731 | 95.26 | 2,767 | 106.65 | ||||
| 2025-05-02 | 13F | Capital A Wealth Management, LLC | 20 | 0.00 | 1 | |||||
| 2025-07-22 | 13F | Iron Horse Wealth Management, LLC | 0 | -100.00 | 0 | |||||
| 2025-07-22 | 13F | Merit Financial Group, LLC | 11,898 | 1.41 | 493 | 7.41 | ||||
| 2025-08-14 | 13F | Clarity Asset Management, Inc. | 138 | 6 | ||||||
| 2025-07-30 | 13F | Principle Wealth Partners Llc | 6,200 | 257 | ||||||
| 2025-08-08 | 13F | Pnc Financial Services Group, Inc. | 75 | 50.00 | 3 | 200.00 | ||||
| 2025-08-13 | 13F | Van Hulzen Asset Management, LLC | 73,228 | 2.54 | 3,037 | 8.58 | ||||
| 2025-08-08 | 13F | Laurel Wealth Planning LLC | 49,798 | 11.69 | 2,065 | 18.34 | ||||
| 2025-08-12 | 13F | SRS Capital Advisors, Inc. | 936 | 39 | ||||||
| 2025-07-10 | 13F | Wealth Enhancement Advisory Services, Llc | 8,947 | 15.80 | 380 | 25.83 | ||||
| 2025-08-14 | 13F | Wiley Bros.-aintree Capital, Llc | 32,341 | 353.78 | 1,341 | 385.87 | ||||
| 2025-07-28 | 13F | BRYN MAWR TRUST Co | 0 | -100.00 | 0 | |||||
| 2025-08-14 | 13F | Clg Llc | 7,204 | 4.32 | 299 | 10.37 | ||||
| 2025-07-29 | 13F | Riverbend Wealth Management, LLC | 27,058 | 1.61 | 1,122 | 7.68 | ||||
| 2025-08-15 | 13F | Semmax Financial Advisors Inc. | 124 | 0.00 | 5 | 25.00 | ||||
| 2025-07-10 | 13F | Focus Financial Network, Inc. | 5,977 | 248 | ||||||
| 2025-08-12 | 13F | PKS Advisory Services, LLC | 7,119 | -3.45 | 295 | 2.43 | ||||
| 2025-07-17 | 13F | Emerald Advisors, LLC | 7,250 | 301 | ||||||
| 2025-07-31 | 13F | Trademark Financial Management, LLC | 8,206 | -83.49 | 340 | -82.53 | ||||
| 2025-08-14 | 13F | Sunbelt Securities, Inc. | 14 | -98.88 | 1 | -100.00 | ||||
| 2025-07-29 | 13F | AssuredPartners Investment Advisors, LLC | 227,826 | -7.64 | 9,448 | -2.19 | ||||
| 2025-08-12 | 13F | Steward Partners Investment Advisory, Llc | 201,710 | -1.76 | 8,365 | 4.03 | ||||
| 2025-08-08 | 13F | Foundations Investment Advisors, LLC | 30,272 | 55.94 | 1,255 | 65.13 | ||||
| 2025-07-18 | 13F | Dogwood Wealth Management LLC | 4 | 0 | ||||||
| 2025-08-12 | 13F | Jpmorgan Chase & Co | 18,613 | 96.24 | 772 | 107.82 | ||||
| 2025-07-17 | 13F | Fifth Third Securities, Inc. | 0 | -100.00 | 0 | |||||
| 2025-07-29 | 13F | Stratos Wealth Partners, LTD. | 9,738 | -12.64 | 404 | -7.57 | ||||
| 2025-08-14 | 13F | Raymond James Financial Inc | 397,102 | 7.93 | 16,468 | 14.30 | ||||
| 2025-07-28 | 13F | Frazier Financial Advisors, LLC | 48 | 2 | ||||||
| 2025-08-14 | 13F | Jane Street Group, Llc | 71,309 | -56.79 | 2,957 | -54.24 | ||||
| 2025-08-14 | 13F | Mariner, LLC | 9,583 | 14.15 | 397 | 21.04 | ||||
| 2025-09-04 | 13F | ZynergyRetirementPlanningLLC | 0 | -100.00 | 0 | |||||
| 2025-08-07 | 13F | New England Private Wealth Advisors LLC | 5,615 | 0.36 | 237 | 7.76 | ||||
| 2025-08-05 | 13F | Bank Of Montreal /can/ | 470 | -42.68 | 19 | -40.62 | ||||
| 2025-08-08 | 13F | Cetera Investment Advisers | 407,073 | 8.53 | 16,881 | 14.94 | ||||
| 2025-08-05 | 13F | GPS Wealth Strategies Group, LLC | 40 | 0.00 | 2 | 0.00 | ||||
| 2025-08-19 | 13F | Advisory Services Network, LLC | 138,702 | 112.57 | 5,812 | 127.44 | ||||
| 2025-08-01 | 13F | Cedar Point Capital Partners, LLC | 17,881 | -6.64 | 742 | -1.20 | ||||
| 2025-08-26 | NP | EVVLX - The E-Valuator Very Conservative (0%-15%) RMS Fund Service Class Shares | 2,265 | -10.69 | 94 | -6.06 | ||||
| 2025-08-13 | 13F | Northwestern Mutual Wealth Management Co | 286,148 | -11.99 | 11,867 | -6.80 | ||||
| 2025-08-04 | 13F | Creative Financial Designs Inc /adv | 253 | 0.00 | 11 | 11.11 | ||||
| 2025-08-14 | 13F | Comerica Bank | 876 | 36 | ||||||
| 2025-05-08 | 13F | We Are One Seven, LLC | 0 | -100.00 | 0 | |||||
| 2025-07-30 | 13F | BG Investment Services, Inc. | 16,055 | -33.64 | 666 | -29.70 | ||||
| 2025-08-05 | 13F | Huntington National Bank | 248 | 47.90 | ||||||
| 2025-08-06 | 13F | Atlantic Union Bankshares Corp | 12 | 0 | ||||||
| 2025-07-25 | 13F | Concurrent Investment Advisors, LLC | 17,261 | 14.49 | 716 | 21.19 | ||||
| 2025-08-14 | 13F | Ambassador Advisors, LLC | 13,999 | 30.58 | 581 | 38.42 | ||||
| 2025-07-11 | 13F | SILVER OAK SECURITIES, Inc | 8,221 | -3.45 | 341 | 3.03 | ||||
| 2025-08-12 | 13F | O'shaughnessy Asset Management, Llc | 187 | 8 | ||||||
| 2025-08-06 | 13F | AE Wealth Management LLC | 12,980 | -75.34 | 538 | -73.90 | ||||
| 2025-08-12 | 13F | Global Retirement Partners, LLC | 5,072 | 0.42 | 210 | 1.45 | ||||
| 2025-08-13 | 13F | Jones Financial Companies Lllp | 562 | 23 | ||||||
| 2025-08-12 | 13F | Proequities, Inc. | 0 | 0 | ||||||
| 2025-07-31 | 13F | Cambridge Investment Research Advisors, Inc. | 256,896 | 3.02 | 11 | 11.11 | ||||
| 2025-08-07 | 13F | Allworth Financial LP | 683 | 80.69 | 28 | 100.00 | ||||
| 2025-07-08 | 13F | Parallel Advisors, LLC | 3,842 | 159 | ||||||
| 2025-07-14 | 13F | Abound Wealth Management | 50 | 0.00 | 2 | 100.00 | ||||
| 2025-05-12 | 13F | Sandy Spring Bank | 12 | 0.00 | 0 | |||||
| 2025-08-14 | 13F | Goldman Sachs Group Inc | 90,242 | 115.08 | 3,742 | 127.75 | ||||
| 2025-08-26 | NP | EVAGX - The E-Valuator Aggressive Growth (85%-99%) RMS Fund Service Class Shares | 158,641 | 11.46 | 6,579 | 18.03 | ||||
| 2025-08-13 | 13F | Kuhn & Co Investment Counsel | 23,974 | 87.43 | 994 | 98.80 | ||||
| 2025-08-26 | NP | EVMLX - The E-Valuator Moderate (50%-70%) RMS Fund Service Class Shares | 77,745 | 1.44 | 3,224 | 7.43 | ||||
| 2025-07-09 | 13F | Breakwater Capital Group | 16,182 | 671 | ||||||
| 2025-07-30 | 13F | Retirement Planning Group | 3,551,494 | 2.11 | 147,280 | 8.14 | ||||
| 2025-07-29 | 13F | Chicago Partners Investment Group LLC | 16,450 | 0.00 | 700 | 8.37 | ||||
| 2025-07-30 | 13F | Strategic Blueprint, LLC | 18,500 | 767 | ||||||
| 2025-07-07 | 13F | Kings Path Partners LLC | 20 | 1 | ||||||
| 2025-07-17 | 13F | Sound Income Strategies, LLC | 2,605 | -50.00 | 108 | -47.06 | ||||
| 2025-07-28 | 13F | RFG Advisory, LLC | 10,571 | 0.01 | 438 | 6.05 | ||||
| 2025-06-11 | 13F | Fortitude Financial, LLC | 155,604 | 6,093 | ||||||
| 2025-08-14 | 13F | Two Sigma Investments, Lp | 52,600 | 2,181 | ||||||
| 2025-08-06 | 13F | Golden State Wealth Management, LLC | 44,974 | 1,865 | ||||||
| 2025-08-13 | 13F | Per Stirling Capital Management, LLC. | 0 | -100.00 | 0 | |||||
| 2025-08-11 | 13F | Diversified Portfolios, Inc. | 8,564 | -5.20 | 355 | 0.57 | ||||
| 2025-08-14 | 13F | UBS Group AG | 5,574 | -6.52 | 231 | -0.86 | ||||
| 2025-08-14 | 13F | Diversify Advisory Services, LLC | 12,029 | 7.86 | 514 | 19.58 | ||||
| 2025-08-04 | 13F | Prairie Wealth Advisors, Inc. | 5,431 | 0.48 | 225 | 6.64 | ||||
| 2025-08-26 | NP | EVGLX - The E-Valuator Growth (70%-85%) RMS Fund Service Class Shares | 149,938 | -1.21 | 6,218 | 4.61 | ||||
| 2025-05-16 | 13F/A | Kestra Investment Management, LLC | 0 | -100.00 | 0 | |||||
| 2025-07-28 | 13F | Harbour Investments, Inc. | 419 | 852.27 | 17 | 1,600.00 | ||||
| 2025-08-26 | NP | EVCLX - The E-Valuator Conservative (15%-30%) RMS Fund Service Class Shares | 9,046 | 7.37 | 375 | 13.98 | ||||
| 2025-07-29 | 13F | BKM Wealth Management, LLC | 5,587 | 232 | ||||||
| 2025-07-30 | 13F | Cullen/frost Bankers, Inc. | 6,926 | 11.05 | 287 | 17.62 | ||||
| 2025-08-12 | 13F | CIBC Private Wealth Group, LLC | 1,116 | 46 | ||||||
| 2025-08-13 | 13F | Russell Investments Group, Ltd. | 13 | 0.00 | 1 | |||||
| 2025-08-14 | 13F | CoreCap Advisors, LLC | 7,696 | 15.73 | 319 | 22.69 | ||||
| 2025-08-06 | 13F | Commonwealth Equity Services, Llc | 2,208,276 | 20.63 | 92 | 28.17 | ||||
| 2025-08-12 | 13F | LPL Financial LLC | 845,378 | 36.18 | 35,058 | 44.21 | ||||
| 2025-08-14 | 13F | Great Valley Advisor Group, Inc. | 33,669 | 89.89 | 1,396 | 101.15 | ||||
| 2025-08-08 | 13F | Thoroughbred Financial Services, Llc | 11,816 | -0.40 | 0 | |||||
| 2025-07-10 | 13F | Global Financial Private Client, LLC | 16,201 | 672 | ||||||
| 2025-07-29 | 13F | Systelligence, LLC | 411,287 | 4.01 | 17,056 | 10.15 | ||||
| 2025-05-12 | 13F | Independent Advisor Alliance | 0 | -100.00 | 0 | |||||
| 2025-08-14 | 13F | Citadel Advisors Llc | 44,789 | 1,857 | ||||||
| 2025-08-14 | 13F | Wells Fargo & Company/mn | 198 | 19,700.00 | 8 | |||||
| 2025-05-08 | 13F | Eastern Bank | 0 | -100.00 | 0 | |||||
| 2025-08-14 | 13F | Royal Bank Of Canada | 42,993 | 130.51 | 1,783 | 144.25 | ||||
| 2025-08-11 | 13F | Principal Securities, Inc. | 6,124 | 238.34 | 254 | 241.89 | ||||
| 2025-07-31 | 13F | Glass Jacobson Investment Advisors llc | 563 | 78.73 | 23 | 91.67 | ||||
| 2025-07-25 | 13F | Envestnet Portfolio Solutions, Inc. | 20,795 | 15.04 | 862 | 21.92 | ||||
| 2025-07-07 | 13F | Roxbury Financial LLC | 19,894 | -7.66 | 825 | -6.58 | ||||
| 2025-07-24 | 13F | IFP Advisors, Inc | 1,144 | 116.67 | 47 | 135.00 | ||||
| 2025-08-14 | 13F | Balanced Rock Investment Advisor | 7,636 | 317 | ||||||
| 2025-07-16 | 13F | Evergreen Private Wealth LLC | 122,952 | 4.29 | 5,099 | 10.44 | ||||
| 2025-07-22 | 13F | Wealthcare Advisory Partners LLC | 37,068 | 1,537 | ||||||
| 2025-08-15 | 13F | Morgan Stanley | 8,023 | 9,566.27 | 333 | 10,966.67 |