Mga Batayang Estadistika
| Pemilik Institusional | 132 total, 132 long only, 0 short only, 0 long/short - change of 3.12% MRQ |
| Alokasi Portofolio Rata-rata | 0.2270 % - change of -3.28% MRQ |
| Saham Institusional (Jangka Panjang) | 8,716,184 (ex 13D/G) - change of 0.27MM shares 3.24% MRQ |
| Nilai Institusional (Jangka Panjang) | $ 497,114 USD ($1000) |
Kepemilikan Institusional dan Pemegang Saham
Fidelity Covington Trust - Fidelity Value Factor ETF (US:FVAL) memiliki 132 pemilik institusional dan pemegang saham yang telah mengajukan formulir 13D/G atau 13F kepada Komisi Bursa Efek (Securities Exchange Commission/SEC). Lembaga-lembaga ini memegang total 8,716,184 saham. Pemegang saham terbesar meliputi Fmr Llc, Envestnet Asset Management Inc, Commonwealth Equity Services, Llc, High Probability Advisors, LLC, Royal Bank Of Canada, Custos Family Office, LLC, LPL Financial LLC, Advisor Group Holdings, Inc., Jpmorgan Chase & Co, and Kestra Advisory Services, LLC .
Struktur kepemilikan institusional Fidelity Covington Trust - Fidelity Value Factor ETF (ARCA:FVAL) menunjukkan posisi terkini di perusahaan oleh institusi dan dana, serta perubahan terbaru dalam ukuran posisi. Pemegang saham utama dapat mencakup investor individu, reksa dana, dana lindung nilai, atau institusi. Jadwal 13D menunjukkan bahwa investor memegang (atau pernah memegang) lebih dari 5% saham perusahaan dan bermaksud (atau pernah bermaksud) untuk secara aktif mengejar perubahan strategi bisnis. Jadwal 13G menunjukkan investasi pasif lebih dari 5%.
The share price as of September 5, 2025 is 67.54 / share. Previously, on September 9, 2024, the share price was 57.72 / share. This represents an increase of 17.01% over that period.

Skor Sentimen Dana
Skor Sentimen Dana (sebelumnya dikenal sebagai Skor Akumulasi Kepemilikan) menemukan saham-saham yang paling banyak dibeli oleh dana. Ini adalah hasil dari model kuantitatif multi-faktor yang canggih yang mengidentifikasi perusahaan dengan tingkat akumulasi institusional tertinggi. Model penilaian menggunakan kombinasi dari total peningkatan pemilik yang diungkapkan, perubahan dalam alokasi portofolio pada pemilik tersebut, dan metrik lainnya. Angka berkisar dari 0 hingga 100, dengan angka yang lebih tinggi menunjukkan tingkat akumulasi yang lebih tinggi dibandingkan dengan perusahaan sejenisnya, dan 50 adalah rata-ratanya.
Frekuensi Pembaruan: Setiap Hari
Lihat Ownership Explorer, yang menyediakan daftar perusahaan dengan peringkat tertinggi.
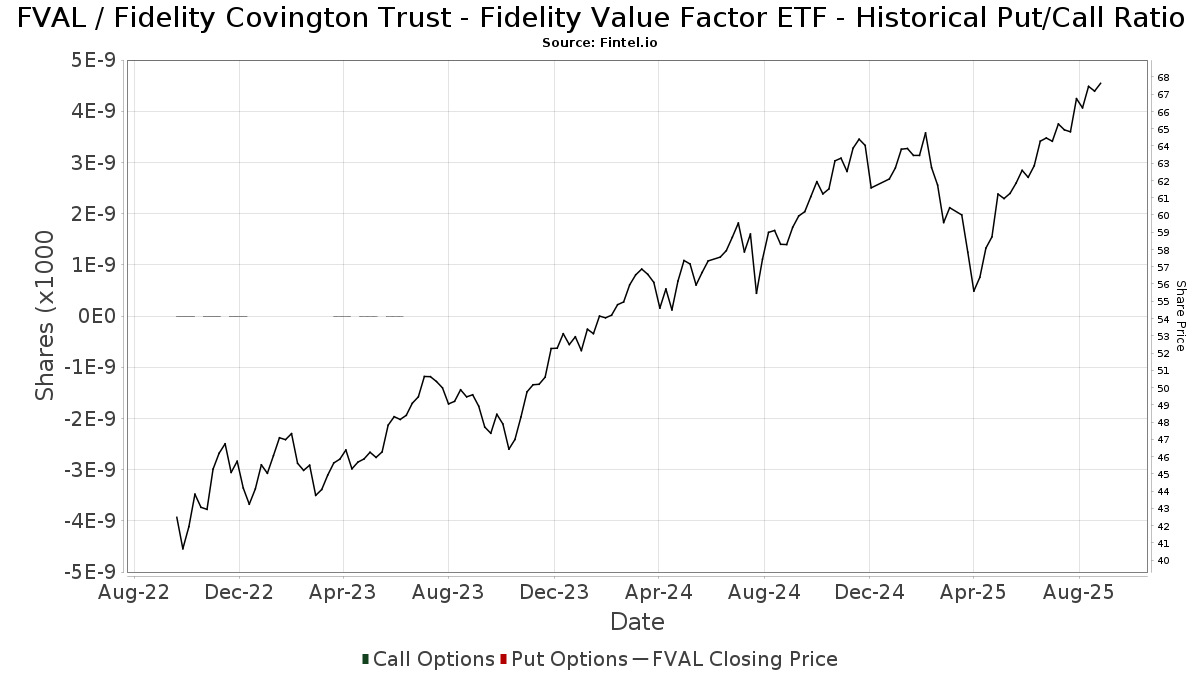
Rasio Put/Call Institusional
Selain melaporkan isu ekuitas dan utang standar, institusi dengan aset di bawah manajemen lebih dari 100 juta dolar AS juga harus mengungkapkan kepemilikan opsi put dan call mereka. Karena opsi put umumnya menunjukkan sentimen negatif, dan opsi call menunjukkan sentimen positif, kita dapat mengetahui sentimen institusional secara keseluruhan dengan memplot rasio put terhadap call. Grafik di sebelah kanan memplot rasio put/call historis untuk instrumen ini.
Menggunakan Rasio Put/Call sebagai indikator sentimen investor mengatasi salah satu kekurangan utama dari penggunaan total kepemilikan institusional, yaitu sejumlah besar aset yang dikelola diinvestasikan secara pasif untuk melacak indeks. Dana yang dikelola secara pasif biasanya tidak membeli opsi, sehingga indikator rasio put/call lebih akurat dalam melacak sentimen dana yang dikelola secara aktif.
Pengajuan 13F dan NPORT
Detail pada pengajuan 13F tersedia gratis. Detail pada pengajuan NP memerlukan keanggotaan premium. Baris berwarna hijau menunjukkan posisi baru. Baris berwarna merah menunjukkan posisi yang sudah ditutup. Klik tautan ini ikon untuk melihat riwayat transaksi selengkapnya.
Tingkatkan
untuk membuka data premium dan mengekspor ke Excel ![]() .
.
| Tanggal File | Sumber | Investor | Ketik | Presyo ng Avg (Silangan) |
Saham | Δ Saham (%) |
Dilaporkan Nilai ($1000) |
Nilai Δ (%) |
Alokasi Port (%) |
|
|---|---|---|---|---|---|---|---|---|---|---|
| 2025-08-15 | 13F | Kestra Advisory Services, LLC | 178,389 | 19.57 | 11,394 | 28.16 | ||||
| 2025-07-29 | NP | EBI - Longview Advantage ETF | 0 | -100.00 | 0 | -100.00 | ||||
| 2025-08-14 | 13F | Federation des caisses Desjardins du Quebec | 80 | 0.00 | 5 | 25.00 | ||||
| 2025-09-04 | 13F/A | Advisor Group Holdings, Inc. | 246,102 | -0.87 | 15,722 | 6.24 | ||||
| 2025-07-21 | 13F | Ameriflex Group, Inc. | 0 | -100.00 | 0 | |||||
| 2025-08-15 | 13F | Morgan Stanley | 121,470 | -3.90 | 7,758 | 3.00 | ||||
| 2025-05-12 | 13F | Americana Partners, LLC | 0 | -100.00 | 0 | |||||
| 2025-08-26 | 13F/A | Thrivent Financial For Lutherans | 26,970 | -95.28 | 2 | -97.22 | ||||
| 2025-04-21 | 13F | PSI Advisors, LLC | 0 | -100.00 | 0 | |||||
| 2025-08-14 | 13F | Certified Advisory Corp | 5,461 | 0.39 | 349 | 7.41 | ||||
| 2025-08-13 | 13F | Twin Peaks Wealth Advisors, LLC | 982 | 65 | ||||||
| 2025-07-11 | 13F | Bouvel Investment Partners, LLC | 45,304 | -9.63 | 2,894 | -4.74 | ||||
| 2025-07-25 | 13F | Atria Wealth Solutions, Inc. | 27,598 | -8.55 | 1,766 | -1.78 | ||||
| 2025-07-08 | 13F | Zrc Wealth Management, Llc | 18 | 0.00 | 1 | 0.00 | ||||
| 2025-08-08 | 13F | Thoroughbred Financial Services, Llc | 4,933 | -62.14 | 0 | |||||
| 2025-04-11 | 13F | Unique Wealth, Llc | 0 | -100.00 | 0 | |||||
| 2025-07-24 | 13F | Blair William & Co/il | 200 | 0.00 | 13 | 9.09 | ||||
| 2025-08-14 | 13F | Mml Investors Services, Llc | 12,236 | 50.23 | 1 | |||||
| 2025-07-08 | 13F | Prism Advisors, Inc. | 81,530 | 0.00 | 5,207 | 7.18 | ||||
| 2025-08-18 | 13F/A | Kestra Investment Management, LLC | 3,497 | 223 | ||||||
| 2025-08-04 | 13F | Kovack Advisors, Inc. | 5,592 | 1.10 | 357 | 8.51 | ||||
| 2025-08-14 | 13F | Stifel Financial Corp | 3,486 | -1.33 | 223 | 5.71 | ||||
| 2025-08-14 | 13F | Clarity Asset Management, Inc. | 2,129 | -6.95 | 136 | -0.74 | ||||
| 2025-07-28 | 13F | Axxcess Wealth Management, Llc | 0 | -100.00 | 0 | |||||
| 2025-07-17 | 13F | Montis Financial, LLC | 13,560 | -3.74 | 866 | 3.22 | ||||
| 2025-04-21 | 13F | PUREfi Wealth, LLC | 0 | -100.00 | 0 | |||||
| 2025-08-06 | 13F | Hoxton Planning & Management, LLC | 8,830 | 0.00 | 564 | 7.03 | ||||
| 2025-08-13 | 13F | Flow Traders U.s. Llc | 0 | -100.00 | 0 | |||||
| 2025-08-14 | 13F | Sunbelt Securities, Inc. | 8,590 | -31.87 | 529 | -29.69 | ||||
| 2025-08-07 | 13F | Kestra Private Wealth Services, Llc | 104,980 | 3.02 | 6,705 | 10.42 | ||||
| 2025-07-15 | 13F | Avaii Wealth Management, Llc | 4,527 | -0.98 | 289 | 6.25 | ||||
| 2025-07-21 | 13F | Ameritas Advisory Services, LLC | 3,496 | -62.93 | 223 | -61.28 | ||||
| 2025-07-30 | 13F | Cullen/frost Bankers, Inc. | 7,669 | 17.86 | 490 | 26.36 | ||||
| 2025-08-27 | 13F/A | Brinker Capital Investments, LLC | 31,823 | 22.00 | 2,033 | 30.76 | ||||
| 2025-08-01 | 13F | Envestnet Asset Management Inc | 1,398,051 | 7.23 | 89,293 | 14.93 | ||||
| 2025-08-04 | 13F | Spire Wealth Management | 42 | 0.00 | 3 | 0.00 | ||||
| 2025-08-12 | 13F | Atlas Capital Advisors Llc | 264 | 0.00 | 17 | 6.67 | ||||
| 2025-08-14 | 13F | Susquehanna International Group, Llp | 49,535 | 115.02 | 3,164 | 130.54 | ||||
| 2025-08-14 | 13F | Fmr Llc | 1,712,580 | 78.90 | 109,382 | 91.75 | ||||
| 2025-08-08 | 13F | CFO4Life Group, LLC | 4,118 | -3.51 | 263 | 3.54 | ||||
| 2025-08-14 | 13F | Quantinno Capital Management LP | 5,324 | 340 | ||||||
| 2025-07-30 | 13F | Strategic Blueprint, LLC | 14,467 | 924 | ||||||
| 2025-08-19 | 13F | National Asset Management, Inc. | 17,973 | 1,148 | ||||||
| 2025-08-12 | 13F | MAI Capital Management | 150,335 | 0.13 | 9,602 | 7.31 | ||||
| 2025-08-13 | 13F | Vermillion & White Wealth Management Group, LLC | 78 | 0.00 | 5 | 0.00 | ||||
| 2025-08-14 | 13F | Bank Of America Corp /de/ | 140,932 | 7.93 | 9,001 | 15.68 | ||||
| 2025-08-06 | 13F | AE Wealth Management LLC | 22,959 | -76.01 | 1,466 | -74.29 | ||||
| 2025-04-14 | 13F | Patriot Financial Group Insurance Agency, LLC | 0 | -100.00 | 0 | -100.00 | ||||
| 2025-08-12 | 13F | J.w. Cole Advisors, Inc. | 13,969 | 2.96 | 892 | 10.40 | ||||
| 2025-08-11 | 13F | Private Advisor Group, LLC | 8,104 | 10.95 | 518 | 18.85 | ||||
| 2025-07-18 | 13F | Childress Capital Advisors, Llc | 0 | -100.00 | 0 | -100.00 | ||||
| 2025-07-23 | 13F | Sax Wealth Advisors, Llc | 64,778 | 9.42 | 4,137 | 17.30 | ||||
| 2025-08-05 | 13F | Sigma Planning Corp | 23,822 | -0.51 | 1,522 | 6.66 | ||||
| 2025-08-12 | 13F | Global Retirement Partners, LLC | 5,645 | 0.18 | 361 | 4.05 | ||||
| 2025-08-07 | 13F | BOK Financial Private Wealth, Inc. | 72 | 5 | ||||||
| 2025-07-11 | 13F | Farther Finance Advisors, LLC | 4,152 | 4,672.41 | 265 | 5,200.00 | ||||
| 2025-08-18 | 13F | Geneos Wealth Management Inc. | 223 | 0.00 | 14 | 7.69 | ||||
| 2025-05-15 | 13F/A | Orion Portfolio Solutions, LLC | 26,085 | -5.62 | 1,554 | -8.59 | ||||
| 2025-08-14 | 13F/A | Rockefeller Capital Management L.P. | 26,785 | 6.47 | 1,711 | 14.08 | ||||
| 2025-08-14 | 13F | Goodwin Investment Advisory | 78,879 | 21.00 | 5,038 | 29.71 | ||||
| 2025-07-14 | 13F | AdvisorNet Financial, Inc | 1,242 | 0.32 | 79 | 8.22 | ||||
| 2025-04-30 | 13F | Quotient Wealth Partners, LLC | 0 | -100.00 | 0 | |||||
| 2025-07-15 | 13F | Colonial River Wealth Management, LLC | 0 | -100.00 | 0 | |||||
| 2025-08-04 | 13F | Assetmark, Inc | 3,652 | 2.56 | 233 | 9.91 | ||||
| 2025-08-14 | 13F | Integrated Wealth Concepts LLC | 3,242 | -30.37 | 207 | -25.27 | ||||
| 2025-08-13 | 13F | Transce3nd, LLC | 29 | 0.00 | 2 | 0.00 | ||||
| 2025-08-14 | 13F | Glen Eagle Advisors, LLC | 2,850 | 0.00 | 182 | 7.69 | ||||
| 2025-07-22 | 13F | Foguth Wealth Management, LLC. | 4,211 | -12.76 | 269 | -6.62 | ||||
| 2025-07-17 | 13F | Prepared Retirement Institute LLC | 5,927 | 0.36 | 379 | 7.69 | ||||
| 2025-07-29 | 13F | Spectrum Investment Advisors, Inc. | 15,089 | 5.96 | 964 | 13.56 | ||||
| 2025-07-10 | 13F | Wealth Enhancement Advisory Services, Llc | 10,375 | -6.91 | 672 | 1.05 | ||||
| 2025-07-16 | 13F | Signaturefd, Llc | 0 | -100.00 | 0 | |||||
| 2025-08-12 | 13F | Jpmorgan Chase & Co | 208,079 | 7.44 | 13,290 | 15.16 | ||||
| 2025-08-08 | 13F | Foundations Investment Advisors, LLC | 15,056 | 13.88 | 962 | 22.11 | ||||
| 2025-08-14 | 13F | GWM Advisors LLC | 7,775 | 6.89 | 497 | 14.55 | ||||
| 2025-07-30 | 13F | Principle Wealth Partners Llc | 6,167 | 0.00 | 394 | 7.08 | ||||
| 2025-08-01 | 13F | Gwn Securities Inc. | 9,057 | -12.34 | 579 | -6.02 | ||||
| 2025-08-14 | 13F | Qube Research & Technologies Ltd | 0 | -100.00 | 0 | |||||
| 2025-07-24 | 13F | Cyndeo Wealth Partners, LLC | 5,320 | 0.08 | 340 | 7.28 | ||||
| 2025-05-13 | 13F | Steward Partners Investment Advisory, Llc | 0 | -100.00 | 0 | |||||
| 2025-07-28 | 13F | Mowery & Schoenfeld Wealth Management, LLC | 0 | -100.00 | 0 | |||||
| 2025-08-14 | 13F | Jane Street Group, Llc | 9,283 | 593 | ||||||
| 2025-05-20 | 13F/A | Colony Group, LLC | 0 | -100.00 | 0 | |||||
| 2025-08-06 | 13F | Forbes Financial Planning, Inc. | 84,443 | -24.77 | 5,393 | -19.36 | ||||
| 2025-08-14 | 13F | Royal Bank Of Canada | 357,889 | 116.85 | 22,859 | 132.43 | ||||
| 2025-07-21 | 13F | Ascent Group, LLC | 5,183 | 2.37 | 331 | 9.97 | ||||
| 2025-07-31 | 13F | Cambridge Investment Research Advisors, Inc. | 43,647 | 26.14 | 3 | 0.00 | ||||
| 2025-08-14 | 13F | Atomi Financial Group, Inc. | 0 | -100.00 | 0 | |||||
| 2025-08-14 | 13F | Raymond James Financial Inc | 32,636 | 18.43 | 2,084 | 26.92 | ||||
| 2025-08-06 | 13F | Vantage Financial Partners, LLC | 146,131 | 0.04 | 9,333 | 7.23 | ||||
| 2025-07-15 | 13F | LVZ Advisors, Inc. | 28,311 | 1,808 | ||||||
| 2025-08-07 | 13F | New England Private Wealth Advisors LLC | 3,315 | 215 | ||||||
| 2025-08-14 | 13F | Mariner, LLC | 3,647 | -6.34 | 233 | 0.00 | ||||
| 2025-08-19 | 13F | Advisory Services Network, LLC | 4,284 | -2.86 | 277 | 5.34 | ||||
| 2025-08-08 | 13F | Cetera Investment Advisers | 177,883 | 7.89 | 11,361 | 15.63 | ||||
| 2025-08-01 | 13F | Cedar Point Capital Partners, LLC | 56,078 | 5.93 | 3,582 | 13.54 | ||||
| 2025-07-29 | 13F | Primoris Wealth Advisors, Llc | 45,482 | 40.09 | 2,905 | 50.16 | ||||
| 2025-08-04 | 13F | Bay Colony Advisory Group, Inc d/b/a Bay Colony Advisors | 4,162 | 2.54 | 266 | 10.42 | ||||
| 2025-08-13 | 13F | Northwestern Mutual Wealth Management Co | 4,062 | -45.02 | 259 | -41.14 | ||||
| 2025-08-01 | 13F | Schmidt P J Investment Management Inc | 13,335 | 185.00 | 852 | 206.12 | ||||
| 2025-07-28 | 13F | Sagespring Wealth Partners, Llc | 4,020 | -62.38 | 257 | -59.75 | ||||
| 2025-08-14 | 13F | Foronjy Financial Llc | 3,428 | 219 | ||||||
| 2025-08-14 | 13F | Comerica Bank | 2,182 | 0.00 | 139 | 6.92 | ||||
| 2025-07-21 | 13F | Custos Family Office, LLC | 321,535 | 0.72 | 20,536 | 7.95 | ||||
| 2025-08-12 | 13F | O'shaughnessy Asset Management, Llc | 57 | -82.78 | 4 | -84.21 | ||||
| 2025-08-08 | 13F | Altfest L J & Co Inc | 39,660 | -4.02 | 2,533 | 2.88 | ||||
| 2025-08-11 | 13F | Traub Capital Management LLC | 18,915 | 1,208 | ||||||
| 2025-08-13 | 13F | Jones Financial Companies Lllp | 26,135 | 53.31 | 1,662 | 64.72 | ||||
| 2025-08-14 | 13F | Harwood Advisory Group, LLC | 16,818 | -4.33 | 1,074 | -0.65 | ||||
| 2025-08-14 | 13F | Glenmede Investment Management, LP | 253 | 16 | ||||||
| 2025-05-02 | 13F | Capital A Wealth Management, LLC | 12 | 0.00 | 1 | |||||
| 2025-07-07 | 13F | Kings Path Partners LLC | 3 | 0 | ||||||
| 2025-07-30 | 13F | Avidian Wealth Solutions, LLC | 0 | -100.00 | 0 | |||||
| 2025-07-10 | 13F | Oliver Lagore Vanvalin Investment Group | 14 | 366.67 | 1 | |||||
| 2025-08-12 | 13F | SRS Capital Advisors, Inc. | 44 | 3 | ||||||
| 2025-08-05 | 13F | Dynasty Wealth Management, Llc | 4,895 | 0.55 | 313 | 7.59 | ||||
| 2025-08-14 | 13F | Goldman Sachs Group Inc | 30,572 | 10.01 | 1,953 | 17.87 | ||||
| 2025-08-07 | 13F | Allworth Financial LP | 9,558 | 0.15 | 610 | 11.11 | ||||
| 2025-08-08 | 13F | Crossmark Global Holdings, Inc. | 8,098 | -11.21 | 517 | -4.79 | ||||
| 2025-08-08 | 13F | Capital Investment Counsel, Inc | 2,230 | 0.00 | 142 | 7.58 | ||||
| 2025-08-12 | 13F | Proequities, Inc. | 0 | 0 | ||||||
| 2025-07-22 | 13F | Inlight Wealth Management, LLC | 0 | -100.00 | 0 | |||||
| 2025-08-12 | 13F | Wood Tarver Financial Group, LLC | 4,084 | 0.00 | 0 | -100.00 | ||||
| 2025-05-15 | 13F | Marshall & Sterling Wealth Advisors Inc. | 0 | -100.00 | 0 | |||||
| 2025-08-04 | 13F | Arkadios Wealth Advisors | 3,746 | 3.05 | 239 | 10.65 | ||||
| 2025-07-25 | 13F | Cwm, Llc | 0 | -100.00 | 0 | |||||
| 2025-08-06 | 13F | Golden State Wealth Management, LLC | 28 | 0.00 | 2 | 0.00 | ||||
| 2025-08-07 | 13F | Samalin Investment Counsel, LLC | 9,090 | -18.34 | 581 | -12.52 | ||||
| 2025-08-08 | 13F | Condor Capital Management | 109,495 | 1.98 | 6,993 | 9.32 | ||||
| 2025-07-23 | 13F | Valmark Advisers, Inc. | 24,748 | 0.73 | 1,581 | 7.92 | ||||
| 2025-07-25 | 13F | Sequoia Financial Advisors, LLC | 6,062 | 2.33 | 387 | 9.63 | ||||
| 2025-07-31 | 13F | CNB Bank | 686 | 0.00 | 44 | 7.50 | ||||
| 2025-08-14 | 13F | Two Sigma Investments, Lp | 101,800 | -50.44 | 6,502 | -46.88 | ||||
| 2025-08-14 | 13F | Hrt Financial Lp | 4,210 | 0 | ||||||
| 2025-08-07 | 13F | PFG Advisors | 0 | -100.00 | 0 | |||||
| 2025-08-14 | 13F | UBS Group AG | 1,179 | 75 | ||||||
| 2025-08-14 | 13F | LaSalle St. Investment Advisors, LLC | 4,791 | -20.24 | 0 | |||||
| 2025-08-12 | 13F | Founders Financial Alliance, LLC | 759 | 15.17 | 48 | 23.08 | ||||
| 2025-07-10 | 13F | Signal Advisors Wealth, LLC | 4,211 | -10.46 | 269 | -4.29 | ||||
| 2025-07-09 | 13F | Dynamic Advisor Solutions LLC | 178,222 | 2.48 | 11,383 | 9.85 | ||||
| 2025-04-28 | 13F | Clarity Capital Partners LLC | 0 | -100.00 | 0 | |||||
| 2025-08-08 | 13F | Creative Planning | 110,004 | -2.70 | 7,026 | 4.27 | ||||
| 2025-08-13 | 13F | Russell Investments Group, Ltd. | 37 | 2 | ||||||
| 2025-08-14 | 13F | Citadel Advisors Llc | 32,237 | -25.23 | 2,059 | -19.89 | ||||
| 2025-08-06 | 13F | Commonwealth Equity Services, Llc | 830,198 | -2.73 | 53 | 6.00 | ||||
| 2025-08-12 | 13F | LPL Financial LLC | 294,469 | 15.90 | 18,808 | 24.22 | ||||
| 2025-08-14 | 13F | CoreCap Advisors, LLC | 5,352 | -1.20 | 342 | 5.90 | ||||
| 2025-05-19 | 13F | Heck Capital Advisors, LLC | 0 | 0 | ||||||
| 2025-07-09 | 13F | High Probability Advisors, LLC | 414,937 | 9.83 | 26,502 | 17.72 | ||||
| 2025-08-13 | 13F | Cerity Partners LLC | 7,853 | 0.10 | 502 | 7.28 | ||||
| 2025-07-07 | 13F | Thurston, Springer, Miller, Herd & Titak, Inc. | 245 | 0.00 | 16 | 7.14 | ||||
| 2025-08-14 | 13F | Wells Fargo & Company/mn | 23 | -93.92 | 1 | -95.45 | ||||
| 2025-08-11 | 13F | Citigroup Inc | 2,054 | 0.00 | 131 | 7.38 | ||||
| 2025-07-24 | 13F | IFP Advisors, Inc | 3,317 | 5.60 | 212 | 12.83 | ||||
| 2025-07-31 | 13F | Glass Jacobson Investment Advisors llc | 3,968 | 0.84 | 253 | 4.55 | ||||
| 2025-08-11 | 13F | Principal Securities, Inc. | 613 | -77.72 | 39 | -76.92 | ||||
| 2025-07-25 | 13F | Envestnet Portfolio Solutions, Inc. | 29,371 | 12.72 | 1,876 | 20.81 | ||||
| 2025-04-17 | 13F | Fairvoy Private Wealth, LLC | 0 | -100.00 | 0 | |||||
| 2025-08-14 | 13F | Kovitz Investment Group Partners, LLC | 3,500 | 224 | ||||||
| 2025-08-11 | 13F | NewEdge Wealth, LLC | 0 | -100.00 | 0 |