Mga Batayang Estadistika
| Pemilik Institusional | 121 total, 121 long only, 0 short only, 0 long/short - change of 18.45% MRQ |
| Alokasi Portofolio Rata-rata | 0.3440 % - change of -1.68% MRQ |
| Saham Institusional (Jangka Panjang) | 5,885,683 (ex 13D/G) - change of -0.50MM shares -7.78% MRQ |
| Nilai Institusional (Jangka Panjang) | $ 209,645 USD ($1000) |
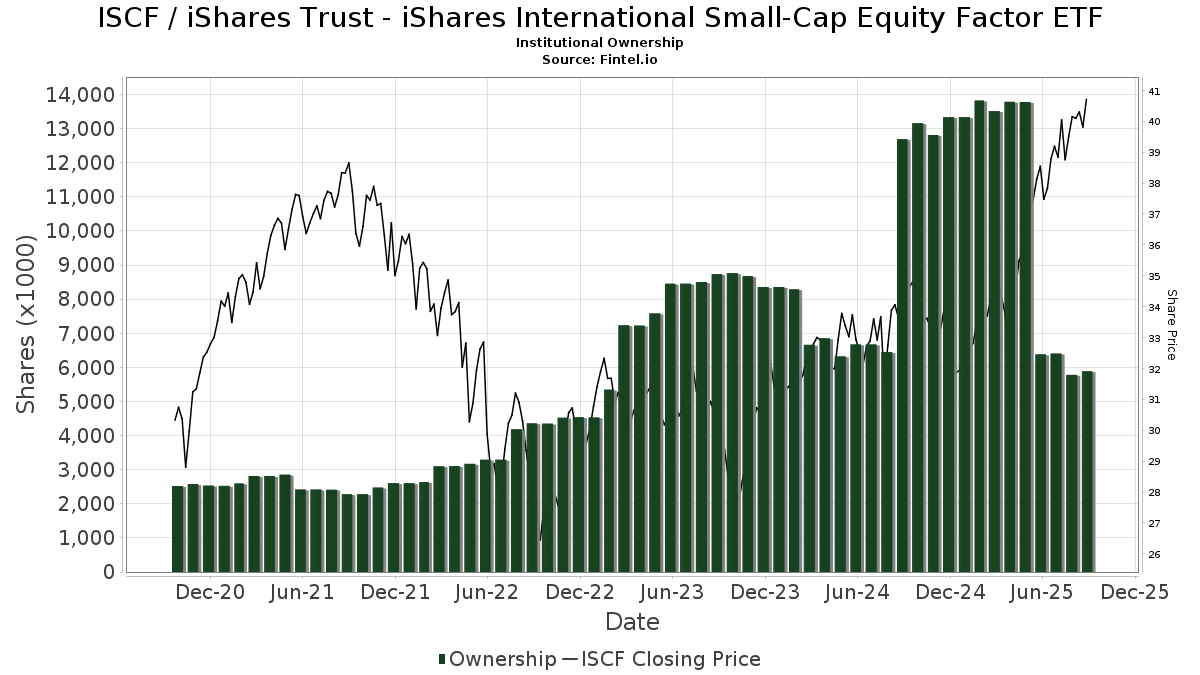
Kepemilikan Institusional dan Pemegang Saham
iShares Trust - iShares International Small-Cap Equity Factor ETF (US:ISCF) memiliki 121 pemilik institusional dan pemegang saham yang telah mengajukan formulir 13D/G atau 13F kepada Komisi Bursa Efek (Securities Exchange Commission/SEC). Lembaga-lembaga ini memegang total 5,885,683 saham. Pemegang saham terbesar meliputi Envestnet Asset Management Inc, Modern Wealth Management, LLC, FGSM - Frontier Asset Global Small Cap Equity ETF, Phoenix Wealth Advisors, Janney Montgomery Scott LLC, Financial Strategies Group, Inc., LPL Financial LLC, Larson Financial Group LLC, Northwestern Mutual Wealth Management Co, and Exchange Traded Concepts, Llc .
Struktur kepemilikan institusional iShares Trust - iShares International Small-Cap Equity Factor ETF (ARCA:ISCF) menunjukkan posisi terkini di perusahaan oleh institusi dan dana, serta perubahan terbaru dalam ukuran posisi. Pemegang saham utama dapat mencakup investor individu, reksa dana, dana lindung nilai, atau institusi. Jadwal 13D menunjukkan bahwa investor memegang (atau pernah memegang) lebih dari 5% saham perusahaan dan bermaksud (atau pernah bermaksud) untuk secara aktif mengejar perubahan strategi bisnis. Jadwal 13G menunjukkan investasi pasif lebih dari 5%.
The share price as of September 5, 2025 is 40.44 / share. Previously, on September 9, 2024, the share price was 33.37 / share. This represents an increase of 21.19% over that period.
Skor Sentimen Dana
Skor Sentimen Dana (sebelumnya dikenal sebagai Skor Akumulasi Kepemilikan) menemukan saham-saham yang paling banyak dibeli oleh dana. Ini adalah hasil dari model kuantitatif multi-faktor yang canggih yang mengidentifikasi perusahaan dengan tingkat akumulasi institusional tertinggi. Model penilaian menggunakan kombinasi dari total peningkatan pemilik yang diungkapkan, perubahan dalam alokasi portofolio pada pemilik tersebut, dan metrik lainnya. Angka berkisar dari 0 hingga 100, dengan angka yang lebih tinggi menunjukkan tingkat akumulasi yang lebih tinggi dibandingkan dengan perusahaan sejenisnya, dan 50 adalah rata-ratanya.
Frekuensi Pembaruan: Setiap Hari
Lihat Ownership Explorer, yang menyediakan daftar perusahaan dengan peringkat tertinggi.
Rasio Put/Call Institusional
Selain melaporkan isu ekuitas dan utang standar, institusi dengan aset di bawah manajemen lebih dari 100 juta dolar AS juga harus mengungkapkan kepemilikan opsi put dan call mereka. Karena opsi put umumnya menunjukkan sentimen negatif, dan opsi call menunjukkan sentimen positif, kita dapat mengetahui sentimen institusional secara keseluruhan dengan memplot rasio put terhadap call. Grafik di sebelah kanan memplot rasio put/call historis untuk instrumen ini.
Menggunakan Rasio Put/Call sebagai indikator sentimen investor mengatasi salah satu kekurangan utama dari penggunaan total kepemilikan institusional, yaitu sejumlah besar aset yang dikelola diinvestasikan secara pasif untuk melacak indeks. Dana yang dikelola secara pasif biasanya tidak membeli opsi, sehingga indikator rasio put/call lebih akurat dalam melacak sentimen dana yang dikelola secara aktif.
Pengajuan 13F dan NPORT
Detail pada pengajuan 13F tersedia gratis. Detail pada pengajuan NP memerlukan keanggotaan premium. Baris berwarna hijau menunjukkan posisi baru. Baris berwarna merah menunjukkan posisi yang sudah ditutup. Klik tautan ini ikon untuk melihat riwayat transaksi selengkapnya.
Tingkatkan
untuk membuka data premium dan mengekspor ke Excel ![]() .
.
| Tanggal File | Sumber | Investor | Ketik | Presyo ng Avg (Silangan) |
Saham | Δ Saham (%) |
Dilaporkan Nilai ($1000) |
Nilai Δ (%) |
Alokasi Port (%) |
|
|---|---|---|---|---|---|---|---|---|---|---|
| 2025-07-09 | 13F | Breakwater Capital Group | 22,531 | 0.34 | 874 | 15.48 | ||||
| 2025-08-13 | 13F | MONECO Advisors, LLC | 6,245 | -8.30 | 242 | 5.68 | ||||
| 2025-08-13 | 13F | Beacon Pointe Advisors, LLC | 149,510 | -19.34 | 5,797 | -7.15 | ||||
| 2025-04-21 | 13F | Ronald Blue Trust, Inc. | 0 | -100.00 | 0 | |||||
| 2025-07-11 | 13F | Farther Finance Advisors, LLC | 37,267 | -9.02 | 1,445 | 4.64 | ||||
| 2025-07-16 | 13F | Perigon Wealth Management, LLC | 36,792 | -6.16 | 1,426 | 8.03 | ||||
| 2025-07-29 | 13F | Signature Estate & Investment Advisors Llc | 5,504 | 213 | ||||||
| 2025-08-19 | 13F | Anchor Investment Management, LLC | 800 | 0.00 | 31 | 19.23 | ||||
| 2025-08-01 | 13F | Envestnet Asset Management Inc | 410,647 | -27.18 | 15,921 | -16.18 | ||||
| 2025-08-27 | 13F | Stonebridge Wealth Management, LLC | 21,124 | 819 | ||||||
| 2025-08-12 | 13F | Howe & Rusling Inc | 33 | 1 | ||||||
| 2025-08-14 | 13F | Vista Investment Management | 27,550 | 1.88 | 1,068 | 17.36 | ||||
| 2025-08-06 | 13F | Modera Wealth Management, LLC | 34,684 | 0.00 | 1,345 | 15.07 | ||||
| 2025-09-04 | 13F/A | Advisor Group Holdings, Inc. | 36,738 | 8.04 | 1,424 | 24.37 | ||||
| 2025-08-06 | 13F | Adviser Investments LLC | 21,560 | -27.82 | 836 | -17.00 | ||||
| 2025-08-13 | 13F | Flow Traders U.s. Llc | 0 | -100.00 | 0 | |||||
| 2025-08-12 | 13F | LPL Financial LLC | 204,716 | 5.32 | 7,937 | 21.23 | ||||
| 2025-07-23 | 13F | Eagle Strategies LLC | 136,888 | 5.42 | 5,307 | 21.36 | ||||
| 2025-07-14 | 13F | Sowell Financial Services LLC | 5,417 | 210 | ||||||
| 2025-07-24 | 13F | Capital Advisors, Ltd. LLC | 2,600 | 0.00 | 0 | |||||
| 2025-08-08 | 13F | Cetera Investment Advisers | 65,505 | 27.50 | 2,540 | 46.76 | ||||
| 2025-08-08 | 13F | Kingsview Wealth Management, LLC | 6,202 | -12.92 | 240 | 0.42 | ||||
| 2025-08-26 | NP | EVTTX - The E-Valuator Conservative/Moderate (30%-50%) RMS Fund Service Class Shares | 2,008 | -6.34 | 78 | 16.67 | ||||
| 2025-08-26 | NP | EVVLX - The E-Valuator Very Conservative (0%-15%) RMS Fund Service Class Shares | 855 | 33 | ||||||
| 2025-08-08 | 13F | Intrua Financial, LLC | 27,728 | 359.30 | 1,075 | 429.56 | ||||
| 2025-08-08 | 13F | Advyzon Investment Management, LLC | 6,204 | -0.89 | 241 | 14.29 | ||||
| 2025-07-10 | 13F | Exchange Traded Concepts, Llc | 161,595 | -46.72 | 6,265 | -38.66 | ||||
| 2025-07-17 | 13F | Montis Financial, LLC | 26,631 | 33.25 | 1,033 | 53.34 | ||||
| 2025-08-15 | 13F | Morgan Stanley | 4,543 | -2.11 | 176 | 12.82 | ||||
| 2025-08-26 | NP | EVMLX - The E-Valuator Moderate (50%-70%) RMS Fund Service Class Shares | 15,957 | -8.26 | 619 | 15.30 | ||||
| 2025-07-24 | 13F | IFP Advisors, Inc | 224 | 9 | ||||||
| 2025-08-14 | 13F | Royal Bank Of Canada | 7,792 | 1.96 | 302 | 17.51 | ||||
| 2025-07-16 | 13F | Beaumont Financial Advisors, LLC | 6,714 | 0.57 | 260 | 16.07 | ||||
| 2025-04-11 | 13F | Insight Advisors, LLC/ PA | 0 | -100.00 | 0 | |||||
| 2025-07-30 | 13F | Bogart Wealth, LLC | 326 | 44.89 | 13 | 71.43 | ||||
| 2025-08-08 | 13F | Avantax Advisory Services, Inc. | 5,332 | 207 | ||||||
| 2025-07-28 | 13F | Courier Capital Llc | 156,817 | 2.22 | 6,080 | 17.67 | ||||
| 2025-08-14 | 13F | Jane Street Group, Llc | 17,014 | -83.53 | 660 | -81.06 | ||||
| 2025-05-14 | 13F | Susquehanna International Group, Llp | 0 | -100.00 | 0 | |||||
| 2025-08-08 | 13F | JBF Capital, Inc. | 56,312 | 2,183 | ||||||
| 2025-07-30 | 13F | Exencial Wealth Advisors, Llc | 11,257 | 0.75 | 436 | 15.96 | ||||
| 2025-08-13 | 13F | Financial Freedom, LLC | 30,477 | 12.66 | 1,182 | 29.64 | ||||
| 2025-08-14 | 13F | Financial Strategies Group, Inc. | 208,182 | 2.58 | 8,117 | 18.70 | ||||
| 2025-08-12 | 13F | Steward Partners Investment Advisory, Llc | 0 | -100.00 | 0 | |||||
| 2025-08-14 | 13F | Integrated Wealth Concepts LLC | 10,142 | -4.43 | 393 | 10.08 | ||||
| 2025-07-24 | 13F | Williams & Novak, LLC | 54,191 | 8.50 | 2,101 | 24.78 | ||||
| 2025-07-25 | 13F | Cwm, Llc | 312 | 4.00 | 0 | |||||
| 2025-08-07 | 13F | Allworth Financial LP | 184 | -23.65 | 7 | -12.50 | ||||
| 2025-08-14 | 13F | Ariadne Wealth Management, LP | 9,795 | -20.62 | 393 | -11.69 | ||||
| 2025-08-08 | 13F | Larson Financial Group LLC | 182,907 | 961.25 | 7,091 | 1,122.59 | ||||
| 2025-08-06 | 13F | Horizon Investment Services, LLC | 19,511 | -3.00 | 756 | 11.67 | ||||
| 2025-08-14 | 13F | Mml Investors Services, Llc | 89,435 | -24.11 | 3 | 0.00 | ||||
| 2025-08-05 | 13F | GHP Investment Advisors, Inc. | 4,360 | 0.00 | 169 | 15.75 | ||||
| 2025-08-14 | 13F | UBS Group AG | 1 | 0 | ||||||
| 2025-05-09 | 13F | GeoWealth Management, LLC | 0 | -100.00 | 0 | -100.00 | ||||
| 2025-07-25 | 13F | Index Fund Advisors, Inc. | 18,016 | 1.89 | 698 | 17.31 | ||||
| 2025-08-14 | 13F | Warren Averett Asset Management, LLC | 34,806 | 0.68 | 1,349 | 15.89 | ||||
| 2025-08-04 | 13F | Arbor Capital Management Inc /adv | 10,870 | 17.29 | 421 | 35.37 | ||||
| 2025-07-31 | 13F | Glass Jacobson Investment Advisors llc | 50,320 | 1.13 | 1,951 | 21.42 | ||||
| 2025-08-06 | 13F | Commonwealth Equity Services, Llc | 97,278 | -0.87 | 4 | 0.00 | ||||
| 2025-08-01 | 13F | Rossby Financial, LCC | 200 | 0.00 | 8 | 0.00 | ||||
| 2025-08-08 | 13F | Advisors Capital Management, LLC | 123,387 | 95.01 | 4,784 | 124.55 | ||||
| 2025-08-12 | 13F | Bedel Financial Consulting, Inc. | 123,178 | -0.64 | 4,776 | 6.75 | ||||
| 2025-08-14 | 13F | Beaird Harris Wealth Management, LLC | 143,139 | -3.88 | 5,550 | 10.65 | ||||
| 2025-05-12 | 13F | Regal Investment Advisors LLC | 0 | -100.00 | 0 | |||||
| 2025-08-13 | 13F | Vance Wealth, Inc. | 9,787 | 379 | ||||||
| 2025-07-07 | 13F | Thurston, Springer, Miller, Herd & Titak, Inc. | 30,787 | 597.80 | 1,194 | 706.08 | ||||
| 2025-08-14 | 13F | Aqr Capital Management Llc | 0 | -100.00 | 0 | |||||
| 2025-07-24 | 13F | McKinley Carter Wealth Services, Inc. | 0 | -100.00 | 0 | |||||
| 2025-07-10 | 13F | Wealth Enhancement Advisory Services, Llc | 6,381 | 248 | ||||||
| 2025-07-22 | 13F | Belpointe Asset Management LLC | 9,038 | -3.83 | 350 | 10.76 | ||||
| 2025-08-14 | 13F | Mercer Global Advisors Inc /adv | 18,366 | -9.74 | 712 | 3.94 | ||||
| 2025-05-14 | 13F | Arizona PSPRS Trust | 0 | -100.00 | 0 | |||||
| 2025-07-17 | 13F | KWB Wealth | 21,872 | 737 | ||||||
| 2025-08-12 | 13F | Jpmorgan Chase & Co | 505 | 20 | ||||||
| 2025-08-13 | 13F | Northwestern Mutual Wealth Management Co | 175,225 | 29.34 | 6,793 | 48.90 | ||||
| 2025-08-26 | NP | EVAGX - The E-Valuator Aggressive Growth (85%-99%) RMS Fund Service Class Shares | 26,631 | -22.53 | 1,032 | -2.64 | ||||
| 2025-08-14 | 13F | Colony Group, LLC | 15,182 | 589 | ||||||
| 2025-08-07 | 13F | AllGen Financial Advisors, Inc. | 82,865 | -55.02 | 3,213 | -48.23 | ||||
| 2025-07-18 | 13F | BSW Wealth Partners | 0 | -100.00 | 0 | |||||
| 2025-08-19 | 13F | Asset Dedication, LLC | 1,687 | 18.22 | 65 | 35.42 | ||||
| 2025-07-25 | 13F | RHS Financial, LLC | 45,685 | -46.82 | 1,771 | -38.78 | ||||
| 2025-07-31 | 13F | Cambridge Investment Research Advisors, Inc. | 25,227 | -45.80 | 1 | -100.00 | ||||
| 2025-08-05 | 13F | Bank Of Montreal /can/ | 78 | 3 | ||||||
| 2025-08-14 | 13F | Raymond James Financial Inc | 58,561 | 2.09 | 2,270 | 17.49 | ||||
| 2025-08-05 | 13F | WorthPointe, LLC | 9,251 | 359 | ||||||
| 2025-07-17 | 13F | Janney Montgomery Scott LLC | 236,916 | -1.39 | 9 | 12.50 | ||||
| 2025-08-14 | 13F | Certified Advisory Corp | 30,948 | -12.06 | 1,200 | 1.18 | ||||
| 2025-08-06 | 13F | AE Wealth Management LLC | 90 | 0.00 | 3 | 0.00 | ||||
| 2025-07-16 | 13F | TCI Wealth Advisors, Inc. | 10,617 | -11.86 | 412 | 1.48 | ||||
| 2025-08-11 | 13F | Bell Investment Advisors, Inc | 115,893 | 23.10 | 4,493 | 41.74 | ||||
| 2025-05-02 | 13F | Parcion Private Wealth LLC | 0 | -100.00 | 0 | -100.00 | ||||
| 2025-08-26 | NP | EVGLX - The E-Valuator Growth (70%-85%) RMS Fund Service Class Shares | 20,624 | -54.66 | 800 | -43.05 | ||||
| 2025-08-04 | 13F | Arkadios Wealth Advisors | 10,798 | 20.49 | 419 | 38.87 | ||||
| 2025-08-26 | NP | EVCLX - The E-Valuator Conservative (15%-30%) RMS Fund Service Class Shares | 2,083 | -14.94 | 81 | 6.67 | ||||
| 2025-07-28 | 13F | Morris Financial Concepts, Inc. | 2,486 | -8.97 | 96 | 5.49 | ||||
| 2025-08-11 | 13F | Principal Securities, Inc. | 1,000 | 0.00 | 39 | 18.75 | ||||
| 2025-08-14 | 13F | Wells Fargo & Company/mn | 0 | -100.00 | 0 | |||||
| 2025-08-08 | 13F | Phoenix Wealth Advisors | 268,743 | 3.72 | 10,419 | 19.39 | ||||
| 2025-08-12 | 13F | Proequities, Inc. | 0 | 0 | ||||||
| 2025-07-24 | 13F | Comprehensive Money Management Services LLC | 5,188 | 201 | ||||||
| 2025-07-25 | 13F | Wealth Advisory Team LLC | 12,141 | 471 | ||||||
| 2025-08-11 | 13F | HighTower Advisors, LLC | 93,017 | 1.56 | 3,606 | 16.93 | ||||
| 2025-05-14 | 13F | Capital Analysts, Inc. | 0 | -100.00 | 0 | |||||
| 2025-07-16 | 13F | Signature Resources Capital Management, LLC | 917 | 0.00 | 36 | 16.67 | ||||
| 2025-08-14 | 13F | Bank Of America Corp /de/ | 46,167 | 0.74 | 1,790 | 15.94 | ||||
| 2025-07-14 | 13F | Sentinel Pension Advisors Inc | 8,403 | 5.51 | 326 | 21.27 | ||||
| 2025-08-14 | 13F | Great Valley Advisor Group, Inc. | 11,849 | -64.94 | 459 | -59.67 | ||||
| 2025-04-21 | 13F | LifeGoal Wealth Advisors | 0 | -100.00 | 0 | |||||
| 2025-07-14 | 13F | Narus Financial Partners, LLC | 11,194 | -4.08 | 434 | 10.18 | ||||
| 2025-08-14 | 13F | Ambassador Advisors, LLC | 9,324 | 22.01 | 361 | 40.47 | ||||
| 2025-08-11 | 13F | Aptus Capital Advisors, LLC | 12,141 | -89.24 | 471 | -87.64 | ||||
| 2025-08-12 | 13F | AlphaCore Capital LLC | 458 | 0.00 | 18 | 13.33 | ||||
| 2025-08-15 | 13F | Captrust Financial Advisors | 21,555 | -22.92 | 836 | -11.26 | ||||
| 2025-07-29 | 13F | Chicago Partners Investment Group LLC | 24,437 | 0.00 | 978 | 11.90 | ||||
| 2025-08-06 | 13F | First Horizon Advisors, Inc. | 149 | 0.00 | 6 | 0.00 | ||||
| 2025-07-22 | 13F | Merit Financial Group, LLC | 137,350 | 5,325 | ||||||
| 2025-08-15 | 13F | Equitable Holdings, Inc. | 26,090 | 1.57 | 1,012 | 16.88 | ||||
| 2025-07-28 | 13F | Harbour Investments, Inc. | 8 | 0.00 | 0 | |||||
| 2025-08-13 | 13F | Cerity Partners LLC | 103,647 | 1.34 | 4,018 | 16.67 | ||||
| 2025-07-15 | 13F | McAdam, LLC | 158,882 | 9.30 | 6,160 | 25.82 | ||||
| 2025-08-14 | 13F | Wiley Bros.-aintree Capital, Llc | 42,446 | -0.22 | 1,646 | 13.84 | ||||
| 2025-06-26 | NP | FGSM - Frontier Asset Global Small Cap Equity ETF | 294,918 | 7.86 | 10,467 | 16.29 | ||||
| 2025-07-29 | 13F | Systelligence, LLC | 68,158 | 2,642 | ||||||
| 2025-05-14 | 13F/A | Waddell & Associates, Llc | 0 | -100.00 | 0 | -100.00 | ||||
| 2025-07-21 | 13F | Fortis Capital Advisors, LLC | 9,038 | -3.83 | 350 | 10.76 | ||||
| 2025-08-01 | 13F | SYM FINANCIAL Corp | 2,111 | 9.49 | 82 | 26.56 | ||||
| 2025-08-14 | 13F | Fmr Llc | 731 | 61.37 | 28 | 86.67 | ||||
| 2025-08-14 | 13F | Stifel Financial Corp | 68,887 | -0.57 | 2,671 | 14.44 | ||||
| 2025-08-11 | 13F | TD Waterhouse Canada Inc. | 806 | 0.00 | 31 | 14.81 | ||||
| 2025-07-24 | 13F | Edge Financial Advisors LLC | 38,437 | 2.04 | 1,490 | 17.51 | ||||
| 2025-08-08 | 13F | Creative Planning | 8,537 | 331 | ||||||
| 2025-08-12 | 13F | J.w. Cole Advisors, Inc. | 21,495 | 833 | ||||||
| 2025-07-30 | 13F | Princeton Global Asset Management LLC | 130 | 0.00 | 5 | 25.00 | ||||
| 2025-08-14 | 13F | Citadel Advisors Llc | 0 | -100.00 | 0 | |||||
| 2025-07-10 | 13F | White Wing Wealth Management | 58,086 | -3.44 | 2,252 | 10.13 | ||||
| 2025-07-31 | 13F | Longview Financial Advisors, Inc. | 25,436 | -2.18 | 986 | 12.69 | ||||
| 2025-08-05 | 13F | Bank of New York Mellon Corp | 35,328 | -0.29 | 1,370 | 14.75 | ||||
| 2025-08-14 | 13F | Modern Wealth Management, LLC | 340,583 | -0.01 | 13,204 | 15.11 |