Mga Batayang Estadistika
| Pemilik Institusional | 73 total, 72 long only, 0 short only, 1 long/short - change of -18.89% MRQ |
| Alokasi Portofolio Rata-rata | 0.1419 % - change of -51.65% MRQ |
| Saham Institusional (Jangka Panjang) | 6,594,872 (ex 13D/G) - change of -9.66MM shares -59.44% MRQ |
| Nilai Institusional (Jangka Panjang) | $ 123,491 USD ($1000) |
Kepemilikan Institusional dan Pemegang Saham
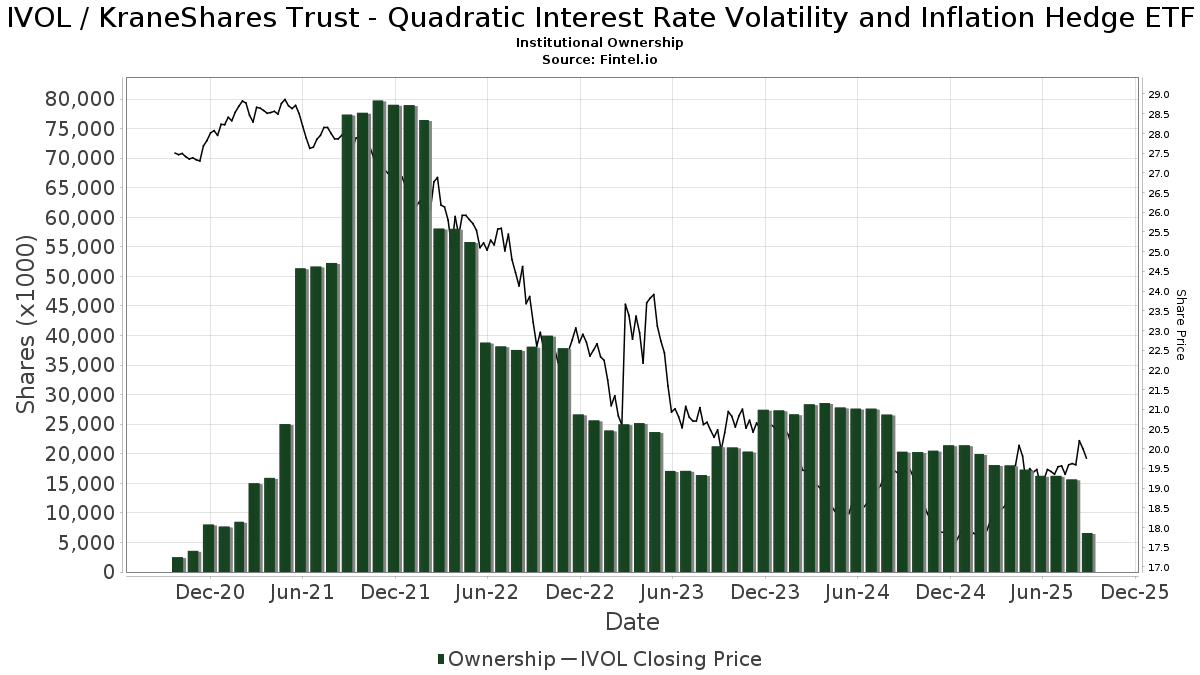
KraneShares Trust - Quadratic Interest Rate Volatility and Inflation Hedge ETF (US:IVOL) memiliki 73 pemilik institusional dan pemegang saham yang telah mengajukan formulir 13D/G atau 13F kepada Komisi Bursa Efek (Securities Exchange Commission/SEC). Lembaga-lembaga ini memegang total 6,594,872 saham. Pemegang saham terbesar meliputi Raymond James Financial Inc, Wealth Enhancement Advisory Services, Llc, Ambassador Advisors, LLC, CacheTech Inc., Adams Wealth Management, Wells Fargo & Company/mn, Morgan Stanley, Regal Investment Advisors LLC, Royal Bank Of Canada, and BCS Private Wealth Management, Inc. .
Struktur kepemilikan institusional KraneShares Trust - Quadratic Interest Rate Volatility and Inflation Hedge ETF (ARCA:IVOL) menunjukkan posisi terkini di perusahaan oleh institusi dan dana, serta perubahan terbaru dalam ukuran posisi. Pemegang saham utama dapat mencakup investor individu, reksa dana, dana lindung nilai, atau institusi. Jadwal 13D menunjukkan bahwa investor memegang (atau pernah memegang) lebih dari 5% saham perusahaan dan bermaksud (atau pernah bermaksud) untuk secara aktif mengejar perubahan strategi bisnis. Jadwal 13G menunjukkan investasi pasif lebih dari 5%.
The share price as of September 5, 2025 is 19.93 / share. Previously, on September 9, 2024, the share price was 19.48 / share. This represents an increase of 2.31% over that period.
Skor Sentimen Dana
Skor Sentimen Dana (sebelumnya dikenal sebagai Skor Akumulasi Kepemilikan) menemukan saham-saham yang paling banyak dibeli oleh dana. Ini adalah hasil dari model kuantitatif multi-faktor yang canggih yang mengidentifikasi perusahaan dengan tingkat akumulasi institusional tertinggi. Model penilaian menggunakan kombinasi dari total peningkatan pemilik yang diungkapkan, perubahan dalam alokasi portofolio pada pemilik tersebut, dan metrik lainnya. Angka berkisar dari 0 hingga 100, dengan angka yang lebih tinggi menunjukkan tingkat akumulasi yang lebih tinggi dibandingkan dengan perusahaan sejenisnya, dan 50 adalah rata-ratanya.
Frekuensi Pembaruan: Setiap Hari
Lihat Ownership Explorer, yang menyediakan daftar perusahaan dengan peringkat tertinggi.
Rasio Put/Call Institusional
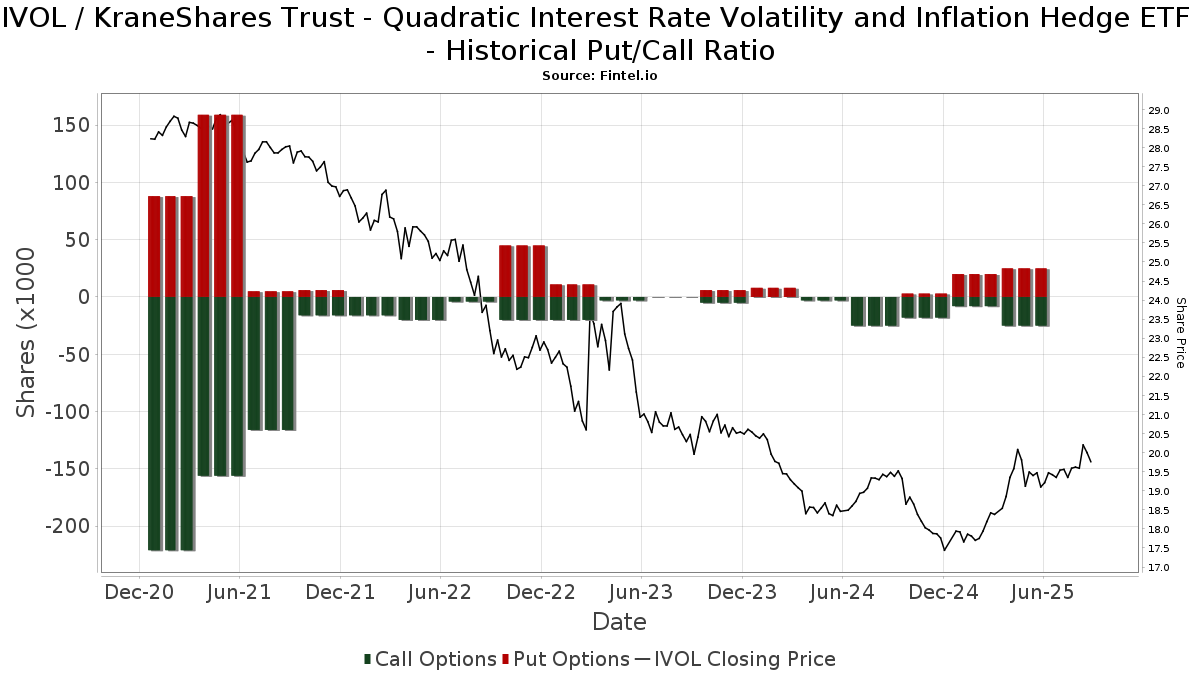
Selain melaporkan isu ekuitas dan utang standar, institusi dengan aset di bawah manajemen lebih dari 100 juta dolar AS juga harus mengungkapkan kepemilikan opsi put dan call mereka. Karena opsi put umumnya menunjukkan sentimen negatif, dan opsi call menunjukkan sentimen positif, kita dapat mengetahui sentimen institusional secara keseluruhan dengan memplot rasio put terhadap call. Grafik di sebelah kanan memplot rasio put/call historis untuk instrumen ini.
Menggunakan Rasio Put/Call sebagai indikator sentimen investor mengatasi salah satu kekurangan utama dari penggunaan total kepemilikan institusional, yaitu sejumlah besar aset yang dikelola diinvestasikan secara pasif untuk melacak indeks. Dana yang dikelola secara pasif biasanya tidak membeli opsi, sehingga indikator rasio put/call lebih akurat dalam melacak sentimen dana yang dikelola secara aktif.
Pengajuan 13F dan NPORT
Detail pada pengajuan 13F tersedia gratis. Detail pada pengajuan NP memerlukan keanggotaan premium. Baris berwarna hijau menunjukkan posisi baru. Baris berwarna merah menunjukkan posisi yang sudah ditutup. Klik tautan ini ikon untuk melihat riwayat transaksi selengkapnya.
Tingkatkan
untuk membuka data premium dan mengekspor ke Excel ![]() .
.
| Tanggal File | Sumber | Investor | Ketik | Presyo ng Avg (Silangan) |
Saham | Δ Saham (%) |
Dilaporkan Nilai ($1000) |
Nilai Δ (%) |
Alokasi Port (%) |
|
|---|---|---|---|---|---|---|---|---|---|---|
| 2025-08-14 | 13F | Hilltop Holdings Inc. | 21,778 | -27.40 | 426 | -24.11 | ||||
| 2025-05-09 | 13F | Cary Street Partners Financial Llc | 0 | -100.00 | 0 | |||||
| 2025-07-24 | 13F | Ronald Blue Trust, Inc. | 0 | -100.00 | 0 | |||||
| 2025-08-06 | 13F | Richard Bernstein Advisors LLC | 406 | -99.99 | 8 | -99.99 | ||||
| 2025-07-23 | 13F | Mraz, Amerine & Associates, Inc. | 30,989 | -8.35 | 606 | -4.11 | ||||
| 2025-08-14 | 13F | Mml Investors Services, Llc | 0 | -100.00 | 0 | |||||
| 2025-08-13 | 13F | Financial Freedom, LLC | 0 | -100.00 | 0 | |||||
| 2025-08-06 | 13F | Commonwealth Equity Services, Llc | 32,352 | 28.69 | 1 | |||||
| 2025-08-11 | 13F | Regal Investment Advisors LLC | 277,662 | 1.66 | 5,431 | 6.45 | ||||
| 2025-08-14 | 13F | Royal Bank Of Canada | 243,738 | -40.78 | 4,758 | -38.10 | ||||
| 2025-07-29 | 13F | Chicago Partners Investment Group LLC | 97,624 | 0.00 | 1,910 | -1.24 | ||||
| 2025-08-14 | 13F | Coastal Bridge Advisors, LLC | 0 | -100.00 | 0 | -100.00 | ||||
| 2025-08-14 | 13F | Balyasny Asset Management Llc | 0 | -100.00 | 0 | |||||
| 2025-08-01 | 13F | Transcend Wealth Collective, Llc | 0 | -100.00 | 0 | |||||
| 2025-08-04 | 13F | Bay Colony Advisory Group, Inc d/b/a Bay Colony Advisors | 44,006 | 0.07 | 861 | 4.62 | ||||
| 2025-08-14 | 13F | Raymond James Financial Inc | 781,437 | -1.63 | 15,285 | 3.00 | ||||
| 2025-05-09 | 13F | Pnc Financial Services Group, Inc. | 0 | -100.00 | 0 | |||||
| 2025-08-15 | 13F | CI Private Wealth, LLC | 0 | -100.00 | 0 | |||||
| 2025-04-28 | 13F | Capital Investment Counsel, Inc | 0 | -100.00 | 0 | -100.00 | ||||
| 2025-08-05 | 13F | EPG Wealth Management LLC | 8,263 | 0.81 | 162 | 5.23 | ||||
| 2025-07-24 | 13F | IFP Advisors, Inc | 20,655 | -70.68 | 404 | -69.30 | ||||
| 2025-07-17 | 13F | Janney Montgomery Scott LLC | 0 | -100.00 | 0 | |||||
| 2025-04-25 | 13F | Stonebridge Financial Group, LLC | 0 | -100.00 | 0 | |||||
| 2025-08-12 | 13F | Steward Partners Investment Advisory, Llc | 13,736 | 0.01 | 269 | 4.69 | ||||
| 2025-08-12 | 13F | TCTC Holdings, LLC | 1,624 | 0.00 | 32 | 3.33 | ||||
| 2025-08-01 | 13F | Brookwood Investment Group LLC | 157,186 | 3,075 | ||||||
| 2025-08-13 | 13F | Scotia Capital Inc. | 0 | -100.00 | 0 | |||||
| 2025-08-14 | 13F | Bank Of America Corp /de/ | 488 | -99.99 | 10 | -99.99 | ||||
| 2025-05-08 | 13F | SlateStone Wealth, LLC | 0 | -100.00 | 0 | |||||
| 2025-07-31 | 13F | Opes Wealth Management LLC | 161,225 | -5.16 | 3,154 | -0.69 | ||||
| 2025-05-16 | 13F | Coppell Advisory Solutions LLC | 0 | -100.00 | 0 | |||||
| 2025-07-24 | 13F | Blair William & Co/il | 3,490 | -14.65 | 68 | -10.53 | ||||
| 2025-07-16 | 13F | Magnus Financial Group LLC | 19,657 | 0.07 | 384 | 4.92 | ||||
| 2025-08-08 | 13F | Islay Capital Management, Llc | 2,400 | 0.00 | 47 | 4.55 | ||||
| 2025-05-14 | 13F | Jane Street Group, Llc | 0 | -100.00 | 0 | |||||
| 2025-08-08 | 13F | Larson Financial Group LLC | 1,293 | 0.94 | 25 | 8.70 | ||||
| 2025-08-01 | 13F | Envestnet Asset Management Inc | 0 | -100.00 | 0 | |||||
| 2025-05-20 | 13F | Belpointe Asset Management LLC | 0 | -100.00 | 0 | |||||
| 2025-08-14 | 13F | UBS Group AG | 30,388 | 594 | ||||||
| 2025-05-15 | 13F | Two Sigma Securities, Llc | 0 | -100.00 | 0 | |||||
| 2025-05-13 | 13F | CacheTech Inc. | 504,723 | -6.70 | 9,428 | -1.76 | ||||
| 2025-08-01 | 13F | Boyd Watterson Asset Management Llc/oh | 919 | 18 | ||||||
| 2025-08-13 | 13F | Bare Financial Services, Inc | 0 | -100.00 | 0 | |||||
| 2025-05-13 | 13F | Adams Wealth Management | 504,723 | -6.70 | 9,428 | -1.76 | ||||
| 2025-08-14 | 13F | Citadel Advisors Llc | Call | 25,400 | 202.38 | 497 | 217.95 | |||
| 2025-04-14 | 13F | LexAurum Advisors, LLC | 0 | -100.00 | 0 | -100.00 | ||||
| 2025-08-14 | 13F | Citadel Advisors Llc | 52,179 | 21.12 | 1,021 | 26.87 | ||||
| 2025-07-24 | 13F | Us Bancorp \de\ | 60,912 | 23.85 | 1,191 | 29.74 | ||||
| 2025-07-25 | 13F | Prostatis Group LLC | 12,637 | 247 | ||||||
| 2025-08-14 | 13F | Stifel Financial Corp | 30,497 | -62.58 | 597 | -60.84 | ||||
| 2025-07-15 | 13F | Fifth Third Bancorp | 23,495 | -6.00 | 460 | -1.50 | ||||
| 2025-08-04 | 13F | Atria Investments Llc | 0 | -100.00 | 0 | |||||
| 2025-07-21 | 13F | Ameriflex Group, Inc. | 0 | -100.00 | 0 | |||||
| 2025-05-16 | 13F | Jones Financial Companies Lllp | 0 | -100.00 | 0 | |||||
| 2025-07-16 | 13F | Highline Wealth Partners Llc | 422 | 0.96 | 8 | 14.29 | ||||
| 2025-08-05 | 13F | Bank Of Montreal /can/ | 200 | 0.00 | 4 | 0.00 | ||||
| 2025-08-15 | 13F | Captrust Financial Advisors | 43,122 | -0.83 | 843 | 3.82 | ||||
| 2025-09-04 | 13F/A | Advisor Group Holdings, Inc. | 124,488 | -4.98 | 2,435 | -0.49 | ||||
| 2025-08-14 | 13F | Ancora Advisors, LLC | 0 | -100.00 | 0 | |||||
| 2025-08-12 | 13F | LPL Financial LLC | 131,924 | -4.71 | 2,580 | -0.23 | ||||
| 2025-08-14 | 13F | Citadel Advisors Llc | Put | 25,800 | 24.64 | 505 | 30.57 | |||
| 2025-08-14 | 13F | Bnp Paribas Arbitrage, Sa | 0 | -100.00 | 0 | |||||
| 2025-08-13 | 13F | BCJ Capital Management, LLC | 0 | -100.00 | 0 | |||||
| 2025-05-13 | 13F | ASB Consultores, LLC | 0 | -100.00 | 0 | |||||
| 2025-07-16 | 13F | West Branch Capital LLC | 500 | 0.00 | 10 | 0.00 | ||||
| 2025-07-28 | 13F | Kiker Wealth Management, LLC | 52 | 0.00 | 1 | |||||
| 2025-08-14 | 13F | Wells Fargo & Company/mn | 409,251 | 141.08 | 8,005 | 152.41 | ||||
| 2025-04-21 | 13F | United Advisor Group, LLC | 0 | -100.00 | 0 | |||||
| 2025-08-12 | 13F | Proequities, Inc. | 0 | 0 | ||||||
| 2025-07-14 | 13F | Painted Porch Advisors LLC | 540 | 0.00 | 11 | 0.00 | ||||
| 2025-07-21 | 13F | Credential Qtrade Securities Inc. | 0 | -100.00 | 0 | -100.00 | ||||
| 2025-05-06 | 13F | Cetera Investment Advisers | 0 | -100.00 | 0 | |||||
| 2025-07-08 | 13F | Lowe Wealth Advisors, LLC | 6,500 | -2.99 | 127 | 1.60 | ||||
| 2025-07-25 | 13F | Griffin Asset Management, Inc. | 0 | -100.00 | 0 | |||||
| 2025-07-30 | 13F | Bleakley Financial Group, LLC | 126,733 | 59.98 | 2,479 | 67.55 | ||||
| 2025-08-06 | 13F | Golden State Wealth Management, LLC | 1,549 | 0.00 | 30 | 7.14 | ||||
| 2025-07-28 | 13F | Harbour Investments, Inc. | 315 | 0.00 | 6 | 20.00 | ||||
| 2025-07-08 | 13F | Ehrlich Financial Group | 0 | -100.00 | 0 | |||||
| 2025-08-08 | 13F | Fortis Group Advisors, LLC | 103,233 | 230.47 | 1,982 | 239.97 | ||||
| 2025-08-12 | 13F | SRS Capital Advisors, Inc. | 10 | 0.00 | 0 | |||||
| 2025-05-21 | 13F/A | Geneos Wealth Management Inc. | 1,384 | 26 | ||||||
| 2025-07-29 | 13F | Straight Path Wealth Management | 13,439 | -10.12 | 263 | -6.09 | ||||
| 2025-07-25 | 13F | Concurrent Investment Advisors, LLC | 0 | -100.00 | 0 | |||||
| 2025-07-23 | 13F | Venturi Wealth Management, LLC | 0 | -100.00 | 0 | |||||
| 2025-08-14 | 13F | DecisionPoint Financial, LLC | 65 | 1 | ||||||
| 2025-07-25 | 13F | Cwm, Llc | 7,033 | 54.81 | 0 | |||||
| 2025-05-14 | 13F | Flow Traders U.s. Llc | 0 | -100.00 | 0 | |||||
| 2025-08-05 | 13F | Simplex Trading, Llc | 250 | 165.96 | 0 | |||||
| 2025-04-21 | 13F | Nelson, Van Denburg & Campbell Wealth Management Group, LLC | 0 | -100.00 | 0 | |||||
| 2025-07-07 | 13F | Investors Research Corp | 642 | 0.00 | 13 | 9.09 | ||||
| 2025-07-10 | 13F | Tompkins Financial Corp | 1,130 | 0.00 | 22 | 4.76 | ||||
| 2025-07-17 | 13F | Beacon Capital Management, LLC | 356 | 0.85 | 7 | 0.00 | ||||
| 2025-08-14 | 13F | Susquehanna International Group, Llp | 43,297 | 847 | ||||||
| 2025-07-16 | 13F | Signaturefd, Llc | 0 | -100.00 | 0 | |||||
| 2025-07-31 | 13F | Brinker Capital Investments, LLC | 0 | -100.00 | 0 | -100.00 | ||||
| 2025-07-17 | 13F | Sound Income Strategies, LLC | 80 | 2 | ||||||
| 2025-07-10 | 13F | Wealth Enhancement Advisory Services, Llc | 748,854 | -1.41 | 14,468 | 1.97 | ||||
| 2025-08-14 | 13F | GWM Advisors LLC | 18,991 | 4.65 | 371 | 9.44 | ||||
| 2025-05-01 | 13F | WESPAC Advisors, LLC | 0 | -100.00 | 0 | |||||
| 2025-08-14 | 13F | BCS Private Wealth Management, Inc. | 183,062 | 4 | ||||||
| 2025-05-15 | 13F | Tower Research Capital LLC (TRC) | 0 | -100.00 | 0 | |||||
| 2025-08-12 | 13F | Jpmorgan Chase & Co | 117 | 588.24 | 2 | |||||
| 2025-04-29 | 13F | U.S. Capital Wealth Advisors, LLC | 0 | -100.00 | 0 | |||||
| 2025-08-08 | 13F | Capital Investment Advisory Services, LLC | 3,245 | 0.00 | 63 | 5.00 | ||||
| 2025-07-11 | 13F | Caldwell Securities, Inc | 0 | -100.00 | 0 | |||||
| 2025-08-15 | 13F | Morgan Stanley | 355,688 | 119.91 | 6,957 | 130.29 | ||||
| 2025-08-11 | 13F | TD Waterhouse Canada Inc. | 2,450 | 0.00 | 47 | 4.44 | ||||
| 2025-07-08 | 13F | Nbc Securities, Inc. | 0 | -100.00 | 0 | |||||
| 2025-08-14 | 13F | Qube Research & Technologies Ltd | 153 | 3 | ||||||
| 2025-07-31 | 13F | Cambridge Investment Research Advisors, Inc. | 0 | -100.00 | 0 | |||||
| 2025-08-14 | 13F | Ambassador Advisors, LLC | 689,405 | 2.26 | 13,485 | 7.08 | ||||
| 2025-07-15 | 13F | MCF Advisors LLC | 7,070 | -0.81 | 138 | 3.76 | ||||
| 2025-05-16 | 13F | Laidlaw Wealth Management LLC | 0 | -100.00 | 0 | -100.00 | ||||
| 2025-08-12 | 13F | Global Retirement Partners, LLC | 2,012 | 39 | ||||||
| 2025-07-28 | 13F | Copia Wealth Management | 1,033 | -12.09 | 20 | -4.76 | ||||
| 2025-07-16 | 13F | One + One Wealth Management, Llc | 46,123 | 3.59 | 902 | 8.54 | ||||
| 2025-08-11 | 13F | HighTower Advisors, LLC | 140,474 | -46.25 | 2,748 | -43.72 | ||||
| 2025-08-14 | 13F | Aqr Capital Management Llc | 10,888 | 213 | ||||||
| 2025-05-14 | 13F | Oarsman Capital, Inc. | 0 | -100.00 | 0 | |||||
| 2025-08-05 | 13F | Bank of New York Mellon Corp | 0 | -100.00 | 0 | |||||
| 2025-07-24 | 13F | Trust Co Of Toledo Na /oh/ | 123 | 2 | ||||||
| 2025-07-30 | 13F | Crewe Advisors LLC | 0 | -100.00 | 0 | |||||
| 2025-08-14 | 13F | Old Mission Capital Llc | 35,218 | 689 | ||||||
| 2025-08-06 | 13F | Pekin Hardy Strauss, Inc. | 182,857 | 6.95 | 3,577 | 11.99 | ||||
| 2025-08-14 | 13F | Comerica Bank | 10,112 | -28.53 | 198 | -25.38 | ||||
| 2025-05-15 | 13F | Centaurus Financial, Inc. | 0 | -100.00 | 0 | |||||
| 2025-07-16 | 13F | Patron Partners Advisors, Llc | 0 | -100.00 | 0 |