Mga Batayang Estadistika
| Pemilik Institusional | 154 total, 154 long only, 0 short only, 0 long/short - change of 2.65% MRQ |
| Alokasi Portofolio Rata-rata | 0.1565 % - change of -2.86% MRQ |
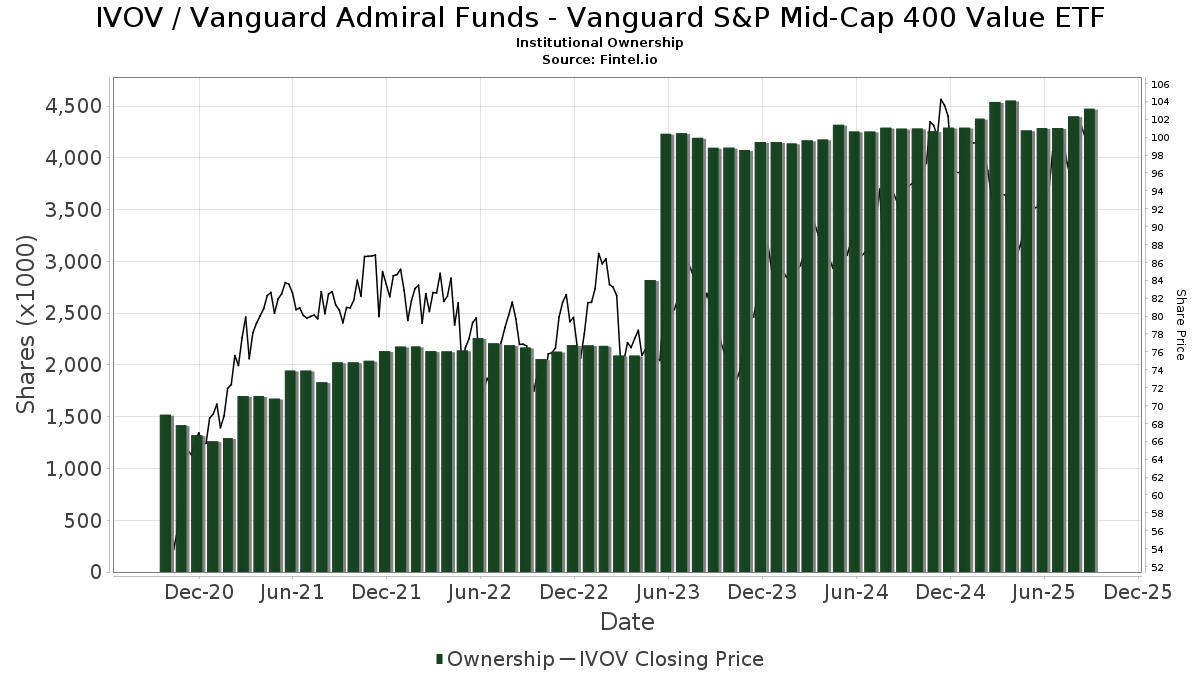
| Saham Institusional (Jangka Panjang) | 4,471,561 (ex 13D/G) - change of 0.18MM shares 4.26% MRQ |
| Nilai Institusional (Jangka Panjang) | $ 417,618 USD ($1000) |
Kepemilikan Institusional dan Pemegang Saham
Vanguard Admiral Funds - Vanguard S&P Mid-Cap 400 Value ETF (US:IVOV) memiliki 154 pemilik institusional dan pemegang saham yang telah mengajukan formulir 13D/G atau 13F kepada Komisi Bursa Efek (Securities Exchange Commission/SEC). Lembaga-lembaga ini memegang total 4,471,561 saham. Pemegang saham terbesar meliputi Mariner, LLC, Rockland Trust Co, Morgan Stanley, Bank Of America Corp /de/, Raymond James Financial Inc, Octavia Wealth Advisors, LLC, Stordahl Capital Management, Inc., LPL Financial LLC, Nelson, Van Denburg & Campbell Wealth Management Group, LLC, and Lutz Financial Services LLC .
Struktur kepemilikan institusional Vanguard Admiral Funds - Vanguard S&P Mid-Cap 400 Value ETF (ARCA:IVOV) menunjukkan posisi terkini di perusahaan oleh institusi dan dana, serta perubahan terbaru dalam ukuran posisi. Pemegang saham utama dapat mencakup investor individu, reksa dana, dana lindung nilai, atau institusi. Jadwal 13D menunjukkan bahwa investor memegang (atau pernah memegang) lebih dari 5% saham perusahaan dan bermaksud (atau pernah bermaksud) untuk secara aktif mengejar perubahan strategi bisnis. Jadwal 13G menunjukkan investasi pasif lebih dari 5%.
The share price as of September 5, 2025 is 101.93 / share. Previously, on September 9, 2024, the share price was 90.85 / share. This represents an increase of 12.20% over that period.
Skor Sentimen Dana
Skor Sentimen Dana (sebelumnya dikenal sebagai Skor Akumulasi Kepemilikan) menemukan saham-saham yang paling banyak dibeli oleh dana. Ini adalah hasil dari model kuantitatif multi-faktor yang canggih yang mengidentifikasi perusahaan dengan tingkat akumulasi institusional tertinggi. Model penilaian menggunakan kombinasi dari total peningkatan pemilik yang diungkapkan, perubahan dalam alokasi portofolio pada pemilik tersebut, dan metrik lainnya. Angka berkisar dari 0 hingga 100, dengan angka yang lebih tinggi menunjukkan tingkat akumulasi yang lebih tinggi dibandingkan dengan perusahaan sejenisnya, dan 50 adalah rata-ratanya.
Frekuensi Pembaruan: Setiap Hari
Lihat Ownership Explorer, yang menyediakan daftar perusahaan dengan peringkat tertinggi.
Rasio Put/Call Institusional
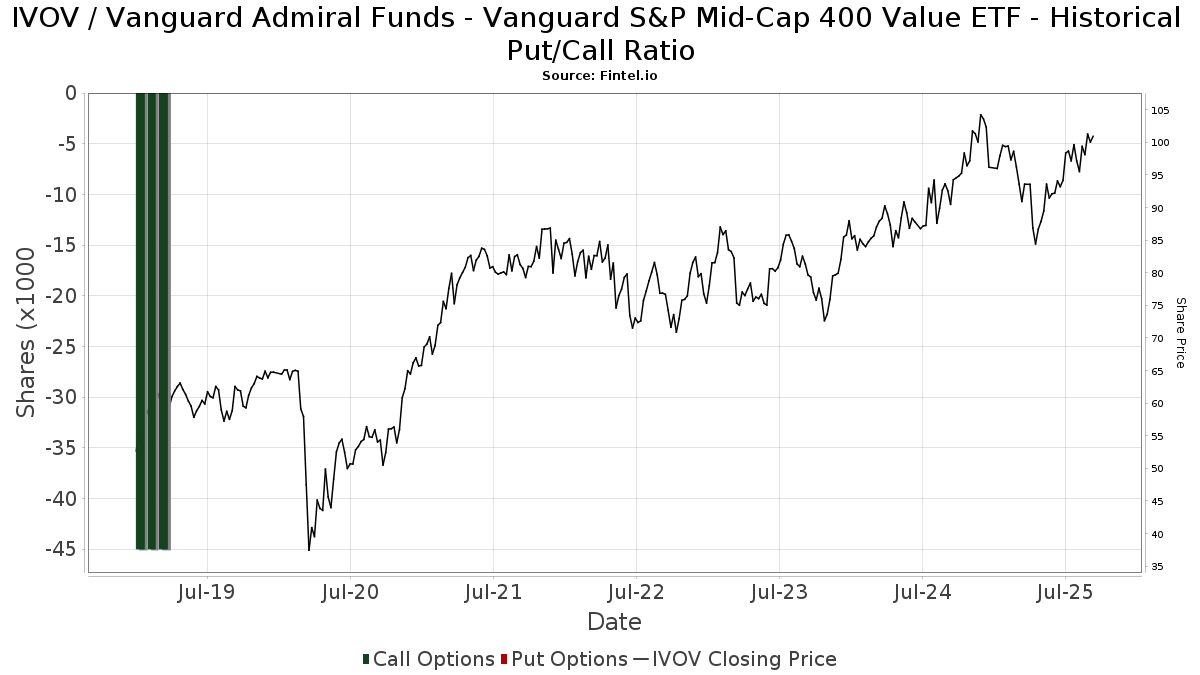
Selain melaporkan isu ekuitas dan utang standar, institusi dengan aset di bawah manajemen lebih dari 100 juta dolar AS juga harus mengungkapkan kepemilikan opsi put dan call mereka. Karena opsi put umumnya menunjukkan sentimen negatif, dan opsi call menunjukkan sentimen positif, kita dapat mengetahui sentimen institusional secara keseluruhan dengan memplot rasio put terhadap call. Grafik di sebelah kanan memplot rasio put/call historis untuk instrumen ini.
Menggunakan Rasio Put/Call sebagai indikator sentimen investor mengatasi salah satu kekurangan utama dari penggunaan total kepemilikan institusional, yaitu sejumlah besar aset yang dikelola diinvestasikan secara pasif untuk melacak indeks. Dana yang dikelola secara pasif biasanya tidak membeli opsi, sehingga indikator rasio put/call lebih akurat dalam melacak sentimen dana yang dikelola secara aktif.
Pengajuan 13F dan NPORT
Detail pada pengajuan 13F tersedia gratis. Detail pada pengajuan NP memerlukan keanggotaan premium. Baris berwarna hijau menunjukkan posisi baru. Baris berwarna merah menunjukkan posisi yang sudah ditutup. Klik tautan ini ikon untuk melihat riwayat transaksi selengkapnya.
Tingkatkan
untuk membuka data premium dan mengekspor ke Excel ![]() .
.
| Tanggal File | Sumber | Investor | Ketik | Presyo ng Avg (Silangan) |
Saham | Δ Saham (%) |
Dilaporkan Nilai ($1000) |
Nilai Δ (%) |
Alokasi Port (%) |
|
|---|---|---|---|---|---|---|---|---|---|---|
| 2025-08-11 | 13F | Aptus Capital Advisors, LLC | 593 | 0.00 | 57 | 3.70 | ||||
| 2025-07-28 | 13F | Harbour Investments, Inc. | 4,380 | -0.70 | 418 | 2.96 | ||||
| 2025-08-15 | 13F | Morgan Stanley | 296,014 | 16.21 | 28,261 | 20.54 | ||||
| 2025-07-29 | 13F | Private Trust Co Na | 450 | 0.00 | 43 | 2.44 | ||||
| 2025-08-15 | 13F | CI Private Wealth, LLC | 5,656 | 70.62 | 540 | 76.72 | ||||
| 2025-08-13 | 13F | Level Four Advisory Services, Llc | 4,616 | 0.00 | 441 | 3.77 | ||||
| 2025-07-28 | 13F | IFG Advisors, LLC | 2,770 | 0.00 | 264 | 3.94 | ||||
| 2025-08-19 | 13F | Cape Investment Advisory, Inc. | 226 | 0.00 | 22 | 5.00 | ||||
| 2025-08-12 | 13F | Global Retirement Partners, LLC | 888 | 0.00 | 85 | 0.00 | ||||
| 2025-07-15 | 13F | Mather Group, Llc. | 0 | -100.00 | 0 | |||||
| 2025-07-15 | 13F | Fifth Third Bancorp | 392 | 0.00 | 37 | 2.78 | ||||
| 2025-08-12 | 13F | MAI Capital Management | 1,201 | 0.00 | 115 | 3.64 | ||||
| 2025-08-08 | 13F | Cetera Investment Advisers | 12,901 | -40.08 | 1,232 | -37.86 | ||||
| 2025-08-01 | 13F | American Financial & Tax Strategies Inc | 13,491 | 0.16 | 1,288 | 3.87 | ||||
| 2025-08-11 | 13F | Goodman Financial Corp | 5,639 | 538 | ||||||
| 2025-05-12 | 13F | Independent Advisor Alliance | 0 | -100.00 | 0 | |||||
| 2025-08-12 | 13F | J.w. Cole Advisors, Inc. | 2,312 | 221 | ||||||
| 2025-07-25 | 13F | Cwm, Llc | 438 | 0.00 | 0 | |||||
| 2025-07-28 | 13F | Naviter Wealth, LLC | 6,851 | 0.00 | 654 | 4.14 | ||||
| 2025-07-10 | 13F | Redhawk Wealth Advisors, Inc. | 5,369 | -1.97 | 513 | 1.59 | ||||
| 2025-07-31 | 13F | Glass Jacobson Investment Advisors llc | 387 | 1.57 | 37 | 0.00 | ||||
| 2025-08-11 | 13F | Mosaic Family Wealth Partners, Llc | 5,554 | 0.00 | 530 | 3.72 | ||||
| 2025-08-15 | 13F | Tower Research Capital LLC (TRC) | 6,015 | 57.79 | 574 | 64.00 | ||||
| 2025-08-13 | 13F | Jones Financial Companies Lllp | 2,488 | -7.34 | 238 | -3.66 | ||||
| 2025-07-22 | 13F | Evensky & Katz LLC | 931 | 0 | ||||||
| 2025-08-11 | 13F | Shufro Rose & Co Llc | 9,210 | 0.00 | 848 | 0.00 | ||||
| 2025-08-11 | 13F | Factorial Partners, Llc | 5,200 | -25.71 | 496 | -22.98 | ||||
| 2025-09-04 | 13F/A | Advisor Group Holdings, Inc. | 9,432 | -8.47 | 901 | -5.06 | ||||
| 2025-07-25 | 13F | NorthRock Partners, LLC | 104 | 0.00 | 10 | 0.00 | ||||
| 2025-08-08 | 13F | Pnc Financial Services Group, Inc. | 2,136 | 0.00 | 204 | 3.57 | ||||
| 2025-08-14 | 13F | Stifel Financial Corp | 6,825 | 0.74 | 652 | 4.49 | ||||
| 2025-07-22 | 13F | Miracle Mile Advisors, LLC | 21,466 | -1.21 | 2,049 | 2.50 | ||||
| 2025-08-14 | 13F | Glenview Trust Co | 3,409 | -6.83 | 325 | -3.27 | ||||
| 2025-07-29 | 13F | Ifrah Financial Services, Inc. | 4,317 | -1.24 | 412 | 2.49 | ||||
| 2025-05-12 | 13F | Sandy Spring Bank | 0 | -100.00 | 0 | |||||
| 2025-07-09 | 13F | Summit Financial Consulting LLC | 3,077 | -1.16 | 294 | 2.45 | ||||
| 2025-08-12 | 13F | Accredited Wealth Management, LLC | 10 | -50.00 | 1 | -100.00 | ||||
| 2025-07-29 | 13F | Spectrum Investment Advisors, Inc. | 10,101 | 10.24 | 964 | 14.35 | ||||
| 2025-08-12 | 13F | Hanover Advisors Inc | 5,228 | -0.10 | 499 | 3.74 | ||||
| 2025-07-17 | 13F | Fifth Third Securities, Inc. | 3,922 | 18.28 | 374 | 22.62 | ||||
| 2025-08-06 | 13F | Horizon Investment Services, LLC | 11,456 | -4.48 | 1,094 | -0.91 | ||||
| 2025-08-14 | 13F | Wiley Bros.-aintree Capital, Llc | 35,729 | 2.68 | 3,411 | 6.89 | ||||
| 2025-07-21 | 13F | Ameritas Advisory Services, LLC | 1,919 | 183 | ||||||
| 2025-08-14 | 13F | IHT Wealth Management, LLC | 3,080 | 0.00 | 294 | 3.89 | ||||
| 2025-08-12 | 13F | Manchester Capital Management LLC | 1,000 | -60.00 | 95 | -58.70 | ||||
| 2025-08-13 | 13F | Rsm Us Wealth Management Llc | 0 | -100.00 | 0 | |||||
| 2025-08-12 | 13F | O'shaughnessy Asset Management, Llc | 435 | -20.91 | 42 | -18.00 | ||||
| 2025-08-01 | 13F | SYM FINANCIAL Corp | 178 | 17 | ||||||
| 2025-08-07 | 13F | BHK Investment Advisors, LLC | 4,400 | 0.00 | 420 | 3.96 | ||||
| 2025-08-14 | 13F | Atomi Financial Group, Inc. | 2,228 | -5.59 | 213 | -2.30 | ||||
| 2025-08-18 | 13F | Geneos Wealth Management Inc. | 448 | 100.00 | 43 | 110.00 | ||||
| 2025-08-08 | 13F | SBI Securities Co., Ltd. | 13 | -35.00 | 1 | 0.00 | ||||
| 2025-08-08 | 13F | Larson Financial Group LLC | 976 | 0.00 | 93 | 4.49 | ||||
| 2025-08-15 | 13F | Kestra Advisory Services, LLC | 73,517 | 4.26 | 7,019 | 8.14 | ||||
| 2025-07-18 | 13F | Founders Capital Management | 770 | 0.00 | 74 | 4.29 | ||||
| 2025-08-04 | 13F | Hantz Financial Services, Inc. | 0 | -100.00 | 0 | |||||
| 2025-08-12 | 13F | BlackRock, Inc. | 130 | 12 | ||||||
| 2025-08-12 | 13F | Bokf, Na | 120 | 11 | ||||||
| 2025-07-08 | 13F | Atlas Brown,Inc. | 4,691 | 9.07 | 448 | 13.16 | ||||
| 2025-08-14 | 13F | Mariner, LLC | 866,336 | 0.48 | 82,709 | 4.22 | ||||
| 2025-08-13 | 13F | Ofc Financial Planning, Llc | 6,034 | -0.54 | 576 | 3.23 | ||||
| 2025-08-12 | 13F | Archer Investment Corp | 722 | 0.00 | 69 | 3.03 | ||||
| 2025-07-31 | 13F | Oppenheimer & Co Inc | 0 | -100.00 | 0 | |||||
| 2025-08-12 | 13F | Steward Partners Investment Advisory, Llc | 396 | 0.00 | 38 | 2.78 | ||||
| 2025-08-12 | 13F | Jpmorgan Chase & Co | 24,404 | 2.48 | 2,330 | 6.30 | ||||
| 2025-07-17 | 13F | Tritonpoint Wealth, Llc | 0 | -100.00 | 0 | |||||
| 2025-07-30 | 13F | D.a. Davidson & Co. | 7,846 | -0.10 | 749 | 3.74 | ||||
| 2025-08-14 | 13F | Raymond James Financial Inc | 192,201 | -0.90 | 18,349 | 2.79 | ||||
| 2025-07-23 | 13F | Valmark Advisers, Inc. | 3,928 | -3.89 | 375 | -0.27 | ||||
| 2025-08-13 | 13F | Cerity Partners LLC | 2,338 | -0.93 | 223 | 2.76 | ||||
| 2025-08-06 | 13F | Savant Capital, LLC | 41,954 | -1.82 | 4,005 | 1.86 | ||||
| 2025-07-08 | 13F | Parallel Advisors, LLC | 1,466 | 91.38 | 140 | 98.57 | ||||
| 2025-08-14 | 13F | Bank Of America Corp /de/ | 248,317 | -12.52 | 23,707 | -9.27 | ||||
| 2025-07-25 | 13F | Atria Wealth Solutions, Inc. | 0 | -100.00 | 0 | |||||
| 2025-08-12 | 13F | Passive Capital Management, LLC. | 4,026 | 0.00 | 391 | 5.68 | ||||
| 2025-08-14 | 13F | Wells Fargo & Company/mn | 54,334 | -8.87 | 5,187 | -5.47 | ||||
| 2025-07-17 | 13F | Heritage Investment Group, Inc. | 9,572 | 0.00 | 914 | 3.63 | ||||
| 2025-08-14 | 13F | Aqr Capital Management Llc | 2,549 | 243 | ||||||
| 2025-08-07 | 13F | Allworth Financial LP | 37,504 | -1.54 | 3,580 | 6.58 | ||||
| 2025-08-13 | 13F | Flow Traders U.s. Llc | 7,387 | 1 | ||||||
| 2025-08-06 | 13F | Rialto Wealth Management, LLC | 1,325 | 0.00 | 126 | 4.13 | ||||
| 2025-08-08 | 13F | Citizens Financial Group Inc/ri | 3,022 | -1.63 | 288 | 2.13 | ||||
| 2025-07-22 | 13F | Wealthcare Advisory Partners LLC | 2,564 | -0.77 | 245 | 2.95 | ||||
| 2025-08-13 | 13F | Cary Street Partners Financial Llc | 0 | -100.00 | 0 | |||||
| 2025-08-04 | 13F | Keybank National Association/oh | 9,937 | -2.88 | 949 | 0.74 | ||||
| 2025-08-13 | 13F | Northwestern Mutual Wealth Management Co | 90,120 | -30.33 | 8,604 | -27.74 | ||||
| 2025-07-09 | 13F | Bruce G. Allen Investments, LLC | 707 | 0.00 | 68 | 3.08 | ||||
| 2025-08-12 | 13F | Franklin Resources Inc | 28,700 | 0.00 | 2,740 | 3.71 | ||||
| 2025-08-05 | 13F | Sigma Planning Corp | 0 | -100.00 | 0 | |||||
| 2025-08-15 | 13F | Captrust Financial Advisors | 6,725 | -10.17 | 642 | -6.83 | ||||
| 2025-07-10 | 13F | Wealth Enhancement Advisory Services, Llc | 35,779 | 44.57 | 3,534 | 55.20 | ||||
| 2025-07-14 | 13F | Painted Porch Advisors LLC | 62 | 0.00 | 6 | 0.00 | ||||
| 2025-07-18 | 13F | Truist Financial Corp | 43,911 | 1.64 | 4,192 | 5.43 | ||||
| 2025-07-29 | 13F | Stordahl Capital Management, Inc. | 168,972 | 0.31 | 16,132 | 4.04 | ||||
| 2025-08-11 | 13F | Private Advisor Group, LLC | 16,647 | -9.66 | 1,589 | -6.31 | ||||
| 2025-08-14 | 13F | Royal Bank Of Canada | 5,687 | -0.21 | 543 | 3.43 | ||||
| 2025-07-24 | 13F | Eastern Bank | 845 | -15.92 | 81 | -13.04 | ||||
| 2025-08-04 | 13F | Assetmark, Inc | 10 | -96.62 | 1 | -100.00 | ||||
| 2025-07-29 | 13F | Lutz Financial Services LLC | 119,380 | 0.83 | 11,397 | 4.59 | ||||
| 2025-08-08 | 13F | Meridian Wealth Management, LLC | 4,521 | 1.25 | 432 | 4.87 | ||||
| 2025-07-31 | 13F | Cambridge Investment Research Advisors, Inc. | 3,150 | -3.90 | 0 | |||||
| 2025-08-12 | 13F | Virtu Financial LLC | 6,003 | -39.46 | 1 | |||||
| 2025-07-09 | 13F | Christopher J. Hasenberg, Inc | 86 | -94.00 | 8 | -93.94 | ||||
| 2025-08-05 | 13F | Plante Moran Financial Advisors, LLC | 120 | 11 | ||||||
| 2025-07-16 | 13F | Signaturefd, Llc | 14 | 0.00 | 1 | 0.00 | ||||
| 2025-08-14 | 13F | Moneta Group Investment Advisors Llc | 5,732 | -52.58 | 547 | -50.81 | ||||
| 2025-08-19 | 13F | Anchor Investment Management, LLC | 138 | 0.00 | 13 | 8.33 | ||||
| 2025-08-11 | 13F | Insight 2811, Inc. | 2,733 | 19.08 | 261 | 23.22 | ||||
| 2025-08-14 | 13F | CIBC World Markets Inc. | 5,594 | 0.00 | 534 | 3.89 | ||||
| 2025-08-01 | 13F | Envestnet Asset Management Inc | 24,367 | 36.59 | 2,326 | 41.66 | ||||
| 2025-08-13 | 13F | Wealthquest Corp | 3,530 | 0.00 | 337 | 4.01 | ||||
| 2025-05-14 | 13F | Synovus Financial Corp | 0 | -100.00 | 0 | -100.00 | ||||
| 2025-07-11 | 13F | Pinnacle Bancorp, Inc. | 578 | 0.00 | 55 | 3.77 | ||||
| 2025-08-11 | 13F | Western Wealth Management, LLC | 2,437 | -5.58 | 233 | -2.11 | ||||
| 2025-08-12 | 13F | Proequities, Inc. | 0 | 0 | ||||||
| 2025-07-10 | 13F | Rockland Trust Co | 812,321 | 1.46 | 77,552 | 5.24 | ||||
| 2025-07-28 | 13F | Mutual Advisors, LLC | 5,039 | 120.91 | 498 | 148.50 | ||||
| 2025-07-31 | 13F | Hobart Private Capital, LLC | 3,756 | 0.00 | 359 | 3.77 | ||||
| 2025-08-26 | 13F/A | Thrivent Financial For Lutherans | 18,629 | 2 | ||||||
| 2025-07-21 | 13F | Ameriflex Group, Inc. | 383 | 0.00 | 36 | 2.86 | ||||
| 2025-04-16 | 13F | CVA Family Office, LLC | 0 | -100.00 | 0 | |||||
| 2025-08-19 | 13F | Newbridge Financial Services Group, Inc. | 444 | 0.00 | 42 | 5.00 | ||||
| 2025-08-08 | 13F | Creative Planning | 9,989 | 0.10 | 954 | 3.81 | ||||
| 2025-07-10 | 13F | Sovran Advisors, LLC | 5,698 | 16.88 | 560 | 34.70 | ||||
| 2025-08-14 | 13F | Citadel Advisors Llc | 2,690 | -68.82 | 257 | -67.72 | ||||
| 2025-08-15 | 13F | WealthCollab, LLC | 2,808 | 0.00 | 268 | 3.88 | ||||
| 2025-07-22 | 13F | Merit Financial Group, LLC | 7,082 | -2.85 | 676 | 0.90 | ||||
| 2025-07-16 | 13F | Octavia Wealth Advisors, LLC | 169,788 | -9.06 | 16,210 | -5.67 | ||||
| 2025-08-06 | 13F | Commonwealth Equity Services, Llc | 51,568 | -5.22 | 5 | -20.00 | ||||
| 2025-07-17 | 13F | Hanson & Doremus Investment Management | 1,504 | 0.00 | 0 | |||||
| 2025-08-13 | 13F | Lido Advisors, LLC | 2,386 | 0.00 | 228 | 3.65 | ||||
| 2025-07-14 | 13F | U.S. Capital Wealth Advisors, LLC | 2,980 | 0.00 | 285 | 3.65 | ||||
| 2025-08-14 | 13F | Ameriprise Financial Inc | 11,320 | -8.33 | 1,081 | -4.93 | ||||
| 2025-08-04 | 13F | AMG National Trust Bank | 3,480 | 0.00 | 332 | 3.75 | ||||
| 2025-07-29 | 13F | Rodgers & Associates, LTD | 5,266 | 16.87 | 503 | 21.26 | ||||
| 2025-07-30 | 13F | Silver Oak Wealth Advisors Services, Llc | 2,255 | 0.00 | 215 | 3.86 | ||||
| 2025-05-02 | 13F | Kingsview Wealth Management, LLC | 0 | -100.00 | 0 | |||||
| 2025-07-18 | 13F | Bartlett & Co. Wealth Management Llc | 268 | 0.00 | 26 | 4.17 | ||||
| 2025-08-14 | 13F | Smartleaf Asset Management LLC | 0 | -100.00 | 0 | |||||
| 2025-07-29 | 13F | Salomon & Ludwin, LLC | 1,150 | 0.00 | 113 | 7.62 | ||||
| 2025-07-18 | 13F | SOA Wealth Advisors, LLC. | 8 | 0.00 | 1 | |||||
| 2025-05-12 | 13F | Cooper Financial Group | 0 | -100.00 | 0 | -100.00 | ||||
| 2025-08-06 | 13F | Texas Yale Capital Corp. | 2,200 | 0.00 | 210 | 3.96 | ||||
| 2025-08-14 | 13F | UBS Group AG | 107,148 | 3.79 | 10,229 | 7.65 | ||||
| 2025-08-12 | 13F | Howe & Rusling Inc | 1,141 | 0.00 | 109 | 2.86 | ||||
| 2025-07-17 | 13F | Nelson, Van Denburg & Campbell Wealth Management Group, LLC | 124,877 | 615.50 | 11,922 | 642.28 | ||||
| 2025-08-05 | 13F | Huntington National Bank | 958 | 3.79 | ||||||
| 2025-08-11 | 13F | WPG Advisers, LLC | 325 | 0.00 | 31 | 6.90 | ||||
| 2025-08-04 | 13F | Spire Wealth Management | 3,118 | -34.62 | 298 | -32.19 | ||||
| 2025-07-30 | 13F | Phillips Financial Management, Llc | 2,862 | 0.00 | 273 | 3.80 | ||||
| 2025-07-24 | 13F | Blair William & Co/il | 2,273 | 0.00 | 217 | 3.83 | ||||
| 2025-08-11 | 13F | Heritage Wealth Advisors | 1,975 | 189 | ||||||
| 2025-07-16 | 13F | Crowley Wealth Management, Inc. | 600 | 0.00 | 57 | 3.64 | ||||
| 2025-08-11 | 13F | VSM Wealth Advisory, LLC | 600 | 0.00 | 57 | 3.64 | ||||
| 2025-08-13 | 13F | StoneX Group Inc. | 3,233 | 18.04 | 309 | 22.22 | ||||
| 2025-08-14 | 13F | Jane Street Group, Llc | 7,264 | 169.04 | 693 | 179.44 | ||||
| 2025-08-14 | 13F | Mml Investors Services, Llc | 8,288 | 2.83 | 1 | |||||
| 2025-08-14 | 13F | EP Wealth Advisors, Inc. | 29,600 | 0.00 | 2,826 | 3.71 | ||||
| 2025-08-14 | 13F | Aberdeen Wealth Management LLC | 118,977 | -1.64 | 11,359 | 2.02 | ||||
| 2025-08-14 | 13F | Federation des caisses Desjardins du Quebec | 328 | 0.00 | 31 | 3.33 | ||||
| 2025-08-19 | 13F | Asset Dedication, LLC | 731 | 0.14 | 70 | 2.99 | ||||
| 2025-08-11 | 13F | HighTower Advisors, LLC | 57,366 | 1,572.48 | 5,477 | 1,638.41 | ||||
| 2025-08-04 | 13F | Creative Financial Designs Inc /adv | 208 | 0.00 | 20 | 0.00 | ||||
| 2025-08-13 | 13F | Keystone Financial Group | 2,490 | 0.00 | 238 | 3.49 | ||||
| 2025-08-14 | 13F | Comerica Bank | 11,271 | 109.34 | 1,076 | 117.37 | ||||
| 2025-08-14 | 13F | Susquehanna International Group, Llp | 15,740 | 1,503 | ||||||
| 2025-07-24 | 13F | Us Bancorp \de\ | 0 | -100.00 | 0 | |||||
| 2025-08-12 | 13F | LPL Financial LLC | 131,347 | 31.58 | 12,540 | 36.49 | ||||
| 2025-08-07 | 13F | PFG Advisors | 0 | -100.00 | 0 | |||||
| 2025-08-05 | 13F | Trail Ridge Investment Advisors, LLC | 4,628 | 27.35 | 446 | 33.23 | ||||
| 2025-08-11 | 13F | Teachers Insurance & Annuity Association Of America | 791 | 0.00 | 76 | 4.17 | ||||
| 2025-08-13 | 13F | Russell Investments Group, Ltd. | 100 | 0.00 | 10 | 0.00 | ||||
| 2025-08-14 | 13F | Fmr Llc | 1,469 | 3.38 | 140 | 7.69 |