Mga Batayang Estadistika
| Pemilik Institusional | 126 total, 126 long only, 0 short only, 0 long/short - change of 1.61% MRQ |
| Alokasi Portofolio Rata-rata | 0.2266 % - change of 13.25% MRQ |
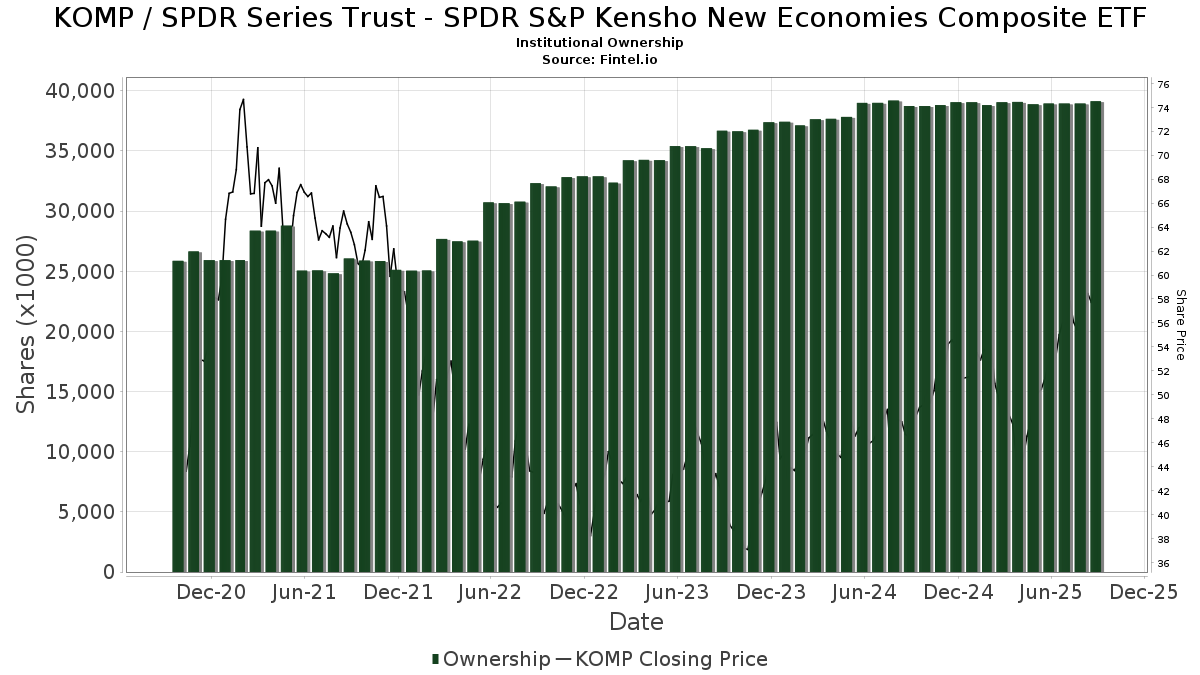
| Saham Institusional (Jangka Panjang) | 39,133,611 (ex 13D/G) - change of 0.19MM shares 0.49% MRQ |
| Nilai Institusional (Jangka Panjang) | $ 2,037,141 USD ($1000) |
Kepemilikan Institusional dan Pemegang Saham
SPDR Series Trust - SPDR S&P Kensho New Economies Composite ETF (US:KOMP) memiliki 126 pemilik institusional dan pemegang saham yang telah mengajukan formulir 13D/G atau 13F kepada Komisi Bursa Efek (Securities Exchange Commission/SEC). Lembaga-lembaga ini memegang total 39,133,611 saham. Pemegang saham terbesar meliputi Financial Engines Advisors L.L.C., Betterment LLC, Strategic Advocates LLC, Morgan Stanley, Mariner, LLC, Royal Bank Of Canada, LPL Financial LLC, Christopher J. Hasenberg, Inc, Baird Financial Group, Inc., and Towerpoint Wealth, LLC .
Struktur kepemilikan institusional SPDR Series Trust - SPDR S&P Kensho New Economies Composite ETF (ARCA:KOMP) menunjukkan posisi terkini di perusahaan oleh institusi dan dana, serta perubahan terbaru dalam ukuran posisi. Pemegang saham utama dapat mencakup investor individu, reksa dana, dana lindung nilai, atau institusi. Jadwal 13D menunjukkan bahwa investor memegang (atau pernah memegang) lebih dari 5% saham perusahaan dan bermaksud (atau pernah bermaksud) untuk secara aktif mengejar perubahan strategi bisnis. Jadwal 13G menunjukkan investasi pasif lebih dari 5%.
The share price as of September 4, 2025 is 57.99 / share. Previously, on September 5, 2024, the share price was 46.47 / share. This represents an increase of 24.79% over that period.
Skor Sentimen Dana
Skor Sentimen Dana (sebelumnya dikenal sebagai Skor Akumulasi Kepemilikan) menemukan saham-saham yang paling banyak dibeli oleh dana. Ini adalah hasil dari model kuantitatif multi-faktor yang canggih yang mengidentifikasi perusahaan dengan tingkat akumulasi institusional tertinggi. Model penilaian menggunakan kombinasi dari total peningkatan pemilik yang diungkapkan, perubahan dalam alokasi portofolio pada pemilik tersebut, dan metrik lainnya. Angka berkisar dari 0 hingga 100, dengan angka yang lebih tinggi menunjukkan tingkat akumulasi yang lebih tinggi dibandingkan dengan perusahaan sejenisnya, dan 50 adalah rata-ratanya.
Frekuensi Pembaruan: Setiap Hari
Lihat Ownership Explorer, yang menyediakan daftar perusahaan dengan peringkat tertinggi.
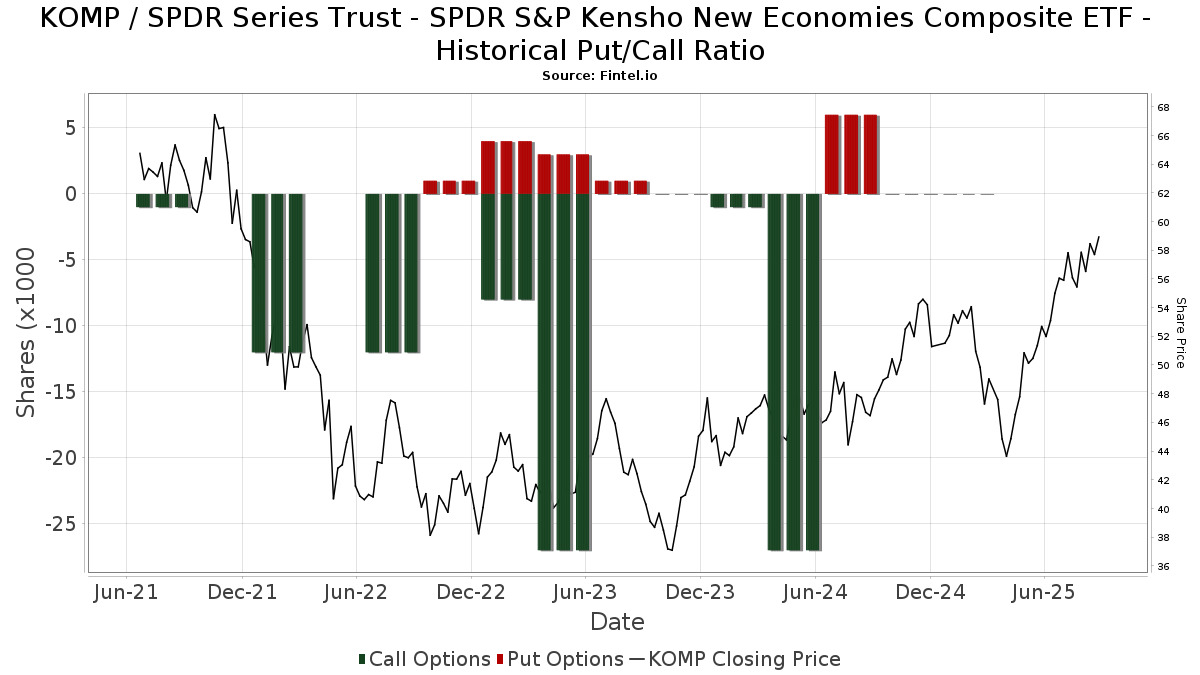
Rasio Put/Call Institusional
Selain melaporkan isu ekuitas dan utang standar, institusi dengan aset di bawah manajemen lebih dari 100 juta dolar AS juga harus mengungkapkan kepemilikan opsi put dan call mereka. Karena opsi put umumnya menunjukkan sentimen negatif, dan opsi call menunjukkan sentimen positif, kita dapat mengetahui sentimen institusional secara keseluruhan dengan memplot rasio put terhadap call. Grafik di sebelah kanan memplot rasio put/call historis untuk instrumen ini.
Menggunakan Rasio Put/Call sebagai indikator sentimen investor mengatasi salah satu kekurangan utama dari penggunaan total kepemilikan institusional, yaitu sejumlah besar aset yang dikelola diinvestasikan secara pasif untuk melacak indeks. Dana yang dikelola secara pasif biasanya tidak membeli opsi, sehingga indikator rasio put/call lebih akurat dalam melacak sentimen dana yang dikelola secara aktif.
Pengajuan 13F dan NPORT
Detail pada pengajuan 13F tersedia gratis. Detail pada pengajuan NP memerlukan keanggotaan premium. Baris berwarna hijau menunjukkan posisi baru. Baris berwarna merah menunjukkan posisi yang sudah ditutup. Klik tautan ini ikon untuk melihat riwayat transaksi selengkapnya.
Tingkatkan
untuk membuka data premium dan mengekspor ke Excel ![]() .
.
| Tanggal File | Sumber | Investor | Ketik | Presyo ng Avg (Silangan) |
Saham | Δ Saham (%) |
Dilaporkan Nilai ($1000) |
Nilai Δ (%) |
Alokasi Port (%) |
|
|---|---|---|---|---|---|---|---|---|---|---|
| 2025-08-14 | 13F | Ancora Advisors, LLC | 640 | 126.15 | 35 | 161.54 | ||||
| 2025-07-11 | 13F | Pinnacle Bancorp, Inc. | 468 | 0.00 | 25 | 19.05 | ||||
| 2025-08-08 | 13F | Austin Wealth Management, LLC | 37,713 | -3.77 | 2,104 | 16.24 | ||||
| 2025-07-30 | 13F | Crewe Advisors LLC | 351 | 216.22 | 19 | 280.00 | ||||
| 2025-07-24 | 13F | Comprehensive Money Management Services LLC | 20,210 | 3.99 | 1,099 | 21.71 | ||||
| 2025-08-12 | 13F | Wayfinding Financial, LLC | 0 | -100.00 | 0 | |||||
| 2025-05-12 | 13F | Sandy Spring Bank | 1,543 | 0.00 | 72 | -8.97 | ||||
| 2025-08-01 | 13F | Envestnet Asset Management Inc | 5,720 | 1.74 | 311 | 19.16 | ||||
| 2025-05-07 | 13F | Evermay Wealth Management Llc | 0 | -100.00 | 0 | -100.00 | ||||
| 2025-07-24 | 13F | Horizon Bancorp Inc /in/ | 8 | 0.00 | 0 | |||||
| 2025-08-14 | 13F | CoreCap Advisors, LLC | 279 | -70.88 | 15 | -65.91 | ||||
| 2025-08-14 | 13F | UBS Group AG | 35,996 | 625.14 | 1,957 | 750.87 | ||||
| 2025-08-13 | 13F | Kilter Group LLC | 202 | 11 | ||||||
| 2025-05-12 | 13F | Quantinno Capital Management LP | 0 | -100.00 | 0 | |||||
| 2025-08-06 | 13F | Commonwealth Equity Services, Llc | 62,700 | -43.57 | 3 | -40.00 | ||||
| 2025-06-17 | 13F | Howe & Rusling Inc | 0 | -100.00 | 0 | |||||
| 2025-08-12 | 13F | RPG Investment Advisory, LLC | 8,182 | -55.76 | 445 | -48.31 | ||||
| 2025-08-14 | 13F | Main Street Financial Solutions, LLC | 0 | -100.00 | 0 | |||||
| 2025-07-24 | 13F | Us Bancorp \de\ | 142 | 389.66 | 8 | 600.00 | ||||
| 2025-07-30 | 13F | Brookstone Capital Management | 6,011 | -2.09 | 327 | 14.39 | ||||
| 2025-07-21 | 13F | Crews Bank & Trust | 500 | 0.00 | 27 | 17.39 | ||||
| 2025-08-14 | 13F | Talon Private Wealth, LLC | 1,056 | 57 | ||||||
| 2025-07-24 | 13F | Capital Advisors, Ltd. LLC | 1,382 | 0.00 | 0 | |||||
| 2025-08-06 | 13F | Entrewealth, Llc | 4,452 | 242 | ||||||
| 2025-08-25 | NP | Connetic Venture Capital Access Fund | 6,028 | 328 | ||||||
| 2025-08-12 | 13F | Proequities, Inc. | 0 | 0 | ||||||
| 2025-08-08 | 13F | SBI Securities Co., Ltd. | 50 | 0.00 | 3 | 0.00 | ||||
| 2025-07-16 | 13F | Meridian Financial, LLC | 5,657 | -5.81 | 308 | 10.04 | ||||
| 2025-07-23 | 13F | Opulen Financial Group LLC | 8,012 | -5.82 | 436 | 10.13 | ||||
| 2025-08-13 | 13F | Continuum Advisory, LLC | 0 | -100.00 | 0 | |||||
| 2025-08-05 | 13F | Bank Of Montreal /can/ | 1,636 | 0.00 | 89 | 15.79 | ||||
| 2025-07-29 | 13F | Stratos Wealth Advisors, LLC | 32,906 | -6.48 | 1,789 | 9.42 | ||||
| 2025-08-11 | 13F | Strategic Wealth Partners, Ltd. | 91 | 5 | ||||||
| 2025-05-15 | 13F | Human Investing LLC | 0 | -100.00 | 0 | |||||
| 2025-07-18 | 13F | Lynx Investment Advisory | 5,467 | 0.24 | 297 | 17.39 | ||||
| 2025-08-08 | 13F | Crossmark Global Holdings, Inc. | 17,561 | -0.35 | 955 | 16.89 | ||||
| 2025-08-08 | 13F | Creative Planning | 8,494 | 0.85 | 462 | 17.90 | ||||
| 2025-07-24 | 13F | IFP Advisors, Inc | 3,124 | 0.06 | 170 | 16.55 | ||||
| 2025-04-22 | 13F | Cambridge Investment Research Advisors, Inc. | 0 | -100.00 | 0 | |||||
| 2025-04-23 | 13F | Sheets Smith Wealth Management | 0 | -100.00 | 0 | |||||
| 2025-05-12 | 13F | Berger Financial Group, Inc | 0 | -100.00 | 0 | |||||
| 2025-08-07 | 13F | Allworth Financial LP | 785 | 0.00 | 43 | 16.67 | ||||
| 2025-08-14 | 13F | Ameriprise Financial Inc | 38,511 | -9.67 | 2,092 | 5.82 | ||||
| 2025-07-28 | 13F | Aries Wealth Management | 3,745 | 204 | ||||||
| 2025-07-15 | 13F | McCarthy & Cox | 56,515 | 17.28 | 3,073 | 37.19 | ||||
| 2025-08-06 | 13F | Atlantic Union Bankshares Corp | 1,543 | 84 | ||||||
| 2025-07-28 | 13F | Harbour Investments, Inc. | 96 | 0.00 | 5 | 25.00 | ||||
| 2025-08-18 | 13F | Geneos Wealth Management Inc. | 34,388 | -1.51 | 1,870 | 15.22 | ||||
| 2025-07-25 | 13F | Northwest Capital Management Inc | 0 | -100.00 | 0 | |||||
| 2025-08-06 | 13F | SNS Financial Group, LLC | 6,265 | 341 | ||||||
| 2025-07-17 | 13F | Sound Income Strategies, LLC | 102 | 3,300.00 | 6 | |||||
| 2025-05-12 | 13F | Founders Financial Alliance, LLC | 0 | -100.00 | 0 | |||||
| 2025-08-08 | 13F | Larson Financial Group LLC | 1,418 | 0.07 | 77 | 18.46 | ||||
| 2025-05-05 | 13F | CBIZ Investment Advisory Services, LLC | 27 | 1 | ||||||
| 2025-05-28 | 13F | Intrua Financial, LLC | 0 | -100.00 | 0 | |||||
| 2025-07-09 | 13F | Towerpoint Wealth, LLC | 101,300 | 8.15 | 5,509 | 26.50 | ||||
| 2025-08-14 | 13F | Capital Planning Advisors, LLC | 8,470 | 0.00 | 461 | 17.05 | ||||
| 2025-08-14 | 13F | Goldman Sachs Group Inc | 19,175 | -79.65 | 1,043 | -76.20 | ||||
| 2025-08-14 | 13F | Colony Group, LLC | 17,894 | 10.79 | 973 | 29.73 | ||||
| 2025-08-04 | 13F | Hantz Financial Services, Inc. | 21 | 0.00 | 0 | |||||
| 2025-05-15 | 13F/A | Orion Portfolio Solutions, LLC | 34,978 | -4.71 | 1,626 | -12.82 | ||||
| 2025-05-15 | 13F | Citadel Advisors Llc | Call | 0 | -100.00 | 0 | -100.00 | |||
| 2025-08-14 | 13F | Bank Of America Corp /de/ | 76,697 | -0.01 | 4,171 | 16.94 | ||||
| 2025-05-15 | 13F | Citadel Advisors Llc | Put | 0 | -100.00 | 0 | -100.00 | |||
| 2025-08-13 | 13F | Russell Investments Group, Ltd. | 58 | -7.94 | 3 | 50.00 | ||||
| 2025-07-15 | 13F | Mather Group, Llc. | 0 | -100.00 | 0 | |||||
| 2025-07-28 | 13F | Essex LLC | 11,155 | -0.40 | 607 | 16.54 | ||||
| 2025-08-11 | 13F | HHM Wealth Advisors, LLC | 195 | 0.00 | 11 | 11.11 | ||||
| 2025-08-14 | 13F | Comerica Bank | 66 | -61.18 | 4 | -57.14 | ||||
| 2025-05-12 | 13F | Richard W. Paul & Associates, LLC | 0 | -100.00 | 0 | -100.00 | ||||
| 2025-08-06 | 13F | AE Wealth Management LLC | 1,544 | -33.04 | 84 | -22.43 | ||||
| 2025-08-12 | 13F | Steward Partners Investment Advisory, Llc | 361 | 0.00 | 20 | 18.75 | ||||
| 2025-08-14 | 13F | Murphy & Mullick Capital Management Corp | 20 | 1 | ||||||
| 2025-04-21 | 13F | Nelson, Van Denburg & Campbell Wealth Management Group, LLC | 0 | -100.00 | 0 | |||||
| 2025-04-22 | 13F | Synergy Financial Management, LLC | 0 | -100.00 | 0 | |||||
| 2025-08-27 | 13F/A | Brinker Capital Investments, LLC | 34,275 | -2.01 | 1,864 | 14.58 | ||||
| 2025-09-04 | 13F/A | Advisor Group Holdings, Inc. | 15,164 | -20.35 | 825 | -6.89 | ||||
| 2025-07-11 | 13F | SILVER OAK SECURITIES, Inc | 17,252 | 0.05 | 938 | 16.09 | ||||
| 2025-07-25 | 13F | We Are One Seven, LLC | 72,685 | 4.33 | 3,953 | 22.01 | ||||
| 2025-07-16 | 13F | NovaPoint Capital, LLC | 0 | -100.00 | 0 | |||||
| 2025-08-14 | 13F | Financial Engines Advisors L.L.C. | 34,307,606 | 3.18 | 1,865,648 | 20.69 | ||||
| 2025-08-14 | 13F | Citadel Advisors Llc | 13,727 | -37.53 | 746 | -26.93 | ||||
| 2025-07-24 | 13F | Trust Co Of Toledo Na /oh/ | 32 | 2 | ||||||
| 2025-07-23 | 13F | Prime Capital Investment Advisors, LLC | 13,351 | -89.68 | 726 | -87.93 | ||||
| 2025-08-05 | 13F | Summit Investment Advisory Services, LLC | 0 | -100.00 | 0 | |||||
| 2025-07-28 | 13F | Ritholtz Wealth Management | 10,755 | -60.46 | 585 | -53.80 | ||||
| 2025-08-11 | 13F | Aptus Capital Advisors, LLC | 92,470 | 8.53 | 5,028 | 26.97 | ||||
| 2025-05-15 | 13F | Two Sigma Securities, Llc | 0 | -100.00 | 0 | |||||
| 2025-07-30 | 13F | Advantage Trust Co | 23,955 | 0.00 | 1,303 | 16.98 | ||||
| 2025-07-22 | 13F | Wealthcare Advisory Partners LLC | 44,561 | 12.68 | 2,423 | 31.83 | ||||
| 2025-08-14 | 13F | Mariner, LLC | 169,266 | 1.88 | 9,205 | 19.18 | ||||
| 2025-08-12 | 13F | Jpmorgan Chase & Co | 118 | -22.88 | 6 | -14.29 | ||||
| 2025-07-09 | 13F | Christopher J. Hasenberg, Inc | 117,008 | 6,363 | ||||||
| 2025-05-15 | 13F | Family Office Research LLC | 0 | -100.00 | 0 | |||||
| 2025-07-14 | 13F | Painted Porch Advisors LLC | 154 | 8 | ||||||
| 2025-08-12 | 13F | Global Retirement Partners, LLC | 986 | -1.79 | 54 | 3.92 | ||||
| 2025-07-25 | 13F | Cwm, Llc | 60,964 | 0.20 | 3 | 50.00 | ||||
| 2025-08-07 | 13F | Hughes Financial Services, LLC | 20,912 | -41.91 | 1,160 | -31.26 | ||||
| 2025-08-13 | 13F | Jones Financial Companies Lllp | 397 | 21 | ||||||
| 2025-05-15 | 13F | Two Sigma Investments, Lp | 0 | -100.00 | 0 | |||||
| 2025-07-29 | 13F | Mezzasalma Advisors, LLC | 3,776 | 205 | ||||||
| 2025-07-09 | 13F | WealthCare Investment Partners, LLC | 22,880 | 4.93 | 1,274 | 36.70 | ||||
| 2025-07-28 | 13F | RFG Advisory, LLC | 0 | -100.00 | 0 | |||||
| 2025-07-28 | 13F | Lunt Capital Management, Inc. | 41,996 | -0.58 | 2,284 | 16.30 | ||||
| 2025-08-13 | 13F | Capital Analysts, Inc. | 491 | 0.00 | 0 | |||||
| 2025-08-11 | 13F | Anfield Capital Management, LLC | 26 | 0.00 | 1 | 0.00 | ||||
| 2025-08-04 | 13F | Assetmark, Inc | 5 | 0 | ||||||
| 2025-08-12 | 13F | O'shaughnessy Asset Management, Llc | 7,485 | 212.27 | 407 | 266.67 | ||||
| 2025-08-14 | 13F | Mercer Global Advisors Inc /adv | 4,119 | -7.17 | 224 | 8.25 | ||||
| 2025-07-14 | 13F | Financial Enhancement Group LLC | 18,105 | 1,005 | ||||||
| 2025-07-25 | 13F | Concord Wealth Partners | 242 | 0.00 | 13 | 18.18 | ||||
| 2025-08-14 | 13F | Jane Street Group, Llc | 0 | -100.00 | 0 | |||||
| 2025-08-13 | 13F | Baird Financial Group, Inc. | 103,639 | 5.85 | 5,636 | 23.82 | ||||
| 2025-08-14 | 13F | GWM Advisors LLC | 540 | 40.26 | 29 | 70.59 | ||||
| 2025-08-11 | 13F | Bellwether Advisors, LLC | 1,179 | 0.00 | 64 | 18.52 | ||||
| 2025-07-30 | 13F | Princeton Global Asset Management LLC | 400 | 0.00 | 22 | 16.67 | ||||
| 2025-05-15 | 13F | EP Wealth Advisors, Inc. | 0 | -100.00 | 0 | -100.00 | ||||
| 2025-07-23 | 13F | 1 North Wealth Services Llc | 25 | 0.00 | 1 | 0.00 | ||||
| 2025-08-07 | 13F | Resources Investment Advisors, LLC. | 10,146 | 2.99 | 552 | 20.57 | ||||
| 2025-07-22 | 13F | SOL Capital Management CO | 25,988 | -24.26 | 1 | 0.00 | ||||
| 2025-07-15 | 13F | North Star Investment Management Corp. | 350 | 0.00 | 19 | 18.75 | ||||
| 2025-08-11 | 13F | HighTower Advisors, LLC | 27,192 | -13.47 | 1,479 | 1.16 | ||||
| 2025-08-11 | 13F | Root Financial Partners, LLC | 4,155 | 226 | ||||||
| 2025-08-15 | 13F | Tower Research Capital LLC (TRC) | 9,145 | -29.51 | 497 | -17.58 | ||||
| 2025-07-10 | 13F | Exchange Traded Concepts, Llc | 4,815 | 262 | ||||||
| 2025-08-05 | 13F | Key FInancial Inc | 97 | 16.87 | 5 | 66.67 | ||||
| 2025-08-05 | 13F | Simplex Trading, Llc | 0 | -100.00 | 0 | |||||
| 2025-08-08 | 13F | Capital Investment Advisory Services, LLC | 571 | 0.00 | 31 | 19.23 | ||||
| 2025-07-11 | 13F | Farther Finance Advisors, LLC | 7,372 | -38.17 | 401 | -28.32 | ||||
| 2025-08-14 | 13F | Wells Fargo & Company/mn | 23,181 | 2.81 | 1,261 | 20.23 | ||||
| 2025-07-29 | 13F | Fundamentun, Llc | 0 | -100.00 | 0 | -100.00 | ||||
| 2025-08-14 | 13F | Sherman Asset Management, Inc. | 7,594 | -52.51 | 413 | -44.55 | ||||
| 2025-08-14 | 13F | Royal Bank Of Canada | 141,721 | 41.61 | 7,707 | 65.64 | ||||
| 2025-08-13 | 13F | Northwestern Mutual Wealth Management Co | 1,525 | 6.87 | 83 | 24.24 | ||||
| 2025-08-15 | 13F | Morgan Stanley | 353,742 | -58.01 | 19,237 | -50.88 | ||||
| 2025-07-08 | 13F | Parallel Advisors, LLC | 28 | 21.74 | 2 | 0.00 | ||||
| 2025-07-25 | 13F | Apollon Wealth Management, LLC | 0 | -100.00 | 0 | |||||
| 2025-05-14 | 13F | Toroso Investments, LLC | 0 | -100.00 | 0 | |||||
| 2025-08-08 | 13F | Good Life Advisors, LLC | 50,838 | 1.91 | 2,765 | 19.19 | ||||
| 2025-08-14 | 13F | Susquehanna International Group, Llp | 30,132 | 178.56 | 1,639 | 226.29 | ||||
| 2025-08-04 | 13F | Quaker Wealth Management, LLC | 49 | 3 | ||||||
| 2025-08-14 | 13F | Integrated Wealth Concepts LLC | 5,036 | -0.92 | 274 | 15.68 | ||||
| 2025-08-08 | 13F | Gts Securities Llc | 18,402 | 279.11 | 1,001 | 344.44 | ||||
| 2025-08-14 | 13F | Betterment LLC | 1,517,997 | -14.40 | 83 | 0.00 | ||||
| 2025-08-14 | 13F | Stifel Financial Corp | 17,636 | -0.88 | 959 | 15.96 | ||||
| 2025-07-08 | 13F | Strategic Advocates LLC | 551,043 | 2.71 | 29,966 | 20.14 | ||||
| 2025-08-01 | 13F | Penobscot Wealth Management | 49,701 | 8.95 | 2,703 | 27.45 | ||||
| 2025-04-15 | 13F | Fifth Third Bancorp | 0 | -100.00 | 0 | |||||
| 2025-07-29 | 13F | Financial Guidance Group, Inc. | 92,333 | 8.55 | 5,021 | 26.99 | ||||
| 2025-07-07 | 13F | Global Wealth Strategies & Associates | 0 | -100.00 | 0 | |||||
| 2025-08-12 | 13F | Archer Investment Corp | 67 | 0.00 | 4 | 0.00 | ||||
| 2025-08-14 | 13F | Raymond James Financial Inc | 91,819 | -5.86 | 4,993 | 10.12 | ||||
| 2025-08-04 | 13F | Quaker Wealth Management, LLC | Put | 0 | -100.00 | 0 | -100.00 | |||
| 2025-07-31 | 13F | Wealthfront Advisers Llc | 5,466 | 21.52 | 297 | 42.11 | ||||
| 2025-07-31 | 13F | Optimum Investment Advisors | 796 | 0.00 | 43 | 16.22 | ||||
| 2025-08-08 | 13F | Cetera Investment Advisers | 21,734 | 60.37 | 1,182 | 87.46 | ||||
| 2025-08-12 | 13F | LPL Financial LLC | 127,668 | -33.76 | 6,943 | -22.51 | ||||
| 2025-05-14 | 13F | Fisher Asset Management, LLC | 0 | -100.00 | 0 | |||||
| 2025-07-10 | 13F | Global Financial Private Client, LLC | 0 | -100.00 | 0 | |||||
| 2025-08-14 | 13F | Fmr Llc | 6,322 | -13.80 | 344 | 0.88 | ||||
| 2025-08-14 | 13F | IHT Wealth Management, LLC | 10,688 | -2.61 | 581 | 13.92 | ||||
| 2025-07-28 | 13F | Duncker Streett & Co Inc | 0 | -100.00 | 0 | -100.00 | ||||
| 2025-05-16 | 13F | Coppell Advisory Solutions LLC | 0 | -100.00 | 0 | |||||
| 2025-08-12 | 13F | Coston, McIsaac & Partners | 349 | 0.00 | 0 | |||||
| 2025-08-08 | 13F | Pnc Financial Services Group, Inc. | 5,457 | 251.84 | 297 | 311.11 |
Other Listings
| MX:KOMP |