Mga Batayang Estadistika
| Pemilik Institusional | 104 total, 104 long only, 0 short only, 0 long/short - change of 15.22% MRQ |
| Alokasi Portofolio Rata-rata | 0.2718 % - change of -14.58% MRQ |
| Saham Institusional (Jangka Panjang) | 5,332,036 (ex 13D/G) - change of 0.96MM shares 22.06% MRQ |
| Nilai Institusional (Jangka Panjang) | $ 199,027 USD ($1000) |
Kepemilikan Institusional dan Pemegang Saham
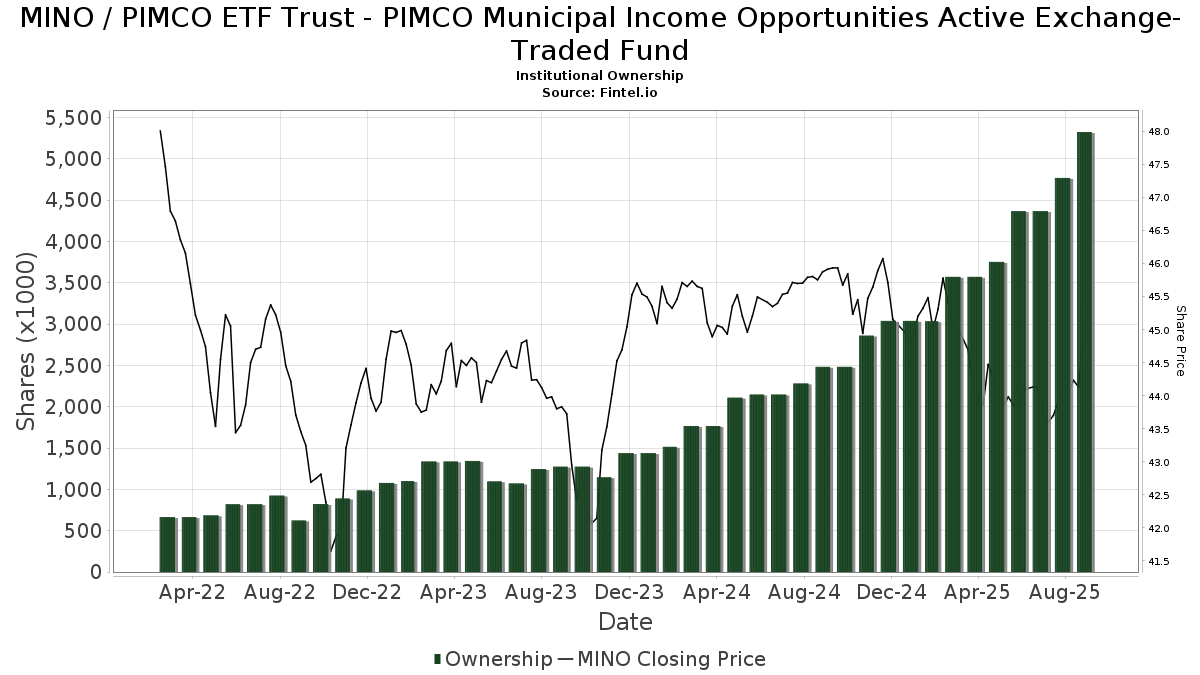
PIMCO ETF Trust - PIMCO Municipal Income Opportunities Active Exchange-Traded Fund (US:MINO) memiliki 104 pemilik institusional dan pemegang saham yang telah mengajukan formulir 13D/G atau 13F kepada Komisi Bursa Efek (Securities Exchange Commission/SEC). Lembaga-lembaga ini memegang total 5,332,036 saham. Pemegang saham terbesar meliputi Cwm, Llc, Great Valley Advisor Group, Inc., LPL Financial LLC, Waterway Wealth Management, LLC, Kovitz Investment Group Partners, LLC, Truist Financial Corp, Envestnet Asset Management Inc, Advisor Group Holdings, Inc., GWM Advisors LLC, and Cary Street Partners Financial Llc .
Struktur kepemilikan institusional PIMCO ETF Trust - PIMCO Municipal Income Opportunities Active Exchange-Traded Fund (ARCA:MINO) menunjukkan posisi terkini di perusahaan oleh institusi dan dana, serta perubahan terbaru dalam ukuran posisi. Pemegang saham utama dapat mencakup investor individu, reksa dana, dana lindung nilai, atau institusi. Jadwal 13D menunjukkan bahwa investor memegang (atau pernah memegang) lebih dari 5% saham perusahaan dan bermaksud (atau pernah bermaksud) untuk secara aktif mengejar perubahan strategi bisnis. Jadwal 13G menunjukkan investasi pasif lebih dari 5%.
The share price as of September 5, 2025 is 44.53 / share. Previously, on September 9, 2024, the share price was 45.79 / share. This represents a decline of 2.75% over that period.
Skor Sentimen Dana
Skor Sentimen Dana (sebelumnya dikenal sebagai Skor Akumulasi Kepemilikan) menemukan saham-saham yang paling banyak dibeli oleh dana. Ini adalah hasil dari model kuantitatif multi-faktor yang canggih yang mengidentifikasi perusahaan dengan tingkat akumulasi institusional tertinggi. Model penilaian menggunakan kombinasi dari total peningkatan pemilik yang diungkapkan, perubahan dalam alokasi portofolio pada pemilik tersebut, dan metrik lainnya. Angka berkisar dari 0 hingga 100, dengan angka yang lebih tinggi menunjukkan tingkat akumulasi yang lebih tinggi dibandingkan dengan perusahaan sejenisnya, dan 50 adalah rata-ratanya.
Frekuensi Pembaruan: Setiap Hari
Lihat Ownership Explorer, yang menyediakan daftar perusahaan dengan peringkat tertinggi.
Rasio Put/Call Institusional
Selain melaporkan isu ekuitas dan utang standar, institusi dengan aset di bawah manajemen lebih dari 100 juta dolar AS juga harus mengungkapkan kepemilikan opsi put dan call mereka. Karena opsi put umumnya menunjukkan sentimen negatif, dan opsi call menunjukkan sentimen positif, kita dapat mengetahui sentimen institusional secara keseluruhan dengan memplot rasio put terhadap call. Grafik di sebelah kanan memplot rasio put/call historis untuk instrumen ini.
Menggunakan Rasio Put/Call sebagai indikator sentimen investor mengatasi salah satu kekurangan utama dari penggunaan total kepemilikan institusional, yaitu sejumlah besar aset yang dikelola diinvestasikan secara pasif untuk melacak indeks. Dana yang dikelola secara pasif biasanya tidak membeli opsi, sehingga indikator rasio put/call lebih akurat dalam melacak sentimen dana yang dikelola secara aktif.
Pengajuan 13F dan NPORT
Detail pada pengajuan 13F tersedia gratis. Detail pada pengajuan NP memerlukan keanggotaan premium. Baris berwarna hijau menunjukkan posisi baru. Baris berwarna merah menunjukkan posisi yang sudah ditutup. Klik tautan ini ikon untuk melihat riwayat transaksi selengkapnya.
Tingkatkan
untuk membuka data premium dan mengekspor ke Excel ![]() .
.
| Tanggal File | Sumber | Investor | Ketik | Presyo ng Avg (Silangan) |
Saham | Δ Saham (%) |
Dilaporkan Nilai ($1000) |
Nilai Δ (%) |
Alokasi Port (%) |
|
|---|---|---|---|---|---|---|---|---|---|---|
| 2025-08-19 | 13F | Cape Investment Advisory, Inc. | 300 | 0.00 | 13 | 0.00 | ||||
| 2025-08-14 | 13F | Clarity Asset Management, Inc. | 88,807 | -41.29 | 3,928 | -41.96 | ||||
| 2025-07-28 | 13F | Allianz Asset Management GmbH | 439 | 5.53 | 19 | 5.56 | ||||
| 2025-05-15 | 13F/A | Orion Portfolio Solutions, LLC | 38,098 | -10.85 | 1,704 | -11.48 | ||||
| 2025-07-08 | 13F | Richard P Slaughter Associates Inc | 0 | -100.00 | 0 | |||||
| 2025-08-15 | 13F | Equitable Holdings, Inc. | 0 | -100.00 | 0 | |||||
| 2025-08-12 | 13F | Steward Partners Investment Advisory, Llc | 7,400 | 12,658.62 | 327 | 16,250.00 | ||||
| 2025-08-12 | 13F | Viawealth, Llc | 34,243 | 68.37 | 1,515 | 66.56 | ||||
| 2025-07-22 | 13F | DAVENPORT & Co LLC | 4,857 | 215 | ||||||
| 2025-07-28 | 13F | WealthPLAN Partners, LLC | 0 | -100.00 | 0 | |||||
| 2025-08-13 | 13F | Mayfair Advisory Group, LLC | 13,550 | 595 | ||||||
| 2025-07-16 | 13F | RWM Asset Management, LLC | 19,718 | -3.42 | 872 | -4.49 | ||||
| 2025-07-29 | 13F | Private Trust Co Na | 3,954 | 160.99 | 175 | 159.70 | ||||
| 2025-08-14 | 13F | Cove Street Capital, LLC | 11,427 | 505 | ||||||
| 2025-08-01 | 13F | Envestnet Asset Management Inc | 192,720 | 7.86 | 8,524 | 6.67 | ||||
| 2025-08-08 | 13F | Cetera Investment Advisers | 6,833 | 0.00 | 302 | -0.98 | ||||
| 2025-07-10 | 13F | Wealth Enhancement Advisory Services, Llc | 43,863 | 91.95 | 1,935 | 89.24 | ||||
| 2025-07-28 | 13F | WealthPlan Investment Management, LLC | 6,245 | 276 | ||||||
| 2025-08-14 | 13F | Great Valley Advisor Group, Inc. | 414,729 | 18,344 | ||||||
| 2025-08-14 | 13F | Mml Investors Services, Llc | 30,600 | 153.69 | 1 | |||||
| 2025-08-14 | 13F | Wiley Bros.-aintree Capital, Llc | 14,590 | 645 | ||||||
| 2025-07-31 | 13F | Cambridge Investment Research Advisors, Inc. | 85,456 | -16.89 | 4 | -25.00 | ||||
| 2025-08-05 | 13F | Dahring | Cusmano Llc | 11,543 | 6.92 | 511 | 5.81 | ||||
| 2025-08-14 | 13F | UBS Group AG | 0 | -100.00 | 0 | |||||
| 2025-07-25 | 13F | Landmark Wealth Management, LLC | 22,437 | 12.65 | 1 | |||||
| 2025-08-12 | 13F | Financial Advocates Investment Management | 17,606 | 779 | ||||||
| 2025-04-28 | 13F | Oregon Pacific Wealth Management, LLC | 0 | -100.00 | 0 | |||||
| 2025-07-24 | 13F | Blair William & Co/il | 1,860 | -25.30 | 82 | -26.13 | ||||
| 2025-08-13 | 13F | Capital Analysts, Inc. | 1,700 | 0 | ||||||
| 2025-08-08 | 13F | Tanglewood Legacy Advisors, LLC | 0 | -100.00 | 0 | |||||
| 2025-08-14 | 13F | Citadel Advisors Llc | 22,892 | 1,013 | ||||||
| 2025-08-14 | 13F | CoreCap Advisors, LLC | 873 | 39 | ||||||
| 2025-08-14 | 13F | Waterway Wealth Management, LLC | 374,393 | 34.06 | 16,560 | 32.56 | ||||
| 2025-08-14 | 13F | Warren Averett Asset Management, LLC | 13,992 | -2.37 | 619 | -3.59 | ||||
| 2025-07-24 | 13F | CarsonAllaria Wealth Management, Ltd. | 145,888 | 32.25 | 6,453 | 30.77 | ||||
| 2025-08-06 | 13F | Vestmark Advisory Solutions, Inc. | 25,014 | -48.19 | 1,106 | -48.77 | ||||
| 2025-08-11 | 13F | Principal Securities, Inc. | 1,207 | 30.35 | 53 | 29.27 | ||||
| 2025-07-22 | 13F | Beacon Financial Advisory LLC | 5,105 | 0.59 | 226 | -0.88 | ||||
| 2025-08-06 | 13F | Commonwealth Equity Services, Llc | 113,448 | 31.92 | 5 | 66.67 | ||||
| 2025-08-12 | 13F | LPL Financial LLC | 381,976 | 5.27 | 16,895 | 4.09 | ||||
| 2025-07-31 | 13F | Trademark Financial Management, LLC | 14,581 | -15.75 | 645 | -16.80 | ||||
| 2025-08-08 | 13F | Laurel Wealth Planning LLC | 38,589 | 0.30 | 1,707 | -0.81 | ||||
| 2025-07-25 | 13F | Cwm, Llc | 481,185 | 12.96 | 21 | 10.53 | ||||
| 2025-08-08 | 13F | Crossmark Global Holdings, Inc. | 9,964 | -3.37 | 441 | -4.56 | ||||
| 2025-08-08 | 13F | Capital Investment Advisory Services, LLC | 285 | 13 | ||||||
| 2025-08-14 | 13F | GWM Advisors LLC | 173,656 | 28.14 | 7,681 | 26.71 | ||||
| 2025-08-08 | 13F | Sittner & Nelson, Llc | 23,393 | 142.49 | 1,035 | 139.91 | ||||
| 2025-08-13 | 13F | Flow Traders U.s. Llc | 17,197 | -14.88 | 1 | |||||
| 2025-08-14 | 13F | Jane Street Group, Llc | 48,532 | -65.67 | 2,147 | -66.06 | ||||
| 2025-07-28 | 13F | Harbour Investments, Inc. | 2,244 | 0.00 | 99 | -1.00 | ||||
| 2025-08-05 | 13F | GPS Wealth Strategies Group, LLC | 6,543 | -19.29 | 289 | -20.17 | ||||
| 2025-08-14 | 13F | Visionary Wealth Advisors | 56,866 | 0.60 | 2,515 | -0.51 | ||||
| 2025-08-08 | 13F | Avantax Advisory Services, Inc. | 59,792 | -0.63 | 2,645 | -1.75 | ||||
| 2025-08-11 | 13F | Elequin Capital Lp | 12,483 | 552 | ||||||
| 2025-07-29 | 13F | Stratos Wealth Partners, LTD. | 12,750 | 564 | ||||||
| 2025-08-13 | 13F | StoneX Group Inc. | 22,710 | -50.75 | 1,004 | -51.31 | ||||
| 2025-08-27 | 13F/A | Brinker Capital Investments, LLC | 29,522 | -22.51 | 1,306 | -23.42 | ||||
| 2025-08-12 | 13F | Change Path, LLC | 32,881 | 37.85 | 1,454 | 36.40 | ||||
| 2025-07-25 | 13F | Envestnet Portfolio Solutions, Inc. | 6,825 | -11.80 | 302 | -13.01 | ||||
| 2025-08-08 | 13F | Hedeker Wealth, LLC | 34,998 | -4.54 | 1,548 | -5.61 | ||||
| 2025-07-15 | 13F | Avaii Wealth Management, Llc | 7,260 | 6.98 | 321 | 5.94 | ||||
| 2025-08-14 | 13F | Royal Bank Of Canada | 5,902 | -74.20 | 261 | -74.49 | ||||
| 2025-08-12 | 13F | Jpmorgan Chase & Co | 1,288 | -98.76 | 57 | -98.79 | ||||
| 2025-08-27 | 13F | Barnes Wealth Management Group, Inc | 11,399 | 27.43 | 504 | 26.00 | ||||
| 2025-08-14 | 13F | Wells Fargo & Company/mn | 0 | 0 | ||||||
| 2025-08-04 | 13F | Creative Financial Designs Inc /adv | 2,327 | 0.91 | 103 | -0.97 | ||||
| 2025-08-06 | 13F | SOUTH STATE Corp | 5,029 | -45.01 | 222 | -45.72 | ||||
| 2025-07-15 | 13F | BCS Wealth Management | 52,586 | -37.03 | 2 | -33.33 | ||||
| 2025-08-13 | 13F | GeoWealth Management, LLC | 143,132 | 6,331 | ||||||
| 2025-07-31 | 13F | Briaud Financial Planning, Inc | 546 | 0 | ||||||
| 2025-07-18 | 13F | Truist Financial Corp | 206,709 | 25.88 | 9,143 | 24.47 | ||||
| 2025-08-11 | 13F | Advisor Resource Council | 0 | -100.00 | 0 | |||||
| 2025-07-29 | 13F | AssuredPartners Investment Advisors, LLC | 9,180 | 406 | ||||||
| 2025-08-04 | 13F | Premier Path Wealth Partners, LLC | 14,667 | -6.10 | 649 | -7.16 | ||||
| 2025-07-17 | 13F | Sterling Investment Advisors, Ltd. | 20,350 | 39.29 | 900 | 37.83 | ||||
| 2025-08-05 | 13F | Beckerman Institutional, LLC | 16,987 | 0.00 | 1 | |||||
| 2025-08-14 | 13F | Kovitz Investment Group Partners, LLC | 284,748 | 42.41 | 12,593 | 40.80 | ||||
| 2025-08-12 | 13F | Proequities, Inc. | 0 | 0 | ||||||
| 2025-03-12 | 13F/A | Private Capital Management Llc | 6,763 | 18.67 | 307 | 18.08 | ||||
| 2025-08-12 | 13F | Global Retirement Partners, LLC | 17,150 | 759 | ||||||
| 2025-07-17 | 13F | Janney Montgomery Scott LLC | 10,100 | 5.42 | 0 | |||||
| 2025-08-12 | 13F | Argent Trust Co | 0 | -100.00 | 0 | |||||
| 2025-08-05 | 13F | Summit Investment Advisory Services, LLC | 0 | -100.00 | 0 | |||||
| 2025-07-11 | 13F | Farther Finance Advisors, LLC | 11,944 | -4.30 | 528 | -5.55 | ||||
| 2025-07-17 | 13F | Asio Capital, LLC | 133,265 | 5,894 | ||||||
| 2025-08-04 | 13F | Bridgewealth Advisory Group, LLC | 48,520 | 140.78 | 2,146 | 138.18 | ||||
| 2025-07-17 | 13F | Clear Point Advisors Inc. | 0 | -100.00 | 0 | |||||
| 2025-08-06 | 13F | Paulson Wealth Management Inc. | 66,506 | -42.26 | 2,942 | -42.92 | ||||
| 2025-08-04 | 13F | Econ Financial Services Corp | 46,867 | -5.18 | 2,073 | -6.24 | ||||
| 2025-08-14 | 13F | Stifel Financial Corp | 37,017 | 0.43 | 1,637 | -0.67 | ||||
| 2025-08-19 | 13F | Advisory Services Network, LLC | 7,262 | 318 | ||||||
| 2025-05-12 | 13F | Fmr Llc | 0 | -100.00 | 0 | |||||
| 2025-04-23 | 13F | SFG Wealth Management, LLC. | 0 | -100.00 | 0 | |||||
| 2025-07-14 | 13F | ABLE Financial Group, LLC | 44,254 | 1,957 | ||||||
| 2025-08-06 | 13F | Able Wealth Management LLC | 31,153 | 26.50 | 1,378 | 25.07 | ||||
| 2025-08-07 | 13F | Kestra Private Wealth Services, Llc | 0 | -100.00 | 0 | |||||
| 2025-08-14 | 13F | Raymond James Financial Inc | 48,215 | 9.30 | 2,133 | 8.06 | ||||
| 2025-09-04 | 13F/A | Advisor Group Holdings, Inc. | 180,325 | 14.23 | 7,978 | 12.97 | ||||
| 2025-07-11 | 13F | Mallini Complete Financial Planning LLC | 265 | -1.12 | ||||||
| 2025-08-08 | 13F | Emerald Investment Partners, Llc | 12,692 | -7.22 | 561 | -8.18 | ||||
| 2025-08-26 | 13F | Nautilus Advisors LLC | 5,895 | -6.72 | 261 | -7.80 | ||||
| 2025-08-11 | 13F | HighTower Advisors, LLC | 7,156 | -93.80 | 317 | -93.88 | ||||
| 2025-04-24 | 13F | Bordeaux Wealth Advisors LLC | 0 | -100.00 | 0 | |||||
| 2025-08-12 | 13F | Quadcap Wealth Management, LLC | 46,527 | 5.08 | 2,058 | 3.89 | ||||
| 2025-05-14 | 13F | Susquehanna International Group, Llp | 0 | -100.00 | 0 | |||||
| 2025-08-13 | 13F | Cary Street Partners Financial Llc | 159,580 | 7,058 | ||||||
| 2025-07-18 | 13F | Wetzel Investment Advisors, Inc. | 12,000 | 0.00 | 531 | -1.12 | ||||
| 2025-07-24 | 13F | IFP Advisors, Inc | 3,309 | -8.01 | 146 | -8.75 | ||||
| 2025-07-24 | 13F | Lokken Investment Group LLC | 39,152 | -22.32 | 1,732 | -23.20 | ||||
| 2025-07-30 | 13F | Mason & Associates, LLC | 46,230 | 2,045 | ||||||
| 2025-05-12 | 13F | Independent Advisor Alliance | 0 | -100.00 | 0 | |||||
| 2025-07-11 | 13F | Sprinkle Financial Consultants LLC | 39,775 | 15.31 | 1,759 | 14.07 | ||||
| 2025-07-29 | 13F | Kelman-Lazarov, Inc. | 7,630 | 337 | ||||||
| 2025-08-14 | 13F | Sunbelt Securities, Inc. | 546 | 0.00 | 25 | 0.00 | ||||
| 2025-05-16 | 13F | Coppell Advisory Solutions LLC | 0 | -100.00 | 0 | |||||
| 2025-08-15 | 13F | Morgan Stanley | 8,262 | 826,100.00 | 365 | |||||
| 2025-08-05 | 13F | Arrowroot Family Office, LLC | 33,043 | 0.55 | 1,462 | -1.28 | ||||
| 2025-08-08 | 13F | Tortoise Investment Management, LLC | 40 | 0.00 | 2 | 0.00 | ||||
| 2025-08-11 | 13F | Private Advisor Group, LLC | 115,153 | -46.70 | 5,093 | -47.30 | ||||
| 2025-08-15 | 13F | Semmax Financial Advisors Inc. | 1,966 | 0.98 | 86 | 0.00 | ||||
| 2025-08-15 | 13F | Kestra Advisory Services, LLC | 14,871 | 112.56 | 658 | 110.58 | ||||
| 2025-07-10 | 13F | High Net Worth Advisory Group LLC | 6,022 | 0.00 | 266 | -1.12 | ||||
| 2025-08-11 | 13F | PAX Financial Group, LLC | 38,490 | -15.44 | 1,702 | -16.40 | ||||
| 2025-07-29 | 13F | Financial Futures Ltd Liability Co. | 0 | -100.00 | 0 | |||||
| 2025-08-05 | 13F | Integrity Wealth Solutions LLC | 19,487 | 101.02 | 862 | 98.85 |