Mga Batayang Estadistika
| Pemilik Institusional | 127 total, 127 long only, 0 short only, 0 long/short - change of 12.28% MRQ |
| Alokasi Portofolio Rata-rata | 0.4026 % - change of -14.11% MRQ |
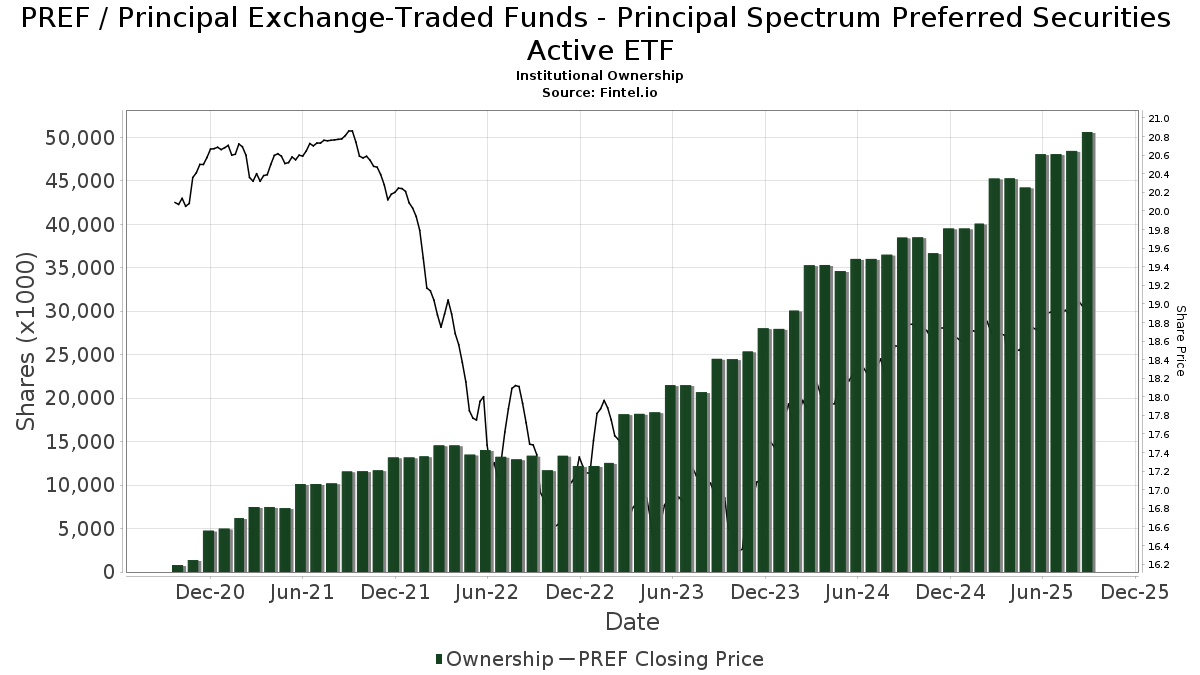
| Saham Institusional (Jangka Panjang) | 50,615,034 (ex 13D/G) - change of 2.55MM shares 5.29% MRQ |
| Nilai Institusional (Jangka Panjang) | $ 952,726 USD ($1000) |
Kepemilikan Institusional dan Pemegang Saham
Principal Exchange-Traded Funds - Principal Spectrum Preferred Securities Active ETF (US:PREF) memiliki 127 pemilik institusional dan pemegang saham yang telah mengajukan formulir 13D/G atau 13F kepada Komisi Bursa Efek (Securities Exchange Commission/SEC). Lembaga-lembaga ini memegang total 50,615,034 saham. Pemegang saham terbesar meliputi Bank Of America Corp /de/, UBS Group AG, Morgan Stanley, Wells Fargo & Company/mn, Royal Bank Of Canada, IFC Advisors LLC, LPL Financial LLC, Raymond James Financial Inc, Permanens Capital L.P., and Wealth Enhancement Advisory Services, Llc .
Struktur kepemilikan institusional Principal Exchange-Traded Funds - Principal Spectrum Preferred Securities Active ETF (ARCA:PREF) menunjukkan posisi terkini di perusahaan oleh institusi dan dana, serta perubahan terbaru dalam ukuran posisi. Pemegang saham utama dapat mencakup investor individu, reksa dana, dana lindung nilai, atau institusi. Jadwal 13D menunjukkan bahwa investor memegang (atau pernah memegang) lebih dari 5% saham perusahaan dan bermaksud (atau pernah bermaksud) untuk secara aktif mengejar perubahan strategi bisnis. Jadwal 13G menunjukkan investasi pasif lebih dari 5%.
The share price as of September 5, 2025 is 19.02 / share. Previously, on September 6, 2024, the share price was 18.54 / share. This represents an increase of 2.62% over that period.
Skor Sentimen Dana
Skor Sentimen Dana (sebelumnya dikenal sebagai Skor Akumulasi Kepemilikan) menemukan saham-saham yang paling banyak dibeli oleh dana. Ini adalah hasil dari model kuantitatif multi-faktor yang canggih yang mengidentifikasi perusahaan dengan tingkat akumulasi institusional tertinggi. Model penilaian menggunakan kombinasi dari total peningkatan pemilik yang diungkapkan, perubahan dalam alokasi portofolio pada pemilik tersebut, dan metrik lainnya. Angka berkisar dari 0 hingga 100, dengan angka yang lebih tinggi menunjukkan tingkat akumulasi yang lebih tinggi dibandingkan dengan perusahaan sejenisnya, dan 50 adalah rata-ratanya.
Frekuensi Pembaruan: Setiap Hari
Lihat Ownership Explorer, yang menyediakan daftar perusahaan dengan peringkat tertinggi.
Rasio Put/Call Institusional
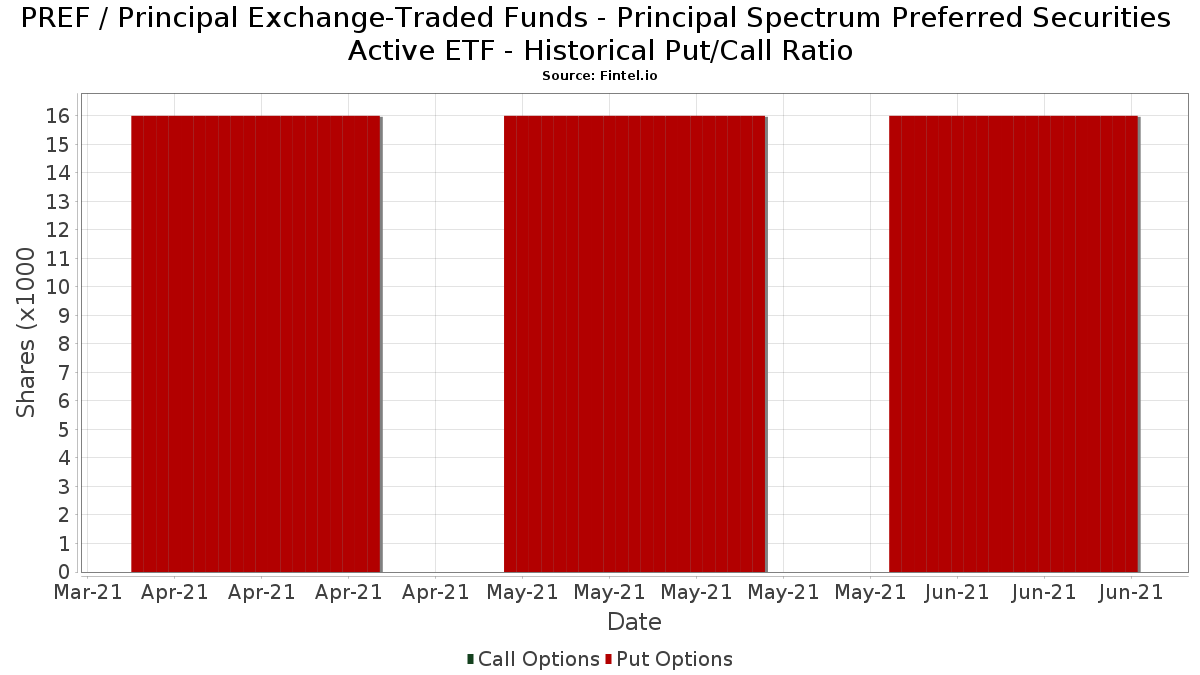
Selain melaporkan isu ekuitas dan utang standar, institusi dengan aset di bawah manajemen lebih dari 100 juta dolar AS juga harus mengungkapkan kepemilikan opsi put dan call mereka. Karena opsi put umumnya menunjukkan sentimen negatif, dan opsi call menunjukkan sentimen positif, kita dapat mengetahui sentimen institusional secara keseluruhan dengan memplot rasio put terhadap call. Grafik di sebelah kanan memplot rasio put/call historis untuk instrumen ini.
Menggunakan Rasio Put/Call sebagai indikator sentimen investor mengatasi salah satu kekurangan utama dari penggunaan total kepemilikan institusional, yaitu sejumlah besar aset yang dikelola diinvestasikan secara pasif untuk melacak indeks. Dana yang dikelola secara pasif biasanya tidak membeli opsi, sehingga indikator rasio put/call lebih akurat dalam melacak sentimen dana yang dikelola secara aktif.
Pengajuan 13F dan NPORT
Detail pada pengajuan 13F tersedia gratis. Detail pada pengajuan NP memerlukan keanggotaan premium. Baris berwarna hijau menunjukkan posisi baru. Baris berwarna merah menunjukkan posisi yang sudah ditutup. Klik tautan ini ikon untuk melihat riwayat transaksi selengkapnya.
Tingkatkan
untuk membuka data premium dan mengekspor ke Excel ![]() .
.
| Tanggal File | Sumber | Investor | Ketik | Presyo ng Avg (Silangan) |
Saham | Δ Saham (%) |
Dilaporkan Nilai ($1000) |
Nilai Δ (%) |
Alokasi Port (%) |
|
|---|---|---|---|---|---|---|---|---|---|---|
| 2025-08-14 | 13F | Coastal Bridge Advisors, LLC | 25,663 | 0.00 | 487 | 1.46 | ||||
| 2025-07-31 | 13F | Cambridge Investment Research Advisors, Inc. | 21,739 | 5.26 | 0 | |||||
| 2025-08-14 | 13F | GWM Advisors LLC | 158,682 | 4.58 | 3,010 | 6.10 | ||||
| 2025-05-16 | 13F | Laidlaw Wealth Management LLC | 0 | -100.00 | 0 | |||||
| 2025-07-22 | 13F | DAVENPORT & Co LLC | 11,753 | -4.08 | 223 | -3.06 | ||||
| 2025-07-30 | 13F | Meadow Creek Wealth Advisors Llc | 130,435 | 14.75 | 2,474 | 16.42 | ||||
| 2025-07-14 | 13F | AdvisorNet Financial, Inc | 285 | 5 | ||||||
| 2025-08-04 | 13F | Hantz Financial Services, Inc. | 800 | 0 | ||||||
| 2025-08-07 | 13F | Cascade Financial Partners, LLC | 17,399 | 330 | ||||||
| 2025-09-04 | 13F/A | Advisor Group Holdings, Inc. | 78,543 | 4.79 | 1,490 | 6.35 | ||||
| 2025-07-11 | 13F/A | Umb Bank N A/mo | 54,005 | 0.00 | 1,024 | 1.49 | ||||
| 2025-08-08 | 13F | Principal Financial Group Inc | 284,025 | 23.39 | 5,381 | 25.11 | ||||
| 2025-05-08 | 13F | Geneos Wealth Management Inc. | 0 | -100.00 | 0 | |||||
| 2025-07-15 | 13F | GSB Wealth Management, LLC | 224,275 | 16.10 | 4,255 | 17.77 | ||||
| 2025-08-08 | 13F | Compass Financial Services Inc | 0 | -100.00 | 0 | |||||
| 2025-08-12 | 13F | Jacobi Capital Management LLC | 16,783 | -1.53 | 318 | 0.00 | ||||
| 2025-08-14 | 13F | Royal Bank Of Canada | 3,073,039 | -0.71 | 58,296 | 0.73 | ||||
| 2025-05-15 | 13F/A | Orion Portfolio Solutions, LLC | 17,468 | -74.42 | 327 | -74.35 | ||||
| 2025-08-07 | 13F | Fidelis Capital Partners, LLC | 10,111 | 0.00 | 191 | 2.14 | ||||
| 2025-08-19 | 13F | Asset Dedication, LLC | 0 | -100.00 | 0 | |||||
| 2025-07-29 | 13F | Stephens Inc /ar/ | 20,417 | 387 | ||||||
| 2025-08-14 | 13F | Colony Group, LLC | 242,920 | 4,608 | ||||||
| 2025-07-24 | 13F | IFP Advisors, Inc | 19,540 | 0.00 | 371 | 1.37 | ||||
| 2025-08-06 | 13F | Bensler, LLC | 582,078 | 11.67 | 11,042 | 13.30 | ||||
| 2025-08-12 | 13F | J.w. Cole Advisors, Inc. | 136,786 | 0.83 | 2,595 | 2.29 | ||||
| 2025-07-07 | 13F | First Citizens Financial Corp | 50,847 | -3.74 | 965 | -2.33 | ||||
| 2025-08-14 | 13F | Heritage Wealth Management, Inc. | 25,300 | 0.00 | 480 | 1.27 | ||||
| 2025-08-14 | 13F | Dearborn Partners Llc | 84,284 | -19.07 | 1,599 | -17.93 | ||||
| 2025-07-22 | 13F | Wealthcare Advisory Partners LLC | 44,543 | 2.53 | 845 | 3.94 | ||||
| 2025-08-12 | 13F | Financial Advocates Investment Management | 19,965 | 379 | ||||||
| 2025-08-14 | 13F | Peapack Gladstone Financial Corp | 0 | -100.00 | 0 | |||||
| 2025-07-24 | 13F | Us Bancorp \de\ | 1,600 | 0.00 | 30 | 3.45 | ||||
| 2025-05-14 | 13F | Northwestern Mutual Wealth Management Co | 0 | -100.00 | 0 | |||||
| 2025-07-24 | 13F | Gilliland Jeter Wealth Management LLC | 78,615 | -0.10 | 1,491 | 1.36 | ||||
| 2025-08-08 | 13F | Creative Planning | 138,387 | 2,625 | ||||||
| 2025-08-14 | 13F | Fmr Llc | 41 | 24.24 | 1 | |||||
| 2025-08-19 | 13F | Cape Investment Advisory, Inc. | 453 | -15.33 | 9 | -20.00 | ||||
| 2025-07-14 | 13F | Signature Securities Group Corporation | 78,578 | 1.18 | 1,491 | 2.62 | ||||
| 2025-08-14 | 13F | Benjamin Edwards Inc | 693,069 | -12.03 | 13,148 | -10.76 | ||||
| 2025-07-10 | 13F | Wealth Enhancement Advisory Services, Llc | 1,213,739 | -1.58 | 22,952 | -0.48 | ||||
| 2025-08-11 | 13F | AXS Investments LLC | 227,778 | -22.21 | 4,321 | -21.10 | ||||
| 2025-07-16 | 13F | Essex Financial Services, Inc. | 47,378 | 899 | ||||||
| 2025-08-08 | 13F | Capital Investment Advisory Services, LLC | 55,603 | -4.63 | 1,055 | -3.30 | ||||
| 2025-04-14 | 13F | Pallas Capital Advisors LLC | 0 | -100.00 | 0 | |||||
| 2025-08-14 | 13F | Susquehanna International Group, Llp | 31,705 | 2.66 | 601 | 4.16 | ||||
| 2025-07-29 | 13F | Private Trust Co Na | 6,094 | 78.50 | 116 | 82.54 | ||||
| 2025-08-11 | 13F | MainStreet Investment Advisors LLC | 131,041 | -0.68 | 2,486 | 0.73 | ||||
| 2025-07-09 | 13F | Massmutual Trust Co Fsb/adv | 129,186 | -2.92 | 2,451 | -1.53 | ||||
| 2025-07-28 | 13F | Rosenberg Matthew Hamilton | 495 | 0.00 | 9 | 0.00 | ||||
| 2025-07-25 | 13F | Cwm, Llc | 10,535 | 1.17 | 0 | |||||
| 2025-08-12 | 13F | Insigneo Advisory Services, Llc | 35,434 | 672 | ||||||
| 2025-08-04 | 13F | Assetmark, Inc | 2,390 | 45 | ||||||
| 2025-08-14 | 13F | Warren Averett Asset Management, LLC | 34,241 | -3.75 | 650 | -2.41 | ||||
| 2025-07-21 | 13F | Ameritas Advisory Services, LLC | 200 | 4 | ||||||
| 2025-08-14 | 13F | Comerica Bank | 89,256 | 5.18 | 1,693 | 6.75 | ||||
| 2025-08-05 | 13F | Huntington National Bank | 52 | 0.00 | ||||||
| 2025-08-13 | 13F | VestGen Advisors, LLC | 14,694 | 0.00 | 277 | 1.09 | ||||
| 2025-08-08 | 13F | Investment Partners, Ltd. | 99,541 | -21.56 | 1,888 | -20.44 | ||||
| 2025-08-12 | 13F | Steward Partners Investment Advisory, Llc | 2,577 | 92.31 | 49 | 92.00 | ||||
| 2025-08-14 | 13F | Stifel Financial Corp | 85,845 | -16.60 | 1,628 | -15.38 | ||||
| 2025-08-06 | 13F | SOUTH STATE Corp | 740 | 14 | ||||||
| 2025-04-14 | 13F | Griffith & Werner, Inc. | 11,029 | 0.81 | 206 | 1.48 | ||||
| 2025-08-12 | 13F | FourThought Financial Partners, LLC | 56,278 | 11.86 | 1,068 | 13.51 | ||||
| 2025-08-01 | 13F | Envestnet Asset Management Inc | 403,476 | 59.71 | 7,654 | 62.00 | ||||
| 2025-08-15 | 13F | Provenance Wealth Advisors, LLC | 8,205 | -16.25 | 156 | -15.30 | ||||
| 2025-08-12 | 13F | PSI Advisors, LLC | 0 | -100.00 | 0 | |||||
| 2025-08-27 | 13F/A | Brinker Capital Investments, LLC | 16,616 | -4.88 | 315 | -3.37 | ||||
| 2025-07-31 | 13F | Whipplewood Advisors, LLC | 19,583 | 2,697.57 | 371 | -8.85 | ||||
| 2025-08-08 | 13F | Everett Harris & Co /ca/ | 23,500 | 446 | ||||||
| 2025-08-28 | NP | SIRAX - Sierra Tactical All Asset Fund Class A | 246,100 | 4,669 | ||||||
| 2025-08-12 | 13F | LPL Financial LLC | 2,791,483 | 32.34 | 52,954 | 34.25 | ||||
| 2025-05-01 | 13F | Grant/GrossMendelsohn, LLC | 34,241 | 633 | ||||||
| 2025-07-21 | 13F | Mechanics Financial Corp | 36,694 | 23.47 | 696 | 25.41 | ||||
| 2025-08-06 | 13F | Commonwealth Equity Services, Llc | 305,236 | 1.87 | 6 | 0.00 | ||||
| 2025-07-11 | 13F | Grant Private Wealth Management Inc | 11,159 | 212 | ||||||
| 2025-08-13 | 13F | Willis Johnson & Associates, Inc. | 102,645 | -7.84 | 1,947 | -6.48 | ||||
| 2025-08-11 | 13F | Principal Securities, Inc. | 429,357 | 94.40 | 8,145 | 98.15 | ||||
| 2025-08-05 | 13F | Bank of New York Mellon Corp | 38,024 | -5.11 | 721 | -3.74 | ||||
| 2025-08-12 | 13F | Argent Trust Co | 32,096 | -20.37 | 609 | -19.26 | ||||
| 2025-08-13 | 13F | Baird Financial Group, Inc. | 292,424 | -0.49 | 5,547 | 0.95 | ||||
| 2025-08-14 | 13F | BTG Pactual Asset Management US LLC | 28,025 | 8.74 | 532 | 10.40 | ||||
| 2025-08-25 | NP | OIOIX - AXS Income Opportunities Fund Class I | 227,778 | -22.21 | 4,321 | -21.10 | ||||
| 2025-08-15 | 13F | Kestra Advisory Services, LLC | 235,944 | 45.83 | 4,476 | 47.93 | ||||
| 2025-08-14 | 13F | Main Street Financial Solutions, LLC | 11,396 | 1.17 | 216 | 2.86 | ||||
| 2025-07-17 | 13F | LexAurum Advisors, LLC | 34,488 | 22.22 | 654 | 24.10 | ||||
| 2025-07-30 | 13F | Schnieders Capital Management Llc | 36,650 | 0.00 | 695 | 1.46 | ||||
| 2025-08-12 | 13F | Laurel Wealth Advisors LLC | 3,510 | 1,797.30 | 0 | -100.00 | ||||
| 2025-08-12 | 13F | Jpmorgan Chase & Co | 77,295 | 3,031.89 | 1,466 | 3,086.96 | ||||
| 2025-07-23 | 13F | Tyche Wealth Partners LLC | 408,148 | -32.51 | 7,743 | -31.54 | ||||
| 2025-08-14 | 13F/A | Rockefeller Capital Management L.P. | 117,383 | 5.80 | 2,227 | 7.33 | ||||
| 2025-07-28 | 13F | IFC Advisors LLC | 2,819,142 | 1.49 | 53,479 | 2.96 | ||||
| 2025-07-17 | 13F | KWB Wealth | 209,390 | 3,916 | ||||||
| 2025-08-14 | 13F | Raymond James Financial Inc | 1,532,641 | -17.78 | 29,074 | -16.59 | ||||
| 2025-07-24 | 13F | Stonebridge Financial Group, LLC | 0 | -100.00 | 0 | |||||
| 2025-08-13 | 13F | Cerity Partners LLC | 78,346 | -29.69 | 1,486 | -28.66 | ||||
| 2025-08-07 | 13F | Ibex Wealth Advisors | 95,623 | 2.31 | 1,814 | 3.78 | ||||
| 2025-08-14 | 13F | Permanens Capital L.P. | 1,520,729 | 10.12 | 28,848 | 11.71 | ||||
| 2025-07-18 | 13F | Truist Financial Corp | 56,237 | 3.54 | 1,067 | 5.02 | ||||
| 2025-07-17 | 13F | XML Financial, LLC | 18,718 | 1.09 | 355 | 2.60 | ||||
| 2025-07-01 | 13F | Harbor Investment Advisory, Llc | 5,000 | 0.00 | 95 | 1.08 | ||||
| 2025-08-14 | 13F | UBS Group AG | 6,921,965 | -1.76 | 131,310 | -0.34 | ||||
| 2025-08-15 | 13F | Morgan Stanley | 6,156,993 | 0.77 | 116,798 | 2.22 | ||||
| 2025-07-18 | 13F | Rogco, Lp | 380,684 | 1.43 | 7,222 | 2.89 | ||||
| 2025-08-11 | 13F | Advisor Resource Council | 0 | -100.00 | 0 | |||||
| 2025-04-28 | 13F | Pinnacle Financial Partners Inc | 30,272 | -21.02 | 566 | -20.62 | ||||
| 2025-08-01 | 13F | Bank of Jackson Hole Trust | 10,100 | 0.00 | 192 | 1.06 | ||||
| 2025-07-08 | 13F | Ehrlich Financial Group | 16,597 | 12.76 | 315 | 14.18 | ||||
| 2025-07-22 | 13F | Berger Financial Group, Inc | 425,217 | 5.61 | 8,066 | 7.13 | ||||
| 2025-08-14 | 13F | Bnp Paribas Arbitrage, Sa | 10 | -66.67 | 0 | |||||
| 2025-08-14 | 13F | Bank Of America Corp /de/ | 10,222,023 | 10.76 | 193,912 | 12.35 | ||||
| 2025-08-14 | 13F | Capital & Planning, Llc | 38,340 | -3.64 | 727 | -2.28 | ||||
| 2025-08-14 | 13F | Smartleaf Asset Management LLC | 60,010 | -15.16 | 1,135 | -14.35 | ||||
| 2025-08-14 | 13F | Jane Street Group, Llc | 0 | -100.00 | 0 | |||||
| 2025-08-14 | 13F | Mariner, LLC | 504,757 | 31.78 | 9,575 | 33.69 | ||||
| 2025-08-11 | 13F | Resurgent Financial Advisors LLC | 10,268 | 195 | ||||||
| 2025-09-02 | 13F/A | FSC Wealth Advisors, LLC | 17,675 | 335 | ||||||
| 2025-08-12 | 13F | Boreal Capital Management LLC | 66,894 | 1,269 | ||||||
| 2025-07-09 | 13F | Fiduciary Alliance LLC | 103,095 | 18.55 | 1,956 | 20.23 | ||||
| 2025-08-14 | 13F | Wiley Bros.-aintree Capital, Llc | 94,733 | -2.05 | 1,797 | -0.72 | ||||
| 2025-07-24 | 13F | Wealth Management Resources, Inc. | 0 | -100.00 | 0 | |||||
| 2025-05-14 | 13F | Delta Investment Management, LLC | 0 | -100.00 | 0 | |||||
| 2025-08-11 | 13F | Platform Technology Partners | 19,000 | 72.73 | 360 | 75.61 | ||||
| 2025-08-14 | 13F | Wells Fargo & Company/mn | 3,250,027 | 3.66 | 61,653 | 5.15 | ||||
| 2025-08-14 | 13F | Mml Investors Services, Llc | 38,426 | 1 | ||||||
| 2025-08-05 | 13F | W.G. Shaheen & Associates DBA Whitney & Co | 16,500 | 0.00 | 313 | 1.62 | ||||
| 2025-08-12 | 13F | CIBC Private Wealth Group, LLC | 1,500 | 0.00 | 28 | 3.70 | ||||
| 2025-08-11 | 13F | Private Advisor Group, LLC | 181,787 | -14.59 | 3,449 | -13.35 | ||||
| 2025-08-08 | 13F | Emerald Investment Partners, Llc | 10,814 | 5.05 | 205 | 6.77 | ||||
| 2025-08-05 | 13F | Lifeworks Advisors, LLC | 73,375 | -3.99 | 1,392 | -2.66 | ||||
| 2025-07-14 | 13F | U.S. Capital Wealth Advisors, LLC | 36,157 | -9.97 | 686 | -8.67 | ||||
| 2025-07-21 | 13F | Cliftonlarsonallen Wealth Advisors, Llc | 43,885 | 832 | ||||||
| 2025-05-20 | 13F | Belpointe Asset Management LLC | 0 | -100.00 | 0 | -100.00 | ||||
| 2025-07-11 | 13F | Farther Finance Advisors, LLC | 915 | -93.60 | 17 | -93.61 | ||||
| 2025-08-05 | 13F | Flynn Zito Capital Management, Llc | 117,386 | -0.61 | 2,227 | 0.82 | ||||
| 2025-08-12 | 13F | Proequities, Inc. | 0 | 0 | ||||||
| 2025-08-08 | 13F | Cornerstone Advisors Asset Management, Inc | 525,948 | 9.19 | 9,977 | 11.87 | ||||
| 2025-08-12 | 13F | South Plains Financial, Inc. | 11,787 | -2.68 | 223 | -1.33 | ||||
| 2025-07-21 | 13F | Mirae Asset Global Investments Co., Ltd. | 102,829 | 58.66 | 1,951 | 60.76 | ||||
| 2025-07-11 | 13F | Pinnacle Bancorp, Inc. | 6,135 | 48.91 | 116 | 50.65 | ||||
| 2025-08-12 | 13F | Global Retirement Partners, LLC | 5 | -99.98 | 0 | -100.00 | ||||
| 2025-08-06 | 13F | Legacy Bridge, LLC | 130,360 | -4.47 | 2,473 | -3.10 | ||||
| 2025-07-28 | 13F | Axxcess Wealth Management, Llc | 13,602 | -12.00 | 258 | -10.73 | ||||
| 2025-07-29 | 13F | Activest Wealth Management | 39,474 | -0.20 | 749 | 1.22 | ||||
| 2025-05-12 | 13F | Independent Advisor Alliance | 0 | -100.00 | 0 |