Mga Batayang Estadistika
| Pemilik Institusional | 141 total, 141 long only, 0 short only, 0 long/short - change of -2.07% MRQ |
| Alokasi Portofolio Rata-rata | 0.7825 % - change of -13.16% MRQ |
| Saham Institusional (Jangka Panjang) | 66,927,129 (ex 13D/G) - change of 2.33MM shares 3.61% MRQ |
| Nilai Institusional (Jangka Panjang) | $ 1,275,932 USD ($1000) |
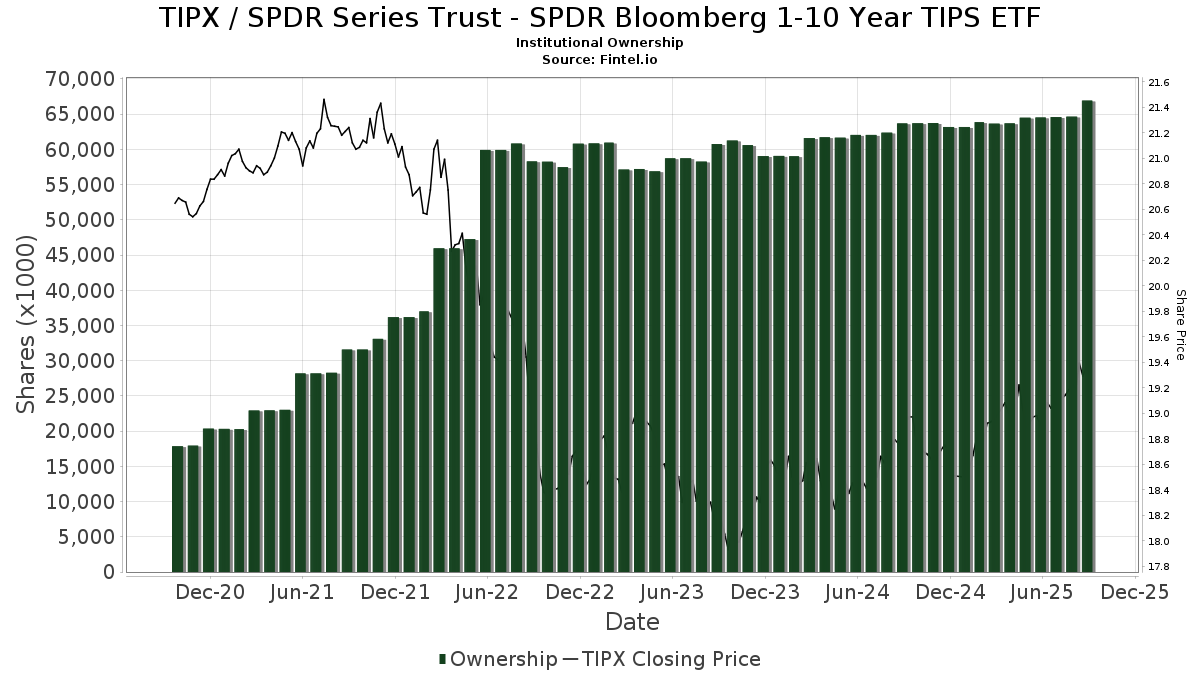
Kepemilikan Institusional dan Pemegang Saham
SPDR Series Trust - SPDR Bloomberg 1-10 Year TIPS ETF (US:TIPX) memiliki 141 pemilik institusional dan pemegang saham yang telah mengajukan formulir 13D/G atau 13F kepada Komisi Bursa Efek (Securities Exchange Commission/SEC). Lembaga-lembaga ini memegang total 66,927,129 saham. Pemegang saham terbesar meliputi State Street Corp, SSBRX - State Street Target Retirement 2025 Fund Class I, SSBWX - State Street Target Retirement 2030 Fund Class I, SSFNX - State Street Target Retirement Fund Class I, SSBNX - State Street Target Retirement 2020 Fund Class I, RLY - SPDR SSGA Multi-Asset Real Return ETF, LPL Financial LLC, SSCJX - State Street Target Retirement 2035 Fund Class I, St Germain D J Co Inc, and Brio Consultants, LLC .
Struktur kepemilikan institusional SPDR Series Trust - SPDR Bloomberg 1-10 Year TIPS ETF (ARCA:TIPX) menunjukkan posisi terkini di perusahaan oleh institusi dan dana, serta perubahan terbaru dalam ukuran posisi. Pemegang saham utama dapat mencakup investor individu, reksa dana, dana lindung nilai, atau institusi. Jadwal 13D menunjukkan bahwa investor memegang (atau pernah memegang) lebih dari 5% saham perusahaan dan bermaksud (atau pernah bermaksud) untuk secara aktif mengejar perubahan strategi bisnis. Jadwal 13G menunjukkan investasi pasif lebih dari 5%.
The share price as of September 5, 2025 is 19.35 / share. Previously, on September 6, 2024, the share price was 18.81 / share. This represents an increase of 2.87% over that period.
Skor Sentimen Dana
Skor Sentimen Dana (sebelumnya dikenal sebagai Skor Akumulasi Kepemilikan) menemukan saham-saham yang paling banyak dibeli oleh dana. Ini adalah hasil dari model kuantitatif multi-faktor yang canggih yang mengidentifikasi perusahaan dengan tingkat akumulasi institusional tertinggi. Model penilaian menggunakan kombinasi dari total peningkatan pemilik yang diungkapkan, perubahan dalam alokasi portofolio pada pemilik tersebut, dan metrik lainnya. Angka berkisar dari 0 hingga 100, dengan angka yang lebih tinggi menunjukkan tingkat akumulasi yang lebih tinggi dibandingkan dengan perusahaan sejenisnya, dan 50 adalah rata-ratanya.
Frekuensi Pembaruan: Setiap Hari
Lihat Ownership Explorer, yang menyediakan daftar perusahaan dengan peringkat tertinggi.
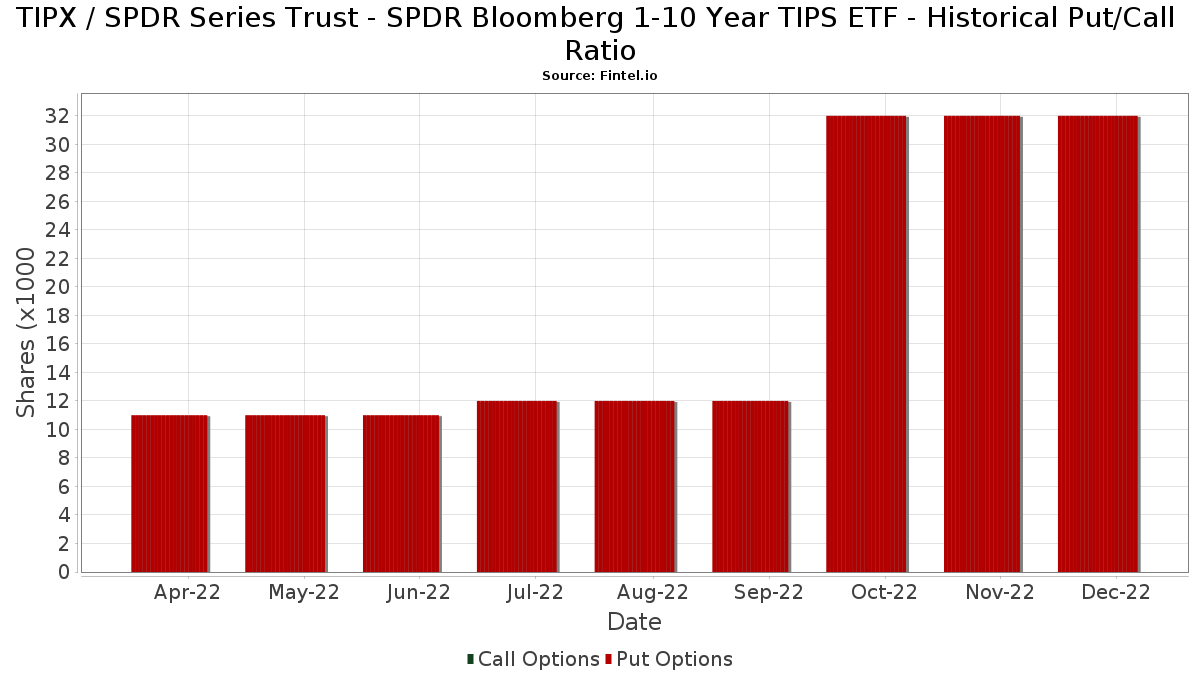
Rasio Put/Call Institusional
Selain melaporkan isu ekuitas dan utang standar, institusi dengan aset di bawah manajemen lebih dari 100 juta dolar AS juga harus mengungkapkan kepemilikan opsi put dan call mereka. Karena opsi put umumnya menunjukkan sentimen negatif, dan opsi call menunjukkan sentimen positif, kita dapat mengetahui sentimen institusional secara keseluruhan dengan memplot rasio put terhadap call. Grafik di sebelah kanan memplot rasio put/call historis untuk instrumen ini.
Menggunakan Rasio Put/Call sebagai indikator sentimen investor mengatasi salah satu kekurangan utama dari penggunaan total kepemilikan institusional, yaitu sejumlah besar aset yang dikelola diinvestasikan secara pasif untuk melacak indeks. Dana yang dikelola secara pasif biasanya tidak membeli opsi, sehingga indikator rasio put/call lebih akurat dalam melacak sentimen dana yang dikelola secara aktif.
Pengajuan 13D/G
Kami menyajikan pengajuan 13D/G secara terpisah dari pengajuan 13F karena perlakuan yang berbeda oleh SEC. Pengajuan 13D/G dapat diajukan oleh kelompok investor (dengan satu pemimpin), sedangkan pengajuan 13F tidak bisa. Hal ini mengakibatkan situasi di mana seorang investor dapat mengajukan 13D/G yang melaporkan satu nilai untuk total saham (mewakili semua saham yang dimiliki oleh kelompok investor), tetapi kemudian mengajukan 13F yang melaporkan nilai yang berbeda untuk total saham (mewakili kepemilikan mereka sendiri). Ini berarti bahwa kepemilikan saham dari pengajuan 13D/G dan pengajuan 13F seringkali tidak dapat dibandingkan secara langsung, sehingga kami menyajikannya secara terpisah.
Catatan: Mulai 16 Mei 2021, kami tidak lagi menampilkan pemilik yang belum mengajukan 13D/G dalam setahun terakhir. Sebelumnya, kami menampilkan riwayat lengkap pengajuan 13D/G. Secara umum, entitas yang diwajibkan untuk mengajukan pengajuan 13D/G harus mengajukan setidaknya setiap tahun sebelum mengirimkan pengajuan penutupan. Namun, terkadang dana keluar dari posisi tanpa mengirimkan pengajuan penutupan (misalnya, mereka menghentikan operasi), sehingga menampilkan riwayat lengkap terkadang menyebabkan kebingungan tentang kepemilikan saat ini. Untuk mencegah kebingungan, kami sekarang hanya menampilkan pemilik 'saat ini' - yaitu - pemilik yang telah mengajukan dalam setahun terakhir.
Upgrade to unlock premium data.
| Tanggal File | Formulir | Investor | Sebelumnya Saham |
Terbaru Saham |
Δ Saham (Persen) |
Kepemilikan (Persen) |
Δ Pagmamay-ari (Persen) |
|
|---|---|---|---|---|---|---|---|---|
| 2025-06-05 | TRUIST FINANCIAL CORP | 49,574 | 51,815 | 4.52 | 0.10 | -99.85 |
Pengajuan 13F dan NPORT
Detail pada pengajuan 13F tersedia gratis. Detail pada pengajuan NP memerlukan keanggotaan premium. Baris berwarna hijau menunjukkan posisi baru. Baris berwarna merah menunjukkan posisi yang sudah ditutup. Klik tautan ini ikon untuk melihat riwayat transaksi selengkapnya.
Tingkatkan
untuk membuka data premium dan mengekspor ke Excel ![]() .
.
| Tanggal File | Sumber | Investor | Ketik | Presyo ng Avg (Silangan) |
Saham | Δ Saham (%) |
Dilaporkan Nilai ($1000) |
Nilai Δ (%) |
Alokasi Port (%) |
|
|---|---|---|---|---|---|---|---|---|---|---|
| 2025-07-14 | 13F | Park Avenue Securities Llc | 122,594 | -4.11 | 2 | 0.00 | ||||
| 2025-08-11 | 13F | Western Wealth Management, LLC | 10,922 | 7.54 | 209 | 7.73 | ||||
| 2025-08-13 | 13F/A | StoneX Group Inc. | 0 | -100.00 | 0 | -100.00 | ||||
| 2025-07-17 | 13F | Raleigh Capital Management Inc. | 103,433 | 7.02 | 1,980 | 6.74 | ||||
| 2025-08-08 | 13F | Foundations Investment Advisors, LLC | 60,993 | -15.40 | 1,167 | -15.62 | ||||
| 2025-07-24 | 13F | Comprehensive Money Management Services LLC | 32,987 | -8.21 | 631 | -8.42 | ||||
| 2025-08-14 | 13F | Smartleaf Asset Management LLC | 570 | 0.00 | 11 | 0.00 | ||||
| 2025-05-09 | 13F | CoreCap Advisors, LLC | 0 | -100.00 | 0 | |||||
| 2025-08-13 | 13F | GeoWealth Management, LLC | 135,340 | -54.92 | 2,590 | -55.04 | ||||
| 2025-08-28 | NP | SSBRX - State Street Target Retirement 2025 Fund Class I This fund is a listed as child fund of State Street Corp and if that institution has disclosed ownership in this security, then these positions will not be double counted when calculating total shares and total value | 18,363,152 | 0.88 | 351,471 | 0.62 | ||||
| 2025-07-29 | 13F | Elevation Capital Advisory, LLC | 378,409 | 21.86 | 7,243 | 21.53 | ||||
| 2025-08-04 | 13F | Integrity Alliance, Llc. | 93,772 | 1,795 | ||||||
| 2025-05-28 | NP | SSBNX - State Street Target Retirement 2020 Fund Class I This fund is a listed as child fund of State Street Corp and if that institution has disclosed ownership in this security, then these positions will not be double counted when calculating total shares and total value | 7,522,698 | -14.27 | 144,361 | -11.02 | ||||
| 2025-08-12 | 13F | Proequities, Inc. | 0 | 0 | ||||||
| 2025-08-15 | 13F | Morgan Stanley | 130,121 | -1.49 | 2,491 | -1.74 | ||||
| 2025-08-04 | 13F | Creative Financial Designs Inc /adv | 17,747 | 69.10 | 340 | 68.66 | ||||
| 2025-08-12 | 13F | Richard W. Paul & Associates, LLC | 65 | 0.00 | 1 | 0.00 | ||||
| 2025-08-14 | 13F | Treasure Coast Financial Planning | 452,126 | 3.68 | 8,654 | 3.41 | ||||
| 2025-06-12 | 13F/A | Deutsche Bank Ag\ | 0 | -100.00 | 0 | |||||
| 2025-07-22 | 13F | Simplicity Wealth,LLC | 68,046 | 209.45 | 1,302 | 209.26 | ||||
| 2025-07-28 | 13F | Axxcess Wealth Management, Llc | 43,970 | -0.34 | 842 | -0.59 | ||||
| 2025-08-14 | 13F | Qube Research & Technologies Ltd | 207 | -87.16 | 4 | -90.00 | ||||
| 2025-07-10 | 13F | Sharkey, Howes & Javer | 77,539 | -9.42 | 1,484 | -9.62 | ||||
| 2025-07-30 | 13F | Brookstone Capital Management | 57,134 | 0.68 | 1,094 | 0.37 | ||||
| 2025-08-11 | 13F | Pinnacle Wealth Planning Services, Inc. | 230,884 | 2.52 | 4,419 | 2.27 | ||||
| 2025-07-24 | 13F | Blair William & Co/il | 535 | 494.44 | 10 | 900.00 | ||||
| 2025-08-14 | 13F | Novus Advisors, Llc | 29,569 | -4.60 | 566 | -4.88 | ||||
| 2025-05-14 | 13F | Rockefeller Capital Management L.P. | 0 | -100.00 | 0 | |||||
| 2025-08-01 | 13F | Austin Private Wealth, LLC | 188,963 | 70.08 | 3,617 | 69.61 | ||||
| 2025-08-28 | NP | SSFNX - State Street Target Retirement Fund Class I This fund is a listed as child fund of State Street Corp and if that institution has disclosed ownership in this security, then these positions will not be double counted when calculating total shares and total value | 14,177,760 | 1.20 | 271,362 | 0.93 | ||||
| 2025-08-14 | 13F | Wells Fargo & Company/mn | 21,755 | 529.85 | 416 | 530.30 | ||||
| 2025-07-09 | 13F | Capital Wealth Management, Llc | 43,360 | -8.55 | 830 | -8.80 | ||||
| 2025-08-06 | 13F | Golden State Wealth Management, LLC | 1,534 | -13.63 | 29 | -14.71 | ||||
| 2025-04-15 | 13F | Kelly Financial Services LLC | 0 | -100.00 | 0 | |||||
| 2025-08-12 | 13F | Argent Trust Co | 16,203 | -2.12 | 310 | -2.21 | ||||
| 2025-07-25 | 13F | Envestnet Portfolio Solutions, Inc. | 637,279 | 7.33 | 12,198 | 7.05 | ||||
| 2025-07-23 | 13F | Valmark Advisers, Inc. | 23,870 | -11.46 | 457 | -11.80 | ||||
| 2025-05-14 | 13F | Mml Investors Services, Llc | 0 | -100.00 | 0 | |||||
| 2025-07-28 | 13F | Mutual Advisors, LLC | 142,126 | 84.68 | 2,717 | 84.83 | ||||
| 2025-07-21 | 13F | Ameritas Advisory Services, LLC | 20 | 0 | ||||||
| 2025-07-25 | 13F | McNamara Financial Services, Inc. | 64,444 | 0.84 | 1,233 | 0.57 | ||||
| 2025-08-14 | 13F | Jane Street Group, Llc | 0 | -100.00 | 0 | |||||
| 2025-07-17 | 13F | PMG Wealth Management, Inc. | 13,227 | -29.58 | 252 | -29.61 | ||||
| 2025-07-31 | 13F | Cambridge Investment Research Advisors, Inc. | 109,463 | 0.75 | 2 | 0.00 | ||||
| 2025-08-11 | 13F | Strategic Wealth Partners, Ltd. | 748 | 14 | ||||||
| 2025-07-16 | 13F | St Germain D J Co Inc | 1,230,322 | 6.16 | 23,548 | 5.89 | ||||
| 2025-07-28 | 13F | RFG Advisory, LLC | 23,101 | 4.83 | 442 | 4.74 | ||||
| 2025-07-29 | 13F | Private Trust Co Na | 322 | -0.62 | 6 | 0.00 | ||||
| 2025-08-14 | 13F | Napa Wealth Management | 0 | -100.00 | 0 | |||||
| 2025-08-05 | 13F | Lifeworks Advisors, LLC | 20,120 | -0.34 | 385 | -0.52 | ||||
| 2025-08-14 | 13F | Raymond James Financial Inc | 83,507 | 6.70 | 1,598 | 6.46 | ||||
| 2025-07-09 | 13F | Alesco Advisors Llc | 318,981 | -1.06 | 6,105 | -1.31 | ||||
| 2025-07-15 | 13F | Revisor Wealth Management LLC | 18,887 | -12.73 | 360 | -13.49 | ||||
| 2025-08-08 | 13F | Gts Securities Llc | 0 | -100.00 | 0 | |||||
| 2025-07-14 | 13F | Iams Wealth Management, Llc | 10,450 | 200 | ||||||
| 2025-08-07 | 13F | Brio Consultants, LLC | 864,922 | 3.53 | 16,555 | 3.26 | ||||
| 2025-08-08 | 13F | Hibernia Wealth Partners, LLC | 175,092 | 93.57 | 3,351 | 93.14 | ||||
| 2025-08-14 | 13F | UBS Group AG | 158,785 | -77.45 | 3,039 | -77.50 | ||||
| 2025-08-04 | 13F | Assetmark, Inc | 330,620 | -0.79 | 6,328 | -1.05 | ||||
| 2025-07-09 | 13F | Fermata Advisors, LLC | 47,164 | -86.21 | 903 | -86.26 | ||||
| 2025-08-28 | NP | SSBWX - State Street Target Retirement 2030 Fund Class I This fund is a listed as child fund of State Street Corp and if that institution has disclosed ownership in this security, then these positions will not be double counted when calculating total shares and total value | 17,640,984 | 10.20 | 337,648 | 9.92 | ||||
| 2025-08-05 | 13F | Sigma Planning Corp | 11,497 | 220 | ||||||
| 2025-08-11 | 13F | Citigroup Inc | 5,598 | 9.06 | 107 | 9.18 | ||||
| 2025-08-12 | 13F | SRS Capital Advisors, Inc. | 0 | -100.00 | 0 | |||||
| 2025-07-22 | 13F | Foguth Wealth Management, LLC. | 0 | -100.00 | 0 | |||||
| 2025-07-25 | 13F | NorthRock Partners, LLC | 0 | -100.00 | 0 | |||||
| 2025-08-05 | 13F | Landmark Wealth Management, Inc. | 50,504 | 13.00 | 967 | 12.72 | ||||
| 2025-08-14 | 13F | Goldman Sachs Group Inc | 745,340 | 1.87 | 14,266 | 1.60 | ||||
| 2025-08-11 | 13F | Tidemark, LLC | 79 | -66.53 | 2 | -75.00 | ||||
| 2025-05-15 | 13F/A | Orion Portfolio Solutions, LLC | 16,216 | 10.83 | 311 | 15.19 | ||||
| 2025-07-18 | 13F | Truist Financial Corp | 51,969 | 4.84 | 995 | 4.52 | ||||
| 2025-08-07 | 13F | Allworth Financial LP | 5,286 | -28.47 | 101 | -28.37 | ||||
| 2025-07-29 | 13F | Balboa Wealth Partners | 18,503 | 4.83 | 354 | 4.73 | ||||
| 2025-08-06 | 13F | AE Wealth Management LLC | 13,759 | 1.91 | 263 | 1.54 | ||||
| 2025-05-12 | 13F | Founders Financial Alliance, LLC | 0 | -100.00 | 0 | |||||
| 2025-08-11 | 13F | HighTower Advisors, LLC | 77,465 | 10.05 | 1,483 | 9.78 | ||||
| 2025-08-11 | 13F | Covestor Ltd | 20 | 0.00 | 0 | |||||
| 2025-04-23 | 13F | Mascagni Wealth Management, Inc. | 0 | -100.00 | 0 | -100.00 | ||||
| 2025-08-15 | 13F | Equitable Holdings, Inc. | 74,525 | 91.61 | 1,426 | 91.15 | ||||
| 2025-07-23 | 13F | WestEnd Advisors, LLC | 9 | 0 | ||||||
| 2025-09-04 | 13F/A | Advisor Group Holdings, Inc. | 82,534 | 407.28 | 1,582 | 407.05 | ||||
| 2025-08-08 | 13F | Avantax Advisory Services, Inc. | 10,308 | 197 | ||||||
| 2025-07-10 | 13F | Security National Bank | 600,823 | -4.58 | 11,500 | -4.83 | ||||
| 2025-07-11 | 13F | SILVER OAK SECURITIES, Inc | 0 | -100.00 | 0 | |||||
| 2025-08-12 | 13F | CIBC Private Wealth Group, LLC | 0 | 0 | ||||||
| 2025-08-14 | 13F | Bank Of America Corp /de/ | 236,548 | -75.90 | 4,528 | -75.96 | ||||
| 2025-07-23 | 13F | Detalus Advisors, LLC | 17,912 | 343 | ||||||
| 2025-07-18 | 13F | Lynx Investment Advisory | 47,728 | 4.77 | 914 | 4.46 | ||||
| 2025-07-15 | 13F | Retireful, LLC | 0 | -100.00 | 0 | |||||
| 2025-07-15 | 13F | Sheets Smith Wealth Management | 0 | -100.00 | 0 | |||||
| 2025-07-24 | 13F | IFP Advisors, Inc | 3,800 | -33.68 | 73 | -33.94 | ||||
| 2025-05-01 | 13F | Quest 10 Wealth Builders, Inc. | 0 | -100.00 | 0 | |||||
| 2025-07-15 | 13F | Optima Capital Llc | 67,240 | 34.51 | 1,287 | 34.10 | ||||
| 2025-08-14 | 13F | Redwood Financial Network Corp | 33,824 | -0.19 | 647 | -0.46 | ||||
| 2025-08-06 | 13F | Paladin Advisory Group, LLC | 8,386 | 0.00 | 161 | 0.00 | ||||
| 2025-08-12 | 13F | Jpmorgan Chase & Co | 74,798 | 0.22 | 1,432 | -0.07 | ||||
| 2025-08-14 | 13F | Citadel Advisors Llc | 0 | -100.00 | 0 | |||||
| 2025-08-14 | 13F | Comerica Bank | 23,708 | -3.97 | 454 | -4.23 | ||||
| 2025-04-21 | 13F | Nelson, Van Denburg & Campbell Wealth Management Group, LLC | 0 | -100.00 | 0 | |||||
| 2025-08-11 | 13F | Private Advisor Group, LLC | 21,743 | -31.10 | 416 | -31.24 | ||||
| 2025-08-07 | 13F | AllGen Financial Advisors, Inc. | 502,279 | 9,614 | ||||||
| 2025-04-22 | 13F | Castleview Partners, Llc | 0 | -100.00 | 0 | |||||
| 2025-08-22 | NP | Variable Insurance Products Fund V - Target Volatility Portfolio Service Class | 59,925 | 0.00 | 1,147 | -0.26 | ||||
| 2025-07-16 | 13F | Maridea Wealth Management LLC | 37,067 | 0.27 | 709 | 0.00 | ||||
| 2025-07-09 | 13F | Pallas Capital Advisors LLC | 20,026 | -14.51 | 383 | -14.70 | ||||
| 2025-07-24 | 13F | Game Plan Financial Advisors, LLC | 0 | -100.00 | 0 | |||||
| 2025-08-28 | NP | GAL - SPDR SSGA Global Allocation ETF This fund is a listed as child fund of State Street Corp and if that institution has disclosed ownership in this security, then these positions will not be double counted when calculating total shares and total value | 539,336 | 5.01 | 10,323 | 4.74 | ||||
| 2025-07-08 | 13F | Nbc Securities, Inc. | 380 | 0.00 | 0 | |||||
| 2025-08-27 | 13F/A | Brinker Capital Investments, LLC | 25,066 | 54.58 | 480 | 54.02 | ||||
| 2025-07-09 | 13F | Breakwater Capital Group | 27,242 | 80.88 | 521 | 80.28 | ||||
| 2025-08-11 | 13F | Principal Securities, Inc. | 1,526 | 16.31 | 29 | 20.83 | ||||
| 2025-07-18 | 13F | Lockerman Financial Group, Inc. | 16,999 | 8.50 | 325 | 8.33 | ||||
| 2025-07-10 | 13F | Sovran Advisors, LLC | 200,289 | -3.91 | 3,807 | -3.86 | ||||
| 2025-07-11 | 13F | Farther Finance Advisors, LLC | 60,409 | -8.84 | 1,156 | -8.62 | ||||
| 2025-08-13 | 13F | Capital Analysts, Inc. | 3,518 | 0.00 | 0 | |||||
| 2025-08-13 | 13F | Jones Financial Companies Lllp | 1,556 | 0.00 | 30 | 0.00 | ||||
| 2025-07-22 | 13F | Coastal Investment Advisors, Inc. | 0 | -100.00 | 0 | |||||
| 2025-07-28 | 13F | Harbour Investments, Inc. | 24,886 | 12.92 | 476 | 12.80 | ||||
| 2025-08-12 | 13F | Global Retirement Partners, LLC | 19,402 | -57.30 | 371 | -55.83 | ||||
| 2025-08-08 | 13F | Cetera Investment Advisers | 126,654 | 6.25 | 2,424 | 5.99 | ||||
| 2025-07-25 | 13F | Cwm, Llc | 1,797 | 0.73 | 0 | |||||
| 2025-08-27 | NP | RLY - SPDR SSGA Multi-Asset Real Return ETF This fund is a listed as child fund of State Street Corp and if that institution has disclosed ownership in this security, then these positions will not be double counted when calculating total shares and total value | 2,835,147 | 29.92 | 54,265 | 29.58 | ||||
| 2025-07-10 | 13F | Global Financial Private Client, LLC | 0 | -100.00 | 0 | |||||
| 2025-08-12 | 13F | LPL Financial LLC | 2,358,568 | 2.01 | 45,143 | 1.74 | ||||
| 2025-07-07 | 13F | Accelerate Investment Advisors LLC | 13,030 | -1.21 | 249 | -1.58 | ||||
| 2025-08-14 | 13F | State Street Corp | 51,951,485 | 5.97 | 994,351 | 5.70 | ||||
| 2025-07-10 | 13F | Signal Advisors Wealth, LLC | 31,169 | -41.82 | 597 | -42.02 | ||||
| 2025-08-12 | 13F | 17 Capital Partners, Llc | 0 | -100.00 | 0 | |||||
| 2025-08-13 | 13F | Beacon Pointe Advisors, LLC | 44,537 | -6.56 | 852 | -6.78 | ||||
| 2025-08-13 | 13F | Continuum Advisory, LLC | 307,908 | 7.59 | 5,893 | 7.32 | ||||
| 2025-07-08 | 13F | Parallel Advisors, LLC | 22 | -98.63 | 0 | -100.00 | ||||
| 2025-04-28 | 13F | Clear Creek Financial Management, LLC | 0 | -100.00 | 0 | |||||
| 2025-08-14 | 13F | Manufacturers Life Insurance Company, The | 98,000 | 0.00 | 1,876 | -0.27 | ||||
| 2025-08-14 | 13F | Mariner, LLC | 0 | -100.00 | 0 | |||||
| 2025-08-15 | 13F | Fsb Premier Wealth Management, Inc. | 17,376 | -0.33 | 333 | -0.60 | ||||
| 2025-08-14 | 13F | Bnp Paribas Arbitrage, Sa | 8 | -86.21 | 0 | -100.00 | ||||
| 2025-07-09 | 13F | Blodgett Wealth Advisors, Llc | 16,022 | -1.16 | 307 | -1.61 | ||||
| 2025-07-10 | 13F | Wealth Enhancement Advisory Services, Llc | 12,592 | -17.36 | 240 | -18.15 | ||||
| 2025-08-07 | 13F | Montag A & Associates Inc | 1,748 | 0.00 | 33 | 0.00 | ||||
| 2025-08-05 | 13F | Dunhill Financial, LLC | 1 | 0 | ||||||
| 2025-05-12 | 13F | Aveo Capital Partners, LLC | 0 | -100.00 | 0 | -100.00 | ||||
| 2025-08-18 | 13F/A | National Bank Of Canada /fi/ | 140 | 3 | ||||||
| 2025-07-08 | 13F | Canandaigua National Bank & Trust Co | 13,950 | 0.00 | 267 | 0.00 | ||||
| 2025-08-06 | 13F | Commonwealth Equity Services, Llc | 10,799 | -2.54 | 0 | |||||
| 2025-08-14 | 13F | Fmr Llc | 67,495 | 1.49 | 1,292 | 1.18 | ||||
| 2025-07-29 | 13F | Stratos Wealth Partners, LTD. | 132,833 | -82.49 | 2,542 | -82.53 | ||||
| 2025-08-01 | 13F | Envestnet Asset Management Inc | 693,995 | 3.71 | 13,283 | 3.44 | ||||
| 2025-08-14 | 13F | Stifel Financial Corp | 98,882 | 251.31 | 1,893 | 250.37 | ||||
| 2025-07-14 | 13F | Sowell Financial Services LLC | 10,843 | 2.25 | 208 | 1.97 | ||||
| 2025-07-22 | 13F | Aspire Private Capital, LLC | 295,468 | 2.68 | 5,655 | 2.41 | ||||
| 2025-08-12 | 13F | Running Point Capital Advisors, LLC | 6,209 | 23.05 | 119 | 22.92 | ||||
| 2025-05-12 | 13F | Meridian Wealth Management, LLC | 0 | -100.00 | 0 | |||||
| 2025-07-07 | 13F | Global Wealth Strategies & Associates | 0 | -100.00 | 0 | |||||
| 2025-04-23 | 13F | VisionPoint Advisory Group, LLC | 0 | -100.00 | 0 | |||||
| 2025-08-12 | 13F | Change Path, LLC | 39,604 | 9.18 | 758 | 8.91 | ||||
| 2025-07-25 | 13F | Richardson Financial Services Inc. | 9,074 | -16.20 | 173 | -16.91 | ||||
| 2025-08-07 | 13F | Efficient Advisors, LLC | 210,632 | -11.39 | 4,031 | -11.62 | ||||
| 2025-08-14 | 13F | Royal Bank Of Canada | 26,116 | -0.46 | 500 | -0.79 | ||||
| 2025-04-23 | 13F | Walkner Condon Financial Advisors LLC | 0 | -100.00 | 0 | |||||
| 2025-08-14 | 13F | Susquehanna International Group, Llp | 32,491 | -42.44 | 622 | -42.66 | ||||
| 2025-08-14 | 13F | GWM Advisors LLC | 157,151 | 3.90 | 3,008 | 3.62 | ||||
| 2025-08-15 | 13F | Kestra Advisory Services, LLC | 41,999 | 0.66 | 804 | 0.38 | ||||
| 2025-07-22 | 13F | Merit Financial Group, LLC | 40,878 | 62.80 | 782 | 62.58 | ||||
| 2025-08-13 | 13F | Flow Traders U.s. Llc | 10,976 | 0 | ||||||
| 2025-08-08 | 13F | Pnc Financial Services Group, Inc. | 10,357 | 62.92 | 198 | 63.64 | ||||
| 2025-08-11 | 13F | Wbi Investments, Inc. | 78,813 | -6.62 | 1,508 | -6.86 | ||||
| 2025-08-28 | NP | SSCJX - State Street Target Retirement 2035 Fund Class I This fund is a listed as child fund of State Street Corp and if that institution has disclosed ownership in this security, then these positions will not be double counted when calculating total shares and total value | 1,711,997 | 113.27 | 32,768 | 112.72 | ||||
| 2025-08-11 | 13F | Aptus Capital Advisors, LLC | 355 | 0.00 | 7 | 0.00 | ||||
| 2025-08-13 | 13F | Transce3nd, LLC | 470 | 410.87 | 9 | 700.00 | ||||
| 2025-08-01 | 13F | Rossby Financial, LCC | 141 | 0.00 | 3 | 0.00 | ||||
| 2025-07-15 | 13F | Main Street Group, LTD | 12,574 | 0.00 | 241 | -0.41 | ||||
| 2025-05-28 | NP | MFUL - Mindful Conservative ETF | 28,957 | -61.65 | 556 | -61.19 | ||||
| 2025-08-11 | 13F | TD Waterhouse Canada Inc. | 1,419 | 0.00 | 27 | 0.00 | ||||
| 2025-08-13 | 13F | Safe Harbor Fiduciary, LLC | 99 | 11.24 | 2 | 0.00 | ||||
| 2025-08-14 | 13F | Modern Wealth Management, LLC | 20,572 | 394 |