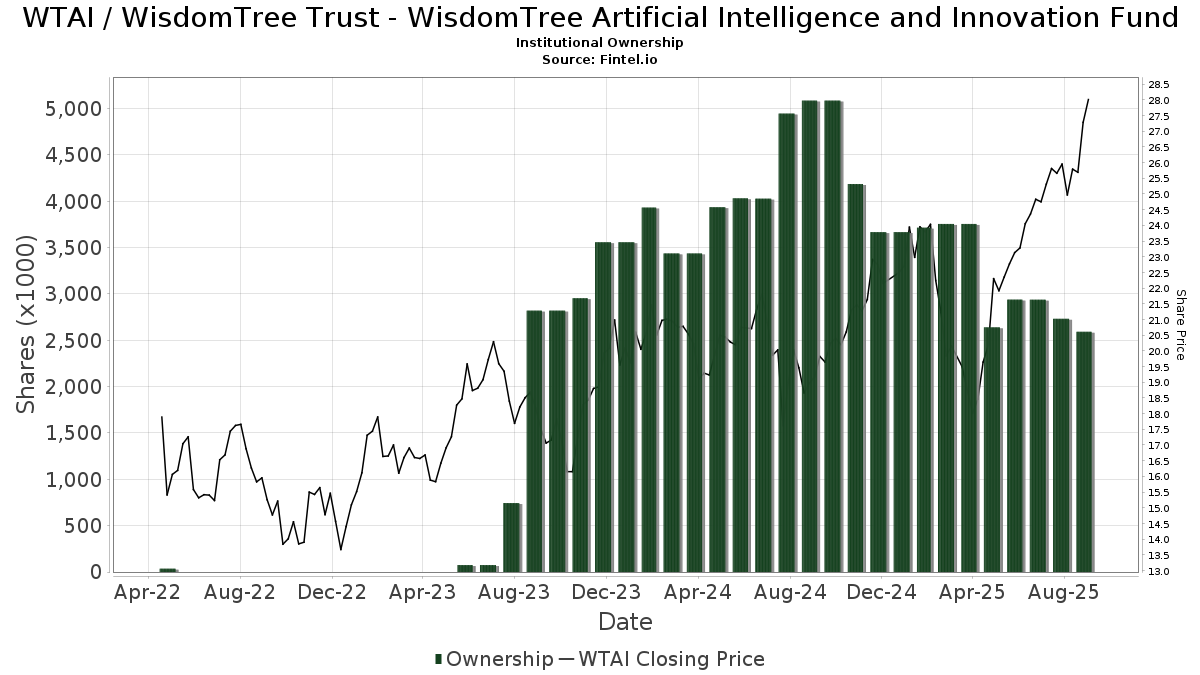
Mga Batayang Estadistika
| Pemilik Institusional | 93 total, 93 long only, 0 short only, 0 long/short - change of 0.00% MRQ |
| Alokasi Portofolio Rata-rata | 0.0346 % - change of -23.63% MRQ |
| Saham Institusional (Jangka Panjang) | 2,592,589 (ex 13D/G) - change of -0.35MM shares -11.81% MRQ |
| Nilai Institusional (Jangka Panjang) | $ 60,402 USD ($1000) |
Kepemilikan Institusional dan Pemegang Saham
WisdomTree Trust - WisdomTree Artificial Intelligence and Innovation Fund (US:WTAI) memiliki 93 pemilik institusional dan pemegang saham yang telah mengajukan formulir 13D/G atau 13F kepada Komisi Bursa Efek (Securities Exchange Commission/SEC). Lembaga-lembaga ini memegang total 2,592,589 saham. Pemegang saham terbesar meliputi LPL Financial LLC, Advisory Services Network, LLC, Kestra Advisory Services, LLC, Bank Of America Corp /de/, Raymond James Financial Inc, Prospera Financial Services Inc, Truist Financial Corp, Advisor Group Holdings, Inc., AdvisorNet Financial, Inc, and Rockefeller Capital Management L.P. .
Struktur kepemilikan institusional WisdomTree Trust - WisdomTree Artificial Intelligence and Innovation Fund (BATS:WTAI) menunjukkan posisi terkini di perusahaan oleh institusi dan dana, serta perubahan terbaru dalam ukuran posisi. Pemegang saham utama dapat mencakup investor individu, reksa dana, dana lindung nilai, atau institusi. Jadwal 13D menunjukkan bahwa investor memegang (atau pernah memegang) lebih dari 5% saham perusahaan dan bermaksud (atau pernah bermaksud) untuk secara aktif mengejar perubahan strategi bisnis. Jadwal 13G menunjukkan investasi pasif lebih dari 5%.
The share price as of September 5, 2025 is 26.36 / share. Previously, on September 9, 2024, the share price was 18.47 / share. This represents an increase of 42.72% over that period.
Skor Sentimen Dana
Skor Sentimen Dana (sebelumnya dikenal sebagai Skor Akumulasi Kepemilikan) menemukan saham-saham yang paling banyak dibeli oleh dana. Ini adalah hasil dari model kuantitatif multi-faktor yang canggih yang mengidentifikasi perusahaan dengan tingkat akumulasi institusional tertinggi. Model penilaian menggunakan kombinasi dari total peningkatan pemilik yang diungkapkan, perubahan dalam alokasi portofolio pada pemilik tersebut, dan metrik lainnya. Angka berkisar dari 0 hingga 100, dengan angka yang lebih tinggi menunjukkan tingkat akumulasi yang lebih tinggi dibandingkan dengan perusahaan sejenisnya, dan 50 adalah rata-ratanya.
Frekuensi Pembaruan: Setiap Hari
Lihat Ownership Explorer, yang menyediakan daftar perusahaan dengan peringkat tertinggi.
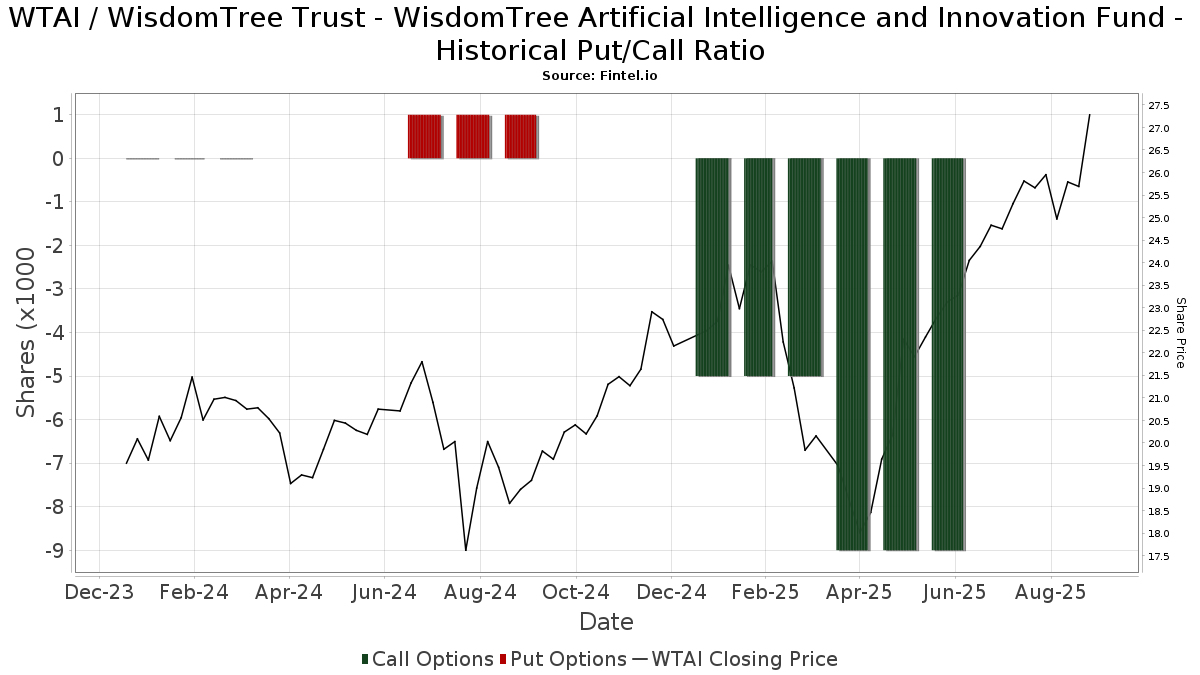
Rasio Put/Call Institusional
Selain melaporkan isu ekuitas dan utang standar, institusi dengan aset di bawah manajemen lebih dari 100 juta dolar AS juga harus mengungkapkan kepemilikan opsi put dan call mereka. Karena opsi put umumnya menunjukkan sentimen negatif, dan opsi call menunjukkan sentimen positif, kita dapat mengetahui sentimen institusional secara keseluruhan dengan memplot rasio put terhadap call. Grafik di sebelah kanan memplot rasio put/call historis untuk instrumen ini.
Menggunakan Rasio Put/Call sebagai indikator sentimen investor mengatasi salah satu kekurangan utama dari penggunaan total kepemilikan institusional, yaitu sejumlah besar aset yang dikelola diinvestasikan secara pasif untuk melacak indeks. Dana yang dikelola secara pasif biasanya tidak membeli opsi, sehingga indikator rasio put/call lebih akurat dalam melacak sentimen dana yang dikelola secara aktif.
Pengajuan 13F dan NPORT
Detail pada pengajuan 13F tersedia gratis. Detail pada pengajuan NP memerlukan keanggotaan premium. Baris berwarna hijau menunjukkan posisi baru. Baris berwarna merah menunjukkan posisi yang sudah ditutup. Klik tautan ini ikon untuk melihat riwayat transaksi selengkapnya.
Tingkatkan
untuk membuka data premium dan mengekspor ke Excel ![]() .
.
| Tanggal File | Sumber | Investor | Ketik | Presyo ng Avg (Silangan) |
Saham | Δ Saham (%) |
Dilaporkan Nilai ($1000) |
Nilai Δ (%) |
Alokasi Port (%) |
|
|---|---|---|---|---|---|---|---|---|---|---|
| 2025-08-14 | 13F | Mml Investors Services, Llc | 22,151 | 17.08 | 1 | |||||
| 2025-08-12 | 13F | Integrated Advisors Network LLC | 21,571 | 7.64 | 530 | 39.21 | ||||
| 2025-04-21 | 13F | PSI Advisors, LLC | 0 | -100.00 | 0 | |||||
| 2025-07-31 | 13F | Waldron Private Wealth LLC | 15,175 | 37.95 | 373 | 77.99 | ||||
| 2025-08-14 | 13F/A | Barclays Plc | 4,000 | 0.00 | 0 | |||||
| 2025-08-01 | 13F | First Command Advisory Services, Inc. | 2,000 | 0.00 | 49 | 28.95 | ||||
| 2025-08-07 | 13F | Allworth Financial LP | 4,089 | 0.00 | 100 | 28.21 | ||||
| 2025-07-15 | 13F | Armis Advisers, LLC | 27,477 | -1.80 | 675 | 26.93 | ||||
| 2025-08-14 | 13F | Susquehanna International Group, Llp | Call | 9,800 | 241 | |||||
| 2025-08-14 | 13F | Susquehanna International Group, Llp | 42,994 | 11.85 | 1,056 | 44.52 | ||||
| 2025-04-30 | 13F | MeadowBrook Investment Advisors LLC | 0 | -100.00 | 0 | |||||
| 2025-08-14 | 13F | Guardian Wealth Advisors, Llc / Nc | 112 | 3 | ||||||
| 2025-08-15 | 13F | Morgan Stanley | 5,187 | 289.12 | 127 | 408.00 | ||||
| 2025-07-21 | 13F | Ameritas Advisory Services, LLC | 30 | 1 | ||||||
| 2025-09-04 | 13F/A | Advisor Group Holdings, Inc. | 80,182 | 121.30 | 1,969 | 186.19 | ||||
| 2025-08-13 | 13F | Lido Advisors, LLC | 9,358 | 230 | ||||||
| 2025-08-14 | 13F | Raymond James Financial Inc | 129,017 | -24.97 | 3,169 | -3.03 | ||||
| 2025-08-14 | 13F | Wells Fargo & Company/mn | 0 | -100.00 | 0 | |||||
| 2025-07-07 | 13F | Wealth Alliance Advisory Group, LLC | 0 | -100.00 | 0 | |||||
| 2025-08-12 | 13F | CIBC Private Wealth Group, LLC | 1,555 | 0.00 | 38 | 52.00 | ||||
| 2025-08-14 | 13F | Colony Group, LLC | 14,761 | -2.84 | 363 | 25.69 | ||||
| 2025-08-14 | 13F | Smartleaf Asset Management LLC | 7,110 | 9.20 | 173 | 37.60 | ||||
| 2025-07-22 | 13F | Belpointe Asset Management LLC | 12,433 | 1.29 | 305 | 30.90 | ||||
| 2025-08-29 | 13F | Evolution Wealth Management Inc. | 239 | 6 | ||||||
| 2025-08-14 | 13F | Jane Street Group, Llc | 0 | -100.00 | 0 | -100.00 | ||||
| 2025-07-18 | 13F | Truist Financial Corp | 101,560 | -4.53 | 2,494 | 23.40 | ||||
| 2025-08-08 | 13F | Wiser Advisor Group LLC | 0 | -100.00 | 0 | |||||
| 2025-08-14 | 13F/A | Rockefeller Capital Management L.P. | 65,142 | 3.97 | 1,600 | 34.37 | ||||
| 2025-08-04 | 13F | Integrity Alliance, Llc. | 15,208 | -57.15 | 374 | -44.66 | ||||
| 2025-04-10 | 13F | EWG Elevate Inc. | 0 | -100.00 | 0 | |||||
| 2025-08-06 | 13F | Wsfs Capital Management, Llc | 13,188 | 0.00 | 324 | 29.20 | ||||
| 2025-07-11 | 13F | Farther Finance Advisors, LLC | 1,800 | 0.00 | 44 | 29.41 | ||||
| 2025-08-14 | 13F | GWM Advisors LLC | 315 | 0.00 | 8 | 40.00 | ||||
| 2025-07-22 | 13F | Wealthcare Advisory Partners LLC | 8,980 | 221 | ||||||
| 2025-08-13 | 13F | Flow Traders U.s. Llc | 0 | -100.00 | 0 | |||||
| 2025-04-10 | 13F | Hennion & Walsh Asset Management, Inc. | 0 | -100.00 | 0 | |||||
| 2025-07-17 | 13F | Halbert Hargrove Global Advisors, Llc | 5,590 | -37.82 | 137 | -19.41 | ||||
| 2025-08-14 | 13F | Stifel Financial Corp | 43,217 | -2.51 | 1,061 | 26.01 | ||||
| 2025-07-15 | 13F | MCF Advisors LLC | 400 | 0.00 | 10 | 28.57 | ||||
| 2025-08-01 | 13F | Transcend Wealth Collective, Llc | 10,356 | -2.36 | 254 | 26.37 | ||||
| 2025-07-14 | 13F | AdvisorNet Financial, Inc | 71,214 | 0.94 | 1,749 | 30.52 | ||||
| 2025-08-15 | 13F | Kestra Advisory Services, LLC | 140,036 | -5.64 | 3,439 | 21.99 | ||||
| 2025-07-17 | 13F | Janney Montgomery Scott LLC | 18,255 | -5.37 | 0 | |||||
| 2025-08-06 | 13F | Commonwealth Equity Services, Llc | 55,741 | -10.50 | 1 | 0.00 | ||||
| 2025-05-05 | 13F | Transce3nd, LLC | 0 | -100.00 | 0 | |||||
| 2025-07-31 | 13F | Glass Jacobson Investment Advisors llc | 810 | 20 | ||||||
| 2025-05-16 | 13F | Coppell Advisory Solutions LLC | 0 | -100.00 | 0 | |||||
| 2025-07-30 | 13F | Insight Advisors, LLC/ PA | 29,623 | 8.53 | 728 | 40.35 | ||||
| 2025-08-06 | 13F | AE Wealth Management LLC | 1,778 | 0.00 | 44 | 30.30 | ||||
| 2025-08-05 | 13F | EPG Wealth Management LLC | 1,000 | 0.00 | 25 | 26.32 | ||||
| 2025-08-14 | 13F | Citadel Advisors Llc | 0 | -100.00 | 0 | |||||
| 2025-08-14 | 13F | AllSquare Wealth Management LLC | 3,823 | 0.00 | 94 | 29.17 | ||||
| 2025-08-14 | 13F | Citadel Advisors Llc | Call | 0 | -100.00 | 0 | ||||
| 2025-07-25 | 13F | Orca Investment Management, LLC | 64,113 | -10.76 | 1,575 | 15.31 | ||||
| 2025-07-14 | 13F | Sweeney & Michel, Llc | 15,796 | 1.28 | 385 | 48.84 | ||||
| 2025-08-14 | 13F | Prestige Wealth Management Group LLC | 1,050 | 0.00 | 26 | 31.58 | ||||
| 2025-08-14 | 13F | UBS Group AG | 6,229 | 18.85 | 153 | 53.54 | ||||
| 2025-08-04 | 13F | Assetmark, Inc | 105 | 3 | ||||||
| 2025-08-18 | 13F | Geneos Wealth Management Inc. | 9,125 | 0.00 | 224 | 29.48 | ||||
| 2025-08-14 | 13F | Citadel Advisors Llc | Put | 0 | -100.00 | 0 | ||||
| 2025-08-14 | 13F | D. E. Shaw & Co., Inc. | 19,222 | 0.00 | 472 | 29.32 | ||||
| 2025-08-12 | 13F | Coldstream Capital Management Inc | 0 | -100.00 | 0 | |||||
| 2025-08-14 | 13F | Glen Eagle Advisors, LLC | 270 | 0.00 | 7 | 20.00 | ||||
| 2025-08-11 | 13F | Private Advisor Group, LLC | 54,152 | 24.93 | 1,330 | 61.48 | ||||
| 2025-07-07 | 13F | Fox Hill Wealth Management | 15,895 | -0.92 | 390 | 28.29 | ||||
| 2025-08-04 | 13F | Creative Financial Designs Inc /adv | 23,594 | 79.53 | 579 | 132.53 | ||||
| 2025-08-12 | 13F | Steward Partners Investment Advisory, Llc | 12,085 | -9.09 | 297 | 17.46 | ||||
| 2025-08-14 | 13F | Murphy & Mullick Capital Management Corp | 63 | 0.00 | 2 | 0.00 | ||||
| 2025-08-11 | 13F | United Capital Financial Advisers, Llc | 0 | -100.00 | 0 | |||||
| 2025-08-01 | 13F | Centerpoint Advisors, LLC | 575 | 0.00 | 0 | |||||
| 2025-08-14 | 13F | Fmr Llc | 20 | -88.76 | 0 | -100.00 | ||||
| 2025-08-07 | 13F | Nwam Llc | 39,402 | 6.69 | 1,017 | 44.94 | ||||
| 2025-08-11 | 13F | Aptus Capital Advisors, LLC | 190 | 5 | ||||||
| 2025-08-14 | 13F | CoreCap Advisors, LLC | 0 | 0 | ||||||
| 2025-08-08 | 13F | Avantax Advisory Services, Inc. | 12,668 | 14.91 | 311 | 48.80 | ||||
| 2025-07-24 | 13F | JNBA Financial Advisors | 1,000 | 0.00 | 25 | 26.32 | ||||
| 2025-08-12 | 13F | Accredited Wealth Management, LLC | 270 | -94.18 | 7 | -93.18 | ||||
| 2025-04-22 | 13F/A | NorthRock Partners, LLC | 0 | -100.00 | 0 | |||||
| 2025-07-16 | 13F | Perigon Wealth Management, LLC | 45,957 | -7.08 | 1,129 | 20.13 | ||||
| 2025-08-14 | 13F | Bank Of America Corp /de/ | 130,937 | 30.61 | 3,216 | 68.86 | ||||
| 2025-08-14 | 13F | Ameriprise Financial Inc | 62,565 | 383.58 | 1,537 | 526.94 | ||||
| 2025-07-18 | 13F | Provident Wealth Management, LLC | 8,641 | 212 | ||||||
| 2025-07-25 | 13F | Cwm, Llc | 177 | 0.00 | 0 | |||||
| 2025-08-12 | 13F | Park Square Financial Group, LLC | 300 | 0.00 | 7 | 40.00 | ||||
| 2025-08-14 | 13F | Ausdal Financial Partners, Inc. | 12,934 | 318 | ||||||
| 2025-08-08 | 13F | Larson Financial Group LLC | 2,500 | 0.00 | 61 | 29.79 | ||||
| 2025-05-12 | 13F | Simplex Trading, Llc | 0 | -100.00 | 0 | |||||
| 2025-07-23 | 13F | Valmark Advisers, Inc. | 10,336 | 254 | ||||||
| 2025-07-22 | 13F | Apexium Financial, Lp | 0 | -100.00 | 0 | |||||
| 2025-08-01 | 13F | Envestnet Asset Management Inc | 11,685 | 7.81 | 287 | 39.51 | ||||
| 2025-07-31 | 13F | Cambridge Investment Research Advisors, Inc. | 42,754 | -0.48 | 1 | |||||
| 2025-08-08 | 13F | Comprehensive Financial Planning, Inc./PA | 602 | 0.17 | 15 | 27.27 | ||||
| 2025-08-07 | 13F | Cascade Financial Partners, LLC | 38,018 | 5.78 | 934 | 36.80 | ||||
| 2025-05-16 | 13F | Jones Financial Companies Lllp | 0 | -100.00 | 0 | |||||
| 2025-07-29 | 13F | Woodard & Co Asset Management Group Inc /adv | 650 | 0.00 | 16 | 25.00 | ||||
| 2025-08-12 | 13F | MAI Capital Management | 1,071 | 0.00 | 26 | 30.00 | ||||
| 2025-08-13 | 13F | Northwestern Mutual Wealth Management Co | 2,984 | -6.28 | 73 | 21.67 | ||||
| 2025-08-07 | 13F | Kestra Private Wealth Services, Llc | 14,806 | 20.32 | 364 | 55.79 | ||||
| 2025-08-08 | 13F | Cetera Investment Advisers | 21,550 | 3.35 | 529 | 33.59 | ||||
| 2025-07-01 | 13F | Harbor Investment Advisory, Llc | 0 | -100.00 | 0 | |||||
| 2025-08-08 | 13F | Creative Planning | 18,208 | 6.42 | 447 | 37.54 | ||||
| 2025-08-12 | 13F | Proequities, Inc. | 0 | 0 | ||||||
| 2025-08-12 | 13F | SRS Capital Advisors, Inc. | 1,900 | 33.05 | 47 | 70.37 | ||||
| 2025-08-12 | 13F | Waddell & Associates, Llc | 53,221 | -0.78 | 1,307 | 28.26 | ||||
| 2025-08-06 | 13F | Prospera Financial Services Inc | 102,188 | 4.70 | 2,510 | 35.33 | ||||
| 2025-08-01 | 13F | Gwn Securities Inc. | 17,238 | -87.88 | 423 | -86.66 | ||||
| 2025-08-08 | 13F | Pnc Financial Services Group, Inc. | 2,000 | 0.00 | 49 | 28.95 | ||||
| 2025-08-12 | 13F | Jpmorgan Chase & Co | 0 | -100.00 | 0 | |||||
| 2025-04-23 | 13F | Continuum Advisory, LLC | 0 | -100.00 | 0 | -100.00 | ||||
| 2025-08-14 | 13F | Acorn Wealth Advisors, LLC | 0 | -100.00 | 0 | |||||
| 2025-07-17 | 13F | Wolff Wiese Magana Llc | 122 | 0.00 | 3 | 0.00 | ||||
| 2025-07-29 | 13F | Private Trust Co Na | 145 | 4 | ||||||
| 2025-08-13 | 13F | Cary Street Partners Financial Llc | 12,489 | 307 | ||||||
| 2025-08-12 | 13F | Global Retirement Partners, LLC | 136 | 3 | ||||||
| 2025-08-11 | 13F | Western Wealth Management, LLC | 9,202 | 226 | ||||||
| 2025-08-12 | 13F | LPL Financial LLC | 397,803 | 4.10 | 9,770 | 34.57 | ||||
| 2025-08-19 | 13F | Advisory Services Network, LLC | 286,969 | -4.62 | 7,306 | 27.82 | ||||
| 2025-07-28 | 13F | Harbour Investments, Inc. | 625 | 0.00 | 15 | 36.36 | ||||
| 2025-08-05 | 13F | Key FInancial Inc | 9,459 | 0.00 | 232 | 29.61 | ||||
| 2025-08-14 | 13F | Sherman Asset Management, Inc. | 9,116 | 0.45 | 224 | 29.65 |