Mga Batayang Estadistika
| Pemilik Institusional | 108 total, 97 long only, 1 short only, 10 long/short - change of 1.72% MRQ |
| Alokasi Portofolio Rata-rata | 0.4589 % - change of -46.01% MRQ |
| Saham Institusional (Jangka Panjang) | 2,075,378 (ex 13D/G) - change of 0.15MM shares 9.98% MRQ |
| Nilai Institusional (Jangka Panjang) | $ 219,378 USD ($1000) |
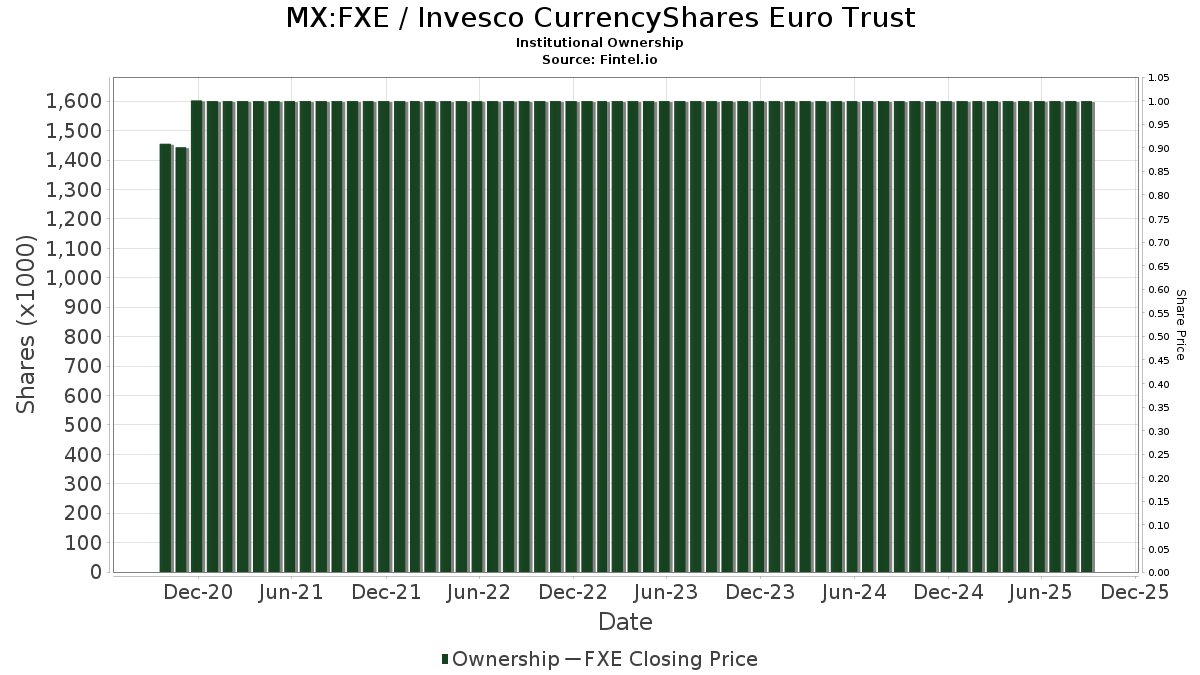
Kepemilikan Institusional dan Pemegang Saham
Invesco CurrencyShares Euro Trust (MX:FXE) memiliki 108 pemilik institusional dan pemegang saham yang telah mengajukan formulir 13D/G atau 13F kepada Komisi Bursa Efek (Securities Exchange Commission/SEC). Lembaga-lembaga ini memegang total 2,075,378 saham. Pemegang saham terbesar meliputi Morgan Stanley, Citadel Advisors Llc, Susquehanna International Group, Llp, Bnp Paribas Arbitrage, Sa, Raymond James Financial Inc, Citadel Advisors Llc, Citadel Advisors Llc, Goldman Sachs Group Inc, Wells Fargo & Company/mn, and Oppenheimer & Co Inc .
Struktur kepemilikan institusional Invesco CurrencyShares Euro Trust (BMV:FXE) menunjukkan posisi terkini di perusahaan oleh institusi dan dana, serta perubahan terbaru dalam ukuran posisi. Pemegang saham utama dapat mencakup investor individu, reksa dana, dana lindung nilai, atau institusi. Jadwal 13D menunjukkan bahwa investor memegang (atau pernah memegang) lebih dari 5% saham perusahaan dan bermaksud (atau pernah bermaksud) untuk secara aktif mengejar perubahan strategi bisnis. Jadwal 13G menunjukkan investasi pasif lebih dari 5%.
Skor Sentimen Dana
Skor Sentimen Dana (sebelumnya dikenal sebagai Skor Akumulasi Kepemilikan) menemukan saham-saham yang paling banyak dibeli oleh dana. Ini adalah hasil dari model kuantitatif multi-faktor yang canggih yang mengidentifikasi perusahaan dengan tingkat akumulasi institusional tertinggi. Model penilaian menggunakan kombinasi dari total peningkatan pemilik yang diungkapkan, perubahan dalam alokasi portofolio pada pemilik tersebut, dan metrik lainnya. Angka berkisar dari 0 hingga 100, dengan angka yang lebih tinggi menunjukkan tingkat akumulasi yang lebih tinggi dibandingkan dengan perusahaan sejenisnya, dan 50 adalah rata-ratanya.
Frekuensi Pembaruan: Setiap Hari
Lihat Ownership Explorer, yang menyediakan daftar perusahaan dengan peringkat tertinggi.
Pengajuan 13F dan NPORT
Detail pada pengajuan 13F tersedia gratis. Detail pada pengajuan NP memerlukan keanggotaan premium. Baris berwarna hijau menunjukkan posisi baru. Baris berwarna merah menunjukkan posisi yang sudah ditutup. Klik tautan ini ikon untuk melihat riwayat transaksi selengkapnya.
Tingkatkan
untuk membuka data premium dan mengekspor ke Excel ![]() .
.
| Tanggal File | Sumber | Investor | Ketik | Presyo ng Avg (Silangan) |
Saham | Δ Saham (%) |
Dilaporkan Nilai ($1000) |
Nilai Δ (%) |
Alokasi Port (%) |
|
|---|---|---|---|---|---|---|---|---|---|---|
| 2025-08-14 | 13F | BTG Pactual Asset Management US LLC | 0 | -100.00 | 0 | -100.00 | ||||
| 2025-07-30 | NP | QVOY - Q3 All-Season Active Rotation ETF | 20,697 | -14.92 | 2,170 | -9.62 | ||||
| 2025-07-07 | 13F | Roxbury Financial LLC | 143 | 16 | ||||||
| 2025-08-08 | 13F | Tortoise Investment Management, LLC | 925 | 101 | ||||||
| 2025-08-12 | 13F | Virtu Financial LLC | 0 | -100.00 | 0 | |||||
| 2025-09-04 | 13F/A | Advisor Group Holdings, Inc. | 586 | 16.04 | 64 | 26.00 | ||||
| 2025-08-12 | 13F | Jpmorgan Chase & Co | 2,409 | 262 | ||||||
| 2025-08-08 | 13F | Ironwood Investment Counsel, LLC | 3,330 | 362 | ||||||
| 2025-08-14 | 13F | Mml Investors Services, Llc | 5,270 | 1 | ||||||
| 2025-08-14 | 13F | Susquehanna International Group, Llp | 0 | -100.00 | 0 | |||||
| 2025-08-06 | 13F | Prospera Financial Services Inc | 2,525 | 0.00 | 275 | 8.73 | ||||
| 2025-08-14 | 13F | Federation des caisses Desjardins du Quebec | 1,223 | 70.81 | 133 | 87.32 | ||||
| 2025-08-26 | NP | LCR - Leuthold Core ETF | 8,820 | -7.14 | 960 | 1.16 | ||||
| 2025-08-14 | 13F | UBS Group AG | 24,932 | 170.15 | 2,712 | 194.46 | ||||
| 2025-08-08 | 13F | Bailard, Inc. | 1,916 | 208 | ||||||
| 2025-08-27 | 13F/A | Squarepoint Ops LLC | Call | 5,900 | 0.00 | 642 | 8.83 | |||
| 2025-08-14 | 13F | Warren Averett Asset Management, LLC | 18,166 | 1,976 | ||||||
| 2025-08-07 | 13F | Verus Capital Partners, Llc | 6,607 | 719 | ||||||
| 2025-08-14 | 13F | Royal Bank Of Canada | 3,995 | -63.21 | 435 | -59.91 | ||||
| 2025-04-18 | 13F | Insigneo Advisory Services, Llc | 0 | -100.00 | 0 | |||||
| 2025-08-14 | 13F | Fmr Llc | 46 | 0.00 | 5 | 25.00 | ||||
| 2025-08-08 | 13F | Gts Securities Llc | 20,478 | 163.45 | 2,228 | 186.98 | ||||
| 2025-08-13 | 13F | Renaissance Technologies Llc | 47,800 | 5,200 | ||||||
| 2025-07-08 | 13F | Baker Ellis Asset Management LLC | 3,000 | 326 | ||||||
| 2025-08-13 | 13F | GeoWealth Management, LLC | 200 | 22 | ||||||
| 2025-08-15 | 13F | CI Private Wealth, LLC | 17,361 | 1,889 | ||||||
| 2025-05-05 | 13F | Ping Capital Management, Inc. | 0 | -100.00 | 0 | |||||
| 2025-07-11 | 13F | Farther Finance Advisors, LLC | 276 | 30 | ||||||
| 2025-08-04 | 13F | Flagship Harbor Advisors, Llc | 6,490 | 706 | ||||||
| 2025-08-13 | 13F | Mount Yale Investment Advisors, LLC | 42 | 5 | ||||||
| 2025-07-17 | 13F | Catalytic Wealth RIA, LLC | 5,994 | 652 | ||||||
| 2025-07-25 | 13F | Lodestar Private Asset Management Llc | 2,362 | 257 | ||||||
| 2025-08-14 | 13F | Ameriprise Financial Inc | 2,488 | 271 | ||||||
| 2025-08-12 | 13F | Clear Street Markets Llc | Put | 25,000 | 150.00 | 2,720 | 172.17 | |||
| 2025-08-15 | 13F | Morgan Stanley | 808,204 | 390.66 | 87,925 | 434.33 | ||||
| 2025-07-10 | 13F | Wealth Enhancement Advisory Services, Llc | 3,214 | 349 | ||||||
| 2025-08-14 | 13F | Stifel Financial Corp | 3,082 | 0.00 | 335 | 9.12 | ||||
| 2025-08-05 | 13F | Bank Of Montreal /can/ | 5,194 | 565 | ||||||
| 2025-07-30 | 13F | Klingenstein Fields & Co Lp | 8,113 | 883 | ||||||
| 2025-08-06 | 13F | Nvwm, Llc | 1,201 | 131 | ||||||
| 2025-05-20 | 13F | Belpointe Asset Management LLC | 0 | -100.00 | 0 | -100.00 | ||||
| 2025-08-12 | 13F | LPL Financial LLC | 32,721 | 253.55 | 3,560 | 285.17 | ||||
| 2025-07-16 | 13F | Augustine Asset Management Inc | 10,881 | 173.87 | 1,184 | 198.74 | ||||
| 2025-08-05 | 13F | Key FInancial Inc | 1,060 | 0.00 | 115 | 9.52 | ||||
| 2025-08-13 | 13F | EverSource Wealth Advisors, LLC | 1,004 | 0.30 | 109 | 9.00 | ||||
| 2025-07-31 | 13F | Oppenheimer & Co Inc | 50,261 | 5,468 | ||||||
| 2025-07-23 | 13F | Nbt Bank N A /ny | 200 | 22 | ||||||
| 2025-08-08 | 13F | Creative Planning | 3,841 | 418 | ||||||
| 2025-04-14 | 13F | Upper Left Wealth Management, LLC | 0 | -100.00 | 0 | |||||
| 2025-05-14 | 13F | Walleye Trading LLC | Call | 0 | -100.00 | 0 | ||||
| 2025-07-03 | 13F | Garde Capital, Inc. | 1,135 | 0.00 | 123 | 8.85 | ||||
| 2025-08-14 | 13F | Raymond James Financial Inc | 93,269 | 37.34 | 10,147 | 49.56 | ||||
| 2025-08-26 | 13F | Nautilus Advisors LLC | 10,587 | 11.95 | 1,152 | 21.93 | ||||
| 2025-05-05 | 13F | Berkeley Capital Partners, LLC | 0 | -100.00 | 0 | |||||
| 2025-08-14 | 13F | Goldman Sachs Group Inc | 75,009 | 0.00 | 8,160 | 8.90 | ||||
| 2025-07-22 | 13F | Yoder Wealth Management, Inc. | 4,200 | 457 | ||||||
| 2025-07-30 | 13F | Exencial Wealth Advisors, Llc | 5,356 | 0.00 | 583 | 8.79 | ||||
| 2025-08-14 | 13F | Transamerica Financial Advisors, Inc. | 4 | 0.00 | 0 | |||||
| 2025-08-06 | 13F | Legacy Bridge, LLC | 450 | 49 | ||||||
| 2025-08-08 | 13F | Hartland & Co., LLC | 114 | 0.00 | 12 | 9.09 | ||||
| 2025-08-12 | 13F | Choate Investment Advisors | 5,523 | 601 | ||||||
| 2025-08-12 | 13F | Waterloo Capital, L.P. | 2,296 | 250 | ||||||
| 2025-08-14 | 13F | Group One Trading, L.p. | Put | 300 | -57.14 | 33 | -53.62 | |||
| 2025-08-14 | 13F | Bnp Paribas Arbitrage, Sa | 100,000 | 10,879 | ||||||
| 2025-08-14 | 13F | Group One Trading, L.p. | 1,656 | 180 | ||||||
| 2025-07-28 | 13F | Mutual Advisors, LLC | 6,445 | 20.22 | 699 | 24.20 | ||||
| 2025-08-13 | 13F | Rsm Us Wealth Management Llc | 2,266 | 247 | ||||||
| 2025-07-28 | 13F | Copia Wealth Management | 0 | -100.00 | 0 | |||||
| 2025-05-14 | 13F | Flow Traders U.s. Llc | 0 | -100.00 | 0 | |||||
| 2025-08-14 | 13F | BTG Pactual Asset Management US LLC | Put | 29,900 | 730.56 | 3,253 | 805.85 | |||
| 2025-08-14 | 13F | BTG Pactual Asset Management US LLC | Call | 29,900 | 730.56 | 3,253 | 805.85 | |||
| 2025-08-04 | 13F | Haven Private, LLC | 7,758 | 844 | ||||||
| 2025-07-08 | 13F | Parallel Advisors, LLC | 1,040 | 113 | ||||||
| 2025-07-09 | 13F | Dynamic Advisor Solutions LLC | 0 | -100.00 | 0 | |||||
| 2025-07-22 | 13F | IMC-Chicago, LLC | 12,369 | 1,346 | ||||||
| 2025-07-22 | 13F | IMC-Chicago, LLC | Put | 30,200 | 120.44 | 3,285 | 140.13 | |||
| 2025-04-14 | 13F | Greenspring Advisors, LLC | 4,468 | 446 | ||||||
| 2025-07-22 | 13F | IMC-Chicago, LLC | Call | 26,000 | 48.57 | 2,829 | 61.78 | |||
| 2025-08-14 | 13F | Susquehanna International Group, Llp | Call | 131,400 | 591.58 | 14,295 | 653.16 | |||
| 2025-07-03 | 13F | Fiduciary Financial Group, Llc | 3,408 | -2.07 | 371 | 2.78 | ||||
| 2025-07-16 | 13F | Perigon Wealth Management, LLC | 28,668 | 53.61 | 953 | -48.93 | ||||
| 2025-08-11 | 13F | Citigroup Inc | 5,000 | 544 | ||||||
| 2025-07-23 | 13F | Joel Isaacson & Co., LLC | 2,978 | 0.00 | 324 | 8.75 | ||||
| 2025-07-31 | 13F | Cambridge Investment Research Advisors, Inc. | 5,322 | 1 | ||||||
| 2025-08-13 | 13F | Leuthold Group, Llc | 44,735 | 6.75 | 4,867 | 16.24 | ||||
| 2025-08-07 | 13F | Efficient Advisors, LLC | 3,998 | 435 | ||||||
| 2025-07-18 | 13F | Pure Financial Advisors, Inc. | 4,259 | 463 | ||||||
| 2025-08-01 | 13F | Ashton Thomas Private Wealth, LLC | 15,398 | -6.10 | 1,675 | 2.26 | ||||
| 2025-08-14 | 13F | Millennium Management Llc | Put | 3,900 | -58.51 | 424 | -54.85 | |||
| 2025-08-14 | 13F | Millennium Management Llc | Call | 3,900 | -58.51 | 424 | -54.85 | |||
| 2025-08-05 | 13F | Dunhill Financial, LLC | 439 | 48 | ||||||
| 2025-05-21 | 13F/A | Geneos Wealth Management Inc. | 250 | 25 | ||||||
| 2025-08-01 | 13F | Envestnet Asset Management Inc | 6,817 | -4.05 | 742 | 4.51 | ||||
| 2025-08-06 | 13F | Pekin Hardy Strauss, Inc. | 4,500 | 490 | ||||||
| 2025-08-13 | 13F | Hsbc Holdings Plc | 10,709 | 0.00 | 1,165 | 8.98 | ||||
| 2025-08-18 | 13F | Wolverine Trading, Llc | Put | 12,200 | 8.93 | 1,319 | 17.78 | |||
| 2025-08-26 | NP | ASYLX - AB Select US Long/Short Portfolio Advisor Class | 0 | -100.00 | 0 | -100.00 | ||||
| 2025-08-18 | 13F | Wolverine Trading, Llc | 8,564 | 21.13 | 926 | 31.02 | ||||
| 2025-08-14 | 13F | Parallax Volatility Advisers, L.P. | 5,180 | 0.00 | 564 | 8.90 | ||||
| 2025-08-18 | 13F | Wolverine Trading, Llc | Call | 28,100 | 116.15 | 3,038 | 133.80 | |||
| 2025-08-14 | 13F | Comerica Bank | 1,602 | -13.41 | 174 | -5.43 | ||||
| 2025-08-12 | 13F | Coldstream Capital Management Inc | 0 | -100.00 | 0 | |||||
| 2025-08-19 | 13F | Advisory Services Network, LLC | 45,543 | 4,796 | ||||||
| 2025-08-15 | 13F | Captrust Financial Advisors | 21,281 | 30.40 | 2,315 | 42.02 | ||||
| 2025-08-11 | 13F | TD Waterhouse Canada Inc. | 1,720 | 187 | ||||||
| 2025-08-28 | NP | HSTRX - Hussman Strategic Total Return Fund | 7,500 | 0.00 | 816 | 8.81 | ||||
| 2025-08-13 | 13F | Basso Capital Management, L.p. | 7,880 | 857 | ||||||
| 2025-08-14 | 13F | Investment House Llc | 7,133 | 776 | ||||||
| 2025-08-14 | 13F | Two Sigma Securities, Llc | 1,917 | 209 | ||||||
| 2025-08-14 | 13F | CIBC World Markets Inc. | 26,955 | 2,932 | ||||||
| 2025-07-15 | 13F | North Star Investment Management Corp. | 1,383 | 20.47 | 150 | 31.58 | ||||
| 2025-08-05 | 13F | Hussman Strategic Advisors, Inc. | 7,500 | 0.00 | 816 | 8.81 | ||||
| 2025-08-05 | 13F | Sage Capital Management, LLC | 1,939 | 211 | ||||||
| 2025-08-05 | 13F | Simplex Trading, Llc | Put | 10,800 | -61.01 | 1 | -50.00 | |||
| 2025-08-05 | 13F | Simplex Trading, Llc | 4,964 | -52.40 | 1 | -100.00 | ||||
| 2025-08-05 | 13F | Simplex Trading, Llc | Call | 29,600 | 171.56 | 3 | 200.00 | |||
| 2025-08-13 | 13F | Marshall Wace, Llp | Put | 7,100 | 787.50 | 772 | 877.22 | |||
| 2025-08-13 | 13F | Marshall Wace, Llp | Call | 2,400 | -67.57 | 261 | -64.68 | |||
| 2025-08-06 | 13F | Commonwealth Equity Services, Llc | 20,258 | 15.22 | 2 | 100.00 | ||||
| 2025-08-14 | 13F | Bank Of America Corp /de/ | 18,727 | 115.65 | 2,037 | 134.95 | ||||
| 2025-07-25 | 13F | Almanack Investment Partners, LLC. | 4,725 | 514 | ||||||
| 2025-08-13 | 13F | Marshall Wace, Llp | 5,700 | 620 | ||||||
| 2025-08-12 | 13F | Proequities, Inc. | Put | 0 | 0 | |||||
| 2025-08-12 | 13F | Proequities, Inc. | Call | 0 | 0 | |||||
| 2025-08-12 | 13F | Proequities, Inc. | 0 | 0 | ||||||
| 2025-08-14 | 13F | Colony Group, LLC | 25,483 | 134.84 | 2,772 | 155.72 | ||||
| 2025-08-14 | 13F | Wells Fargo & Company/mn | 56,623 | 302.27 | 6,160 | 338.05 | ||||
| 2025-08-12 | 13F | Clearwater Capital Advisors, LLC | 0 | -100.00 | 0 | |||||
| 2025-08-11 | 13F | HighTower Advisors, LLC | 7,217 | 785 | ||||||
| 2025-08-15 | 13F | Tower Research Capital LLC (TRC) | 8 | 1 | ||||||
| 2025-08-08 | 13F | Cetera Investment Advisers | 7,664 | 834 | ||||||
| 2025-08-01 | 13F | Brookwood Investment Group LLC | 7,183 | 781 | ||||||
| 2025-08-14 | 13F | Citadel Advisors Llc | Put | 291,100 | 1,602.34 | 31,669 | 1,754.10 | |||
| 2025-07-16 | 13F | Kathmere Capital Management, LLC | 11,109 | 0.00 | 1,209 | 8.93 | ||||
| 2025-08-14 | 13F | Susquehanna International Group, Llp | Put | 30,500 | -11.34 | 3,318 | -3.43 | |||
| 2025-07-21 | 13F | J. Safra Sarasin Holding AG | 35,514 | -8.95 | 3,864 | -0.85 | ||||
| 2025-08-14 | 13F | Citadel Advisors Llc | Call | 81,300 | -2.98 | 8,845 | 5.65 | |||
| 2025-08-14 | 13F | Citadel Advisors Llc | 82,755 | 869.82 | 9,003 | 956.57 | ||||
| 2025-08-14 | 13F | Jane Street Group, Llc | Call | 17,300 | -24.78 | 1,882 | -18.07 | |||
| 2025-08-14 | 13F | Jane Street Group, Llc | 30,658 | -48.58 | 3,335 | -44.01 | ||||
| 2025-08-14 | 13F | Jane Street Group, Llc | Put | 19,100 | 2,078 | |||||
| 2025-08-19 | 13F | National Asset Management, Inc. | 3,210 | 349 | ||||||
| 2025-04-21 | 13F | GFS Advisors, LLC | 0 | -100.00 | 0 | -100.00 |