Mga Batayang Estadistika
| Pemilik Institusional | 186 total, 186 long only, 0 short only, 0 long/short - change of 19.87% MRQ |
| Alokasi Portofolio Rata-rata | 0.3115 % - change of 4.18% MRQ |
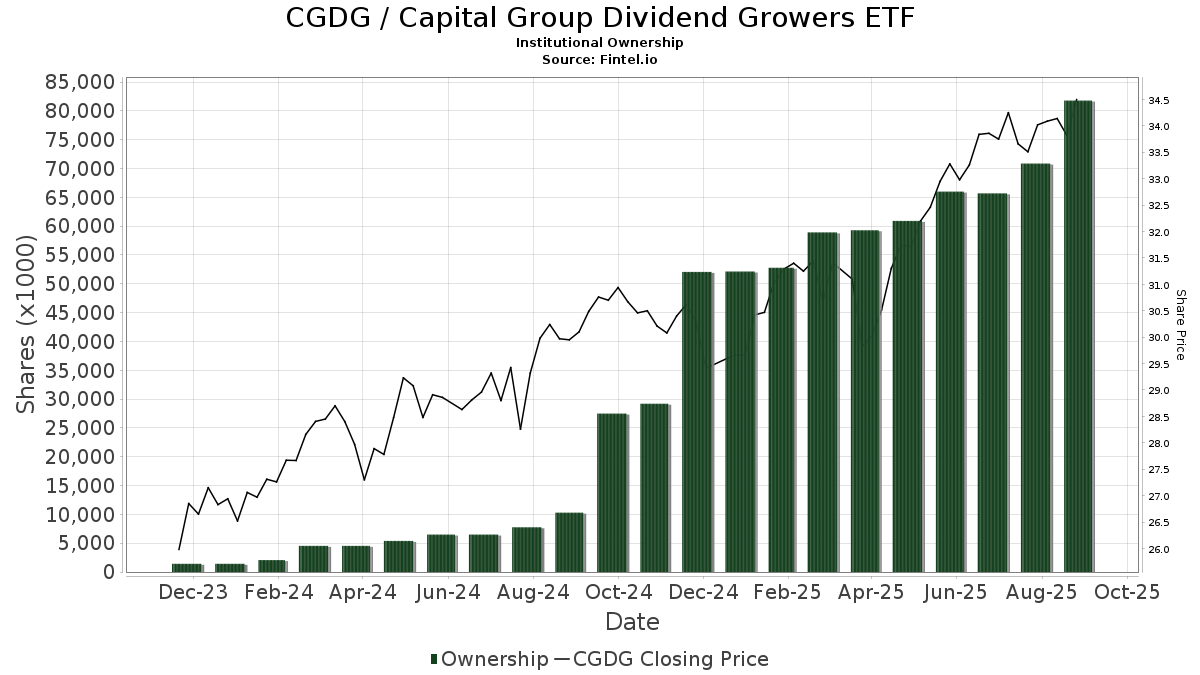
| Saham Institusional (Jangka Panjang) | 81,783,749 (ex 13D/G) - change of 15.79MM shares 23.93% MRQ |
| Nilai Institusional (Jangka Panjang) | $ 2,567,612 USD ($1000) |
Kepemilikan Institusional dan Pemegang Saham
Capital Group Dividend Growers ETF (US:CGDG) memiliki 186 pemilik institusional dan pemegang saham yang telah mengajukan formulir 13D/G atau 13F kepada Komisi Bursa Efek (Securities Exchange Commission/SEC). Lembaga-lembaga ini memegang total 81,783,749 saham. Pemegang saham terbesar meliputi Capital International Investors, TAIAX - American Funds Tax-Aware Conservative Growth and Income Portfolio Class A, Envestnet Asset Management Inc, LPL Financial LLC, Capital Group Private Client Services, Inc., Advance Capital Management, Inc., Raymond James Financial Inc, Commonwealth Equity Services, Llc, Cetera Investment Advisers, and Morgan Stanley .
Struktur kepemilikan institusional Capital Group Dividend Growers ETF (ARCA:CGDG) menunjukkan posisi terkini di perusahaan oleh institusi dan dana, serta perubahan terbaru dalam ukuran posisi. Pemegang saham utama dapat mencakup investor individu, reksa dana, dana lindung nilai, atau institusi. Jadwal 13D menunjukkan bahwa investor memegang (atau pernah memegang) lebih dari 5% saham perusahaan dan bermaksud (atau pernah bermaksud) untuk secara aktif mengejar perubahan strategi bisnis. Jadwal 13G menunjukkan investasi pasif lebih dari 5%.
The share price as of September 5, 2025 is 34.19 / share. Previously, on September 9, 2024, the share price was 29.77 / share. This represents an increase of 14.85% over that period.
Skor Sentimen Dana
Skor Sentimen Dana (sebelumnya dikenal sebagai Skor Akumulasi Kepemilikan) menemukan saham-saham yang paling banyak dibeli oleh dana. Ini adalah hasil dari model kuantitatif multi-faktor yang canggih yang mengidentifikasi perusahaan dengan tingkat akumulasi institusional tertinggi. Model penilaian menggunakan kombinasi dari total peningkatan pemilik yang diungkapkan, perubahan dalam alokasi portofolio pada pemilik tersebut, dan metrik lainnya. Angka berkisar dari 0 hingga 100, dengan angka yang lebih tinggi menunjukkan tingkat akumulasi yang lebih tinggi dibandingkan dengan perusahaan sejenisnya, dan 50 adalah rata-ratanya.
Frekuensi Pembaruan: Setiap Hari
Lihat Ownership Explorer, yang menyediakan daftar perusahaan dengan peringkat tertinggi.
Rasio Put/Call Institusional
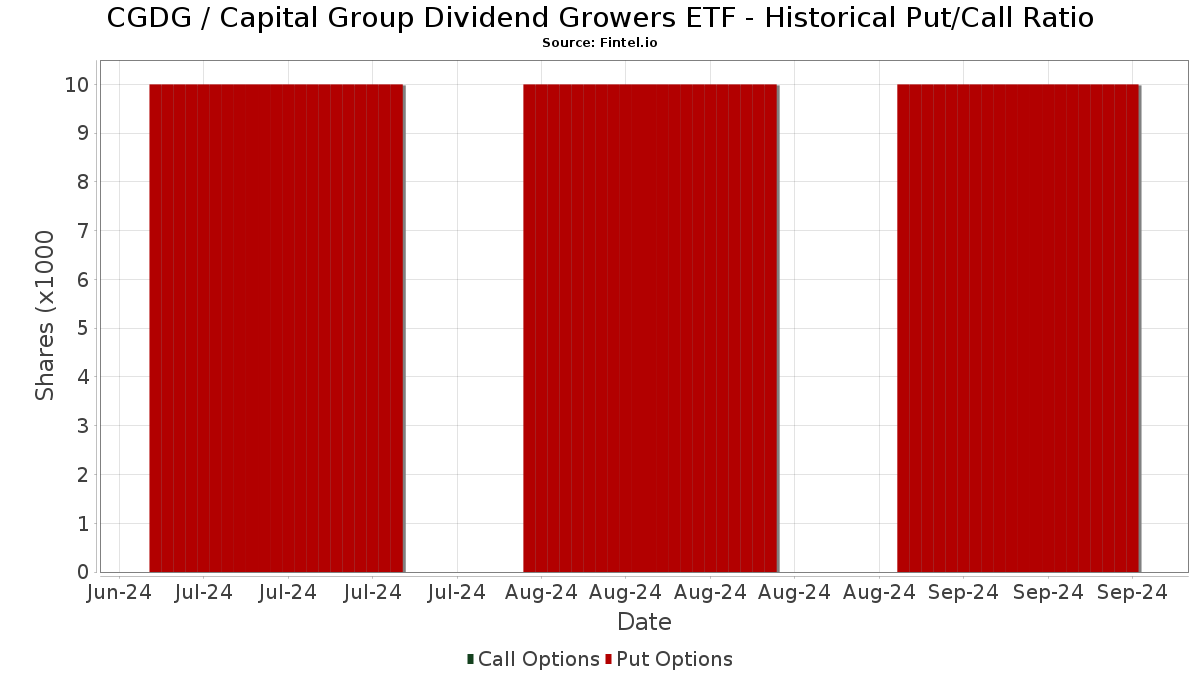
Selain melaporkan isu ekuitas dan utang standar, institusi dengan aset di bawah manajemen lebih dari 100 juta dolar AS juga harus mengungkapkan kepemilikan opsi put dan call mereka. Karena opsi put umumnya menunjukkan sentimen negatif, dan opsi call menunjukkan sentimen positif, kita dapat mengetahui sentimen institusional secara keseluruhan dengan memplot rasio put terhadap call. Grafik di sebelah kanan memplot rasio put/call historis untuk instrumen ini.
Menggunakan Rasio Put/Call sebagai indikator sentimen investor mengatasi salah satu kekurangan utama dari penggunaan total kepemilikan institusional, yaitu sejumlah besar aset yang dikelola diinvestasikan secara pasif untuk melacak indeks. Dana yang dikelola secara pasif biasanya tidak membeli opsi, sehingga indikator rasio put/call lebih akurat dalam melacak sentimen dana yang dikelola secara aktif.
Pengajuan 13F dan NPORT
Detail pada pengajuan 13F tersedia gratis. Detail pada pengajuan NP memerlukan keanggotaan premium. Baris berwarna hijau menunjukkan posisi baru. Baris berwarna merah menunjukkan posisi yang sudah ditutup. Klik tautan ini ikon untuk melihat riwayat transaksi selengkapnya.
Tingkatkan
untuk membuka data premium dan mengekspor ke Excel ![]() .
.
| Tanggal File | Sumber | Investor | Ketik | Presyo ng Avg (Silangan) |
Saham | Δ Saham (%) |
Dilaporkan Nilai ($1000) |
Nilai Δ (%) |
Alokasi Port (%) |
|
|---|---|---|---|---|---|---|---|---|---|---|
| 2025-08-11 | 13F | Synergy Investment Management, LLC | 0 | -100.00 | 0 | |||||
| 2025-08-05 | 13F | Plante Moran Financial Advisors, LLC | 0 | -100.00 | 0 | |||||
| 2025-07-22 | 13F | Merit Financial Group, LLC | 143,342 | 142.33 | 4,821 | 163.82 | ||||
| 2025-07-29 | 13F | Signature Estate & Investment Advisors Llc | 13,835 | 1.79 | 465 | 10.98 | ||||
| 2025-08-14 | 13F | UBS Group AG | 653,158 | 104.59 | 21,966 | 122.66 | ||||
| 2025-07-11 | 13F | Bond & Devick Financial Network, Inc. | 8,237 | 0.00 | 277 | 9.06 | ||||
| 2025-07-14 | 13F | Sweeney & Michel, Llc | 270,271 | 1.24 | 9,135 | 22.13 | ||||
| 2025-08-08 | 13F | Gts Securities Llc | 33,748 | 86.20 | 1,135 | 102.50 | ||||
| 2025-08-11 | 13F | Private Advisor Group, LLC | 514,938 | 69.55 | 17,317 | 84.54 | ||||
| 2025-07-22 | 13F | Gutierrez Wealth Advisory, LLC | 9,197 | 309 | ||||||
| 2025-07-29 | 13F | Balboa Wealth Partners | 7,095 | 239 | ||||||
| 2025-05-12 | 13F | Fmr Llc | 0 | -100.00 | 0 | |||||
| 2025-08-12 | 13F | Lodestone Wealth Management LLC | 12,737 | 24.35 | 428 | 35.44 | ||||
| 2025-07-24 | 13F | Stonebridge Financial Group, LLC | 0 | -100.00 | 0 | |||||
| 2025-07-29 | 13F | Private Trust Co Na | 12,129 | 0.00 | 408 | 8.82 | ||||
| 2025-05-14 | 13F | Huntington National Bank | 4 | |||||||
| 2025-05-02 | 13F | Capital A Wealth Management, LLC | 889 | 6.85 | 27 | 12.50 | ||||
| 2025-08-12 | 13F | Summit Global Investments | 8,194 | 0 | ||||||
| 2025-08-11 | 13F | Principal Securities, Inc. | 44,240 | 41.51 | 1,488 | 60.58 | ||||
| 2025-08-14 | 13F | Wells Fargo & Company/mn | 145,814 | 89,356.44 | 4,904 | 97,960.00 | ||||
| 2025-08-12 | 13F | Jpmorgan Chase & Co | 2,522 | -77.14 | 85 | -75.29 | ||||
| 2025-07-28 | 13F | Sagespring Wealth Partners, Llc | 42,715 | 18.91 | 1,437 | 29.49 | ||||
| 2025-07-22 | 13F | Wealthcare Advisory Partners LLC | 7,993 | 269 | ||||||
| 2025-07-16 | 13F | Strategic Investment Solutions, Inc. /IL | 1,648 | 10.75 | 55 | 22.22 | ||||
| 2025-07-29 | 13F | Koshinski Asset Management, Inc. | 45,061 | 5.68 | 1,515 | 15.03 | ||||
| 2025-08-04 | 13F | Mesirow Financial Investment Management, Inc. | 17,887 | 602 | ||||||
| 2025-08-13 | 13F | Bare Financial Services, Inc | 7,598 | 256 | ||||||
| 2025-08-14 | 13F | GWM Advisors LLC | 42,545 | 45.67 | 1,431 | 58.54 | ||||
| 2025-07-22 | 13F | DAVENPORT & Co LLC | 7,043 | 237 | ||||||
| 2025-08-14 | 13F | Wiley Bros.-aintree Capital, Llc | 208,554 | 80.59 | 7,051 | 96.30 | ||||
| 2025-07-29 | 13F | International Assets Investment Management, Llc | 13,433 | 0.49 | 452 | 9.20 | ||||
| 2025-08-14 | 13F | IHT Wealth Management, LLC | 10,777 | 362 | ||||||
| 2025-04-23 | 13F | Mascagni Wealth Management, Inc. | 0 | -100.00 | 0 | -100.00 | ||||
| 2025-07-25 | 13F | Atria Wealth Solutions, Inc. | 51,816 | -56.25 | 1,754 | -52.27 | ||||
| 2025-08-14 | 13F | Clg Llc | 19,378 | 14.77 | 652 | 24.95 | ||||
| 2025-08-08 | 13F | Kingsview Wealth Management, LLC | 27,711 | 7.64 | 932 | 17.11 | ||||
| 2025-08-14 | 13F | Great Valley Advisor Group, Inc. | 13,743 | 56.94 | 462 | 71.11 | ||||
| 2025-08-14 | 13F | Mpwm Advisory Solutions, Llc | 262 | 9 | ||||||
| 2025-08-08 | 13F | CWS Financial Advisors, LLC | 43,405 | 68.45 | 1,460 | 83.29 | ||||
| 2025-08-14 | 13F | Benjamin Edwards Inc | 486,169 | 57.03 | 16,350 | 70.91 | ||||
| 2025-08-13 | 13F | Baird Financial Group, Inc. | 158,126 | 2.74 | 5,318 | 11.82 | ||||
| 2025-07-21 | 13F | Patriot Financial Group Insurance Agency, LLC | 22,995 | 1.10 | 773 | 10.11 | ||||
| 2025-07-24 | 13F | IFP Advisors, Inc | 11,237 | 92.84 | 378 | 109.44 | ||||
| 2025-08-13 | 13F | First Trust Advisors Lp | 11,060 | 372 | ||||||
| 2025-08-12 | 13F | Steward Partners Investment Advisory, Llc | 70,702 | 46.96 | 2,378 | 59.96 | ||||
| 2025-07-08 | 13F | Advance Capital Management, Inc. | 2,669,679 | 89,781 | ||||||
| 2025-07-29 | 13F | Latitude Advisors, LLC | 20,414 | 17.93 | 687 | 28.46 | ||||
| 2025-08-04 | 13F | Flagship Harbor Advisors, Llc | 24,207 | 814 | ||||||
| 2025-08-29 | 13F | Centaurus Financial, Inc. | 6,331 | 11.28 | 0 | |||||
| 2025-08-14 | 13F | Royal Bank Of Canada | 1,546,267 | 24.96 | 52,001 | 36.00 | ||||
| 2025-08-12 | 13F | Titleist Asset Management, Llc | 10,431 | 2.64 | 351 | 11.46 | ||||
| 2025-08-12 | 13F | Putnam Fl Investment Management Co | 32,129 | -18.73 | 1,081 | -11.55 | ||||
| 2025-06-26 | NP | TAIAX - American Funds Tax-Aware Conservative Growth and Income Portfolio Class A This fund is a listed as child fund of Capital World Investors and if that institution has disclosed ownership in this security, then these positions will not be double counted when calculating total shares and total value | 17,291,935 | -1.74 | 541,238 | 0.12 | ||||
| 2025-08-12 | 13F | Coldstream Capital Management Inc | 0 | -100.00 | 0 | |||||
| 2025-08-13 | 13F | Continuum Advisory, LLC | 12,692 | 5.15 | 427 | 14.52 | ||||
| 2025-08-14 | 13F | Susquehanna International Group, Llp | 695,783 | 23,399 | ||||||
| 2025-07-10 | 13F | Wealth Enhancement Advisory Services, Llc | 123,280 | 15.60 | 4,185 | 27.01 | ||||
| 2025-08-12 | 13F | J.w. Cole Advisors, Inc. | 16,014 | 13.15 | 539 | 23.11 | ||||
| 2025-08-08 | 13F | Security Financial Services, INC. | 11,804 | 397 | ||||||
| 2025-07-24 | 13F | MSH Capital Advisors LLC | 8,511 | 286 | ||||||
| 2025-08-08 | 13F | Cetera Investment Advisers | 1,758,205 | 12.83 | 59,128 | 22.80 | ||||
| 2025-08-07 | 13F | Allworth Financial LP | 5,854 | 295.54 | 197 | 335.56 | ||||
| 2025-08-26 | 13F | Nautilus Advisors LLC | 52,276 | 13.04 | 1,758 | 23.02 | ||||
| 2025-08-04 | 13F | Spire Wealth Management | 270 | 0.37 | 9 | 12.50 | ||||
| 2025-07-11 | 13F | Lincoln Capital LLC | 15,331 | 7.17 | 516 | 19.21 | ||||
| 2025-08-15 | 13F | Captrust Financial Advisors | 182,093 | 9.56 | 6,124 | 19.24 | ||||
| 2025-08-14 | 13F | Old Mission Capital Llc | 30,714 | 1,033 | ||||||
| 2025-07-21 | 13F | Ameritas Advisory Services, LLC | 93,496 | -25.68 | 3,144 | -17.91 | ||||
| 2025-07-22 | 13F | Berger Financial Group, Inc | 12,751 | 44.88 | 429 | 57.93 | ||||
| 2025-08-14 | 13F | Sei Investments Co | 255,957 | 2,931.95 | 8,608 | 3,210.38 | ||||
| 2025-08-06 | 13F | Prospera Financial Services Inc | 13,693 | 59.42 | 460 | 73.58 | ||||
| 2025-07-11 | 13F | Farther Finance Advisors, LLC | 4,100 | 138 | ||||||
| 2025-08-06 | 13F | Founders Financial Securities Llc | 109,074 | 26.36 | 3,668 | 36.81 | ||||
| 2025-08-18 | 13F | Geneos Wealth Management Inc. | 31,450 | 98.39 | 1,058 | 116.16 | ||||
| 2025-08-15 | 13F | Equitable Holdings, Inc. | 50,201 | 115.06 | 1,688 | 134.12 | ||||
| 2025-07-16 | 13F | Swisher Financial Concepts, Inc. | 160,846 | 20.90 | 5,409 | 31.57 | ||||
| 2025-08-13 | 13F | Capital Analysts, Inc. | 1,619 | 0.43 | 0 | |||||
| 2025-07-17 | 13F | Janney Montgomery Scott LLC | 196,500 | 26.27 | 7 | 50.00 | ||||
| 2025-08-13 | 13F | Capital Group Private Client Services, Inc. | 4,078,770 | 34.42 | 137,169 | 46.30 | ||||
| 2025-07-17 | 13F | LifeGoal Wealth Advisors | 49,243 | -28.11 | 1,656 | -22.47 | ||||
| 2025-07-30 | 13F | Strategic Blueprint, LLC | 18,231 | 613 | ||||||
| 2025-08-12 | 13F | Gladstone Institutional Advisory LLC | 42,597 | 35.87 | 1,433 | 47.93 | ||||
| 2025-08-14 | 13F | Integrated Wealth Concepts LLC | 85,522 | 97.35 | 2,876 | 114.79 | ||||
| 2025-07-31 | 13F | Cambridge Investment Research Advisors, Inc. | 820,477 | 35.73 | 28 | 50.00 | ||||
| 2025-05-14 | 13F | Oarsman Capital, Inc. | 0 | -100.00 | 0 | -100.00 | ||||
| 2025-07-14 | 13F | Ai Financial Services Llc | 26,532 | 8.84 | 892 | 18.46 | ||||
| 2025-08-06 | 13F | Vestmark Advisory Solutions, Inc. | 655,048 | 105.86 | 22,029 | 124.05 | ||||
| 2025-07-14 | 13F | U.S. Capital Wealth Advisors, LLC | 131,366 | 17.45 | 4,418 | 27.81 | ||||
| 2025-08-13 | 13F | Aspire Growth Partners LLC | 23,811 | 0.00 | 801 | 5.96 | ||||
| 2025-08-13 | 13F | Cary Street Partners Financial Llc | 281,161 | 2,262.10 | 9,455 | 2,476.29 | ||||
| 2025-08-14 | 13F | Gerber Kawasaki Wealth & Investment Management | 24,245 | 815 | ||||||
| 2025-07-23 | 13F | Trueblood Wealth Management, LLC | 47,444 | 12.68 | 1,596 | 22.60 | ||||
| 2025-08-12 | 13F | LPL Financial LLC | 5,565,635 | 103.35 | 187,172 | 121.31 | ||||
| 2025-07-25 | 13F | Concurrent Investment Advisors, LLC | 178,946 | 5.67 | 6,018 | 15.00 | ||||
| 2025-07-16 | 13F | ORG Partners LLC | 12,486 | 914.30 | 421 | 1,007.89 | ||||
| 2025-08-12 | 13F | Global Retirement Partners, LLC | 2,805 | 807.77 | 94 | 944.44 | ||||
| 2025-08-14 | 13F | Raymond James Financial Inc | 2,652,387 | 46.33 | 89,200 | 59.26 | ||||
| 2025-07-29 | 13F | Stephens Inc /ar/ | 8,875 | 298 | ||||||
| 2025-08-14 | 13F | Jane Street Group, Llc | 381,723 | 5.94 | 12,837 | 15.31 | ||||
| 2025-08-08 | 13F | Larson Financial Group LLC | 3,650 | 0.00 | 123 | 8.93 | ||||
| 2025-05-09 | 13F | Pnc Financial Services Group, Inc. | 0 | -100.00 | 0 | |||||
| 2025-08-12 | 13F | Proequities, Inc. | 0 | 0 | ||||||
| 2025-04-16 | 13F | New Century Financial Group, LLC | 0 | -100.00 | 0 | -100.00 | ||||
| 2025-08-08 | 13F | Sittner & Nelson, Llc | 1,010 | 34 | ||||||
| 2025-07-09 | 13F | WealthCare Investment Partners, LLC | 139,089 | -5.40 | 4,722 | 7.61 | ||||
| 2025-07-31 | 13F | Moloney Securities Asset Management, LLC | 19,329 | 119.50 | 650 | 138.97 | ||||
| 2025-07-24 | 13F | Us Bancorp \de\ | 75,531 | 6.65 | 2,540 | 16.09 | ||||
| 2025-09-04 | 13F/A | Advisor Group Holdings, Inc. | 668,976 | 66.84 | 22,382 | 80.61 | ||||
| 2025-07-30 | 13F | BlueChip Wealth Advisors LLC | 132,024 | 9.18 | 4,440 | 18.82 | ||||
| 2025-08-08 | 13F | New England Capital Financial Advisors LLC | 0 | -100.00 | 0 | |||||
| 2025-07-17 | 13F | Venture Visionary Partners LLC | 18,934 | 169.45 | 637 | 193.09 | ||||
| 2025-07-22 | 13F | Simplicity Wealth,LLC | 37,886 | 122.56 | 1,274 | 142.21 | ||||
| 2025-07-23 | 13F | Seamount Financial Group Inc | 57,185 | 26.77 | 1,923 | 38.05 | ||||
| 2025-08-12 | 13F | TCP Asset Management, LLC | 6,026 | 203 | ||||||
| 2025-07-30 | 13F | Onyx Bridge Wealth Group LLC | 285,341 | 9,604 | ||||||
| 2025-07-25 | 13F | Apollon Wealth Management, LLC | 43,291 | 1,456 | ||||||
| 2025-07-09 | 13F | Dynamic Advisor Solutions LLC | 49,093 | -10.79 | 1,651 | -2.88 | ||||
| 2025-08-14 | 13F | Main Street Financial Solutions, LLC | 15,063 | 507 | ||||||
| 2025-07-09 | 13F | Massmutual Trust Co Fsb/adv | 4 | 0.00 | 0 | |||||
| 2025-08-15 | 13F | Morgan Stanley | 1,752,454 | 73.70 | 58,935 | 89.05 | ||||
| 2025-07-24 | 13F | MFA Wealth Services | 32,469 | 1,092 | ||||||
| 2025-08-15 | 13F | Kestra Advisory Services, LLC | 207,794 | 102.45 | 6,988 | 120.37 | ||||
| 2025-08-04 | 13F | Atria Investments Llc | 0 | -100.00 | 0 | |||||
| 2025-08-06 | 13F | First Horizon Advisors, Inc. | 748 | 21.23 | 25 | 31.58 | ||||
| 2025-08-12 | 13F | SRS Capital Advisors, Inc. | 763 | 19.22 | 26 | 31.58 | ||||
| 2025-08-14 | 13F | Citadel Advisors Llc | 165,054 | 1,070.76 | 5,551 | 1,175.86 | ||||
| 2025-08-13 | 13F | VestGen Advisors, LLC | 272,907 | -1.09 | 9,178 | 7.65 | ||||
| 2025-08-15 | 13F | Lantern Wealth Advisors, LLC | 8,752 | 294 | ||||||
| 2025-07-28 | 13F | Harbour Investments, Inc. | 170,062 | 68.45 | 5,719 | 83.36 | ||||
| 2025-07-15 | 13F | Hartmann Taylor Wealth Management, LLC | 7,000 | 235 | ||||||
| 2025-07-11 | 13F | Trinity Wealth Management, LLC | 10,484 | 353 | ||||||
| 2025-07-24 | 13F | NavPoint Financial, Inc. | 45,253 | 452.74 | 1,522 | 503.57 | ||||
| 2025-07-22 | 13F | Oak Hill Wealth Advisors, Llc | 59,577 | 34.71 | 2,012 | 47.22 | ||||
| 2025-07-11 | 13F | LongView Wealth Management | 70,579 | 32.94 | 2,374 | 44.70 | ||||
| 2025-08-11 | 13F | Rothschild Investment Llc | 536,824 | 8.06 | 18,053 | 17.61 | ||||
| 2025-07-17 | 13F | Tempus Wealth Planning, LLC | 82,695 | 3.46 | 2,781 | 12.64 | ||||
| 2025-05-16 | 13F/A | Kestra Investment Management, LLC | 0 | -100.00 | 0 | |||||
| 2025-07-25 | 13F | LRI Investments, LLC | 22,000 | 740 | ||||||
| 2025-08-13 | 13F | Russell Investments Group, Ltd. | 78 | 3 | ||||||
| 2025-07-23 | 13F | Valmark Advisers, Inc. | 562,974 | 5.84 | 18,933 | 15.19 | ||||
| 2025-07-28 | 13F | RFG Advisory, LLC | 32,251 | 135.87 | 1,085 | 156.87 | ||||
| 2025-08-07 | 13F | Kestra Private Wealth Services, Llc | 22,786 | 766 | ||||||
| 2025-08-11 | 13F | HighTower Advisors, LLC | 50,282 | 13.41 | 1,691 | 23.45 | ||||
| 2025-08-07 | 13F | PFG Advisors | 22,023 | 14.95 | 741 | 25.00 | ||||
| 2025-08-05 | 13F | Westside Investment Management, Inc. | 11,850 | 351.43 | 399 | 391.36 | ||||
| 2025-07-14 | 13F | Armstrong Advisory Group, Inc | 0 | -100.00 | 0 | |||||
| 2025-07-30 | 13F | Cullen/frost Bankers, Inc. | 126,457 | 30.57 | 4,253 | 42.11 | ||||
| 2025-08-14 | 13F | Comerica Bank | 64,536 | 29.02 | 2,170 | 40.45 | ||||
| 2025-08-19 | 13F | Advisory Services Network, LLC | 22,850 | 760 | ||||||
| 2025-05-12 | 13F | Independent Advisor Alliance | 0 | -100.00 | 0 | |||||
| 2025-07-21 | 13F | Ameriflex Group, Inc. | 0 | -100.00 | 0 | |||||
| 2025-07-10 | 13F | Sovran Advisors, LLC | 51,662 | 213.43 | 1,745 | 250.91 | ||||
| 2025-08-01 | 13F | Envestnet Asset Management Inc | 5,842,721 | 17.89 | 196,491 | 28.30 | ||||
| 2025-08-13 | 13F | Capital International Investors | 17,350,853 | -0.01 | 583,509 | 8.83 | ||||
| 2025-08-27 | 13F/A | Brinker Capital Investments, LLC | 138,630 | 0.83 | 4,662 | 9.75 | ||||
| 2025-08-14 | 13F | Mml Investors Services, Llc | 1,125,534 | 15.54 | 38 | 23.33 | ||||
| 2025-08-04 | 13F | Pensionmark Financial Group, Llc | 37,768 | 3.04 | 1,270 | 12.19 | ||||
| 2025-08-14 | 13F | Smartleaf Asset Management LLC | 389,677 | 6.64 | 13,132 | 16.12 | ||||
| 2025-08-04 | 13F | Creative Financial Designs Inc /adv | 5,824 | 2.05 | 196 | 10.80 | ||||
| 2025-08-14 | 13F | CoreCap Advisors, LLC | 0 | -100.00 | 0 | |||||
| 2025-07-08 | 13F | Nbc Securities, Inc. | 2,368 | 318.37 | 0 | |||||
| 2025-07-18 | 13F | QTR Family Wealth, LLC | 28,311 | 15.33 | 952 | 25.59 | ||||
| 2025-08-14 | 13F | Herold Advisors, Inc. | 8,752 | 294 | ||||||
| 2025-08-01 | 13F | Signature Wealth Management Group | 16,746 | -21.20 | 563 | -14.18 | ||||
| 2025-05-09 | 13F | Beta Wealth Group, Inc. | 0 | -100.00 | 0 | |||||
| 2025-05-15 | 13F/A | Orion Portfolio Solutions, LLC | 137,488 | 12.82 | 4,248 | 17.61 | ||||
| 2025-08-04 | 13F | Continental Investors Services, Inc. | 14,721 | -2.11 | 495 | 6.68 | ||||
| 2025-08-01 | 13F | Gwn Securities Inc. | 6,419 | -67.87 | 216 | -64.99 | ||||
| 2025-08-14 | 13F | Betterment LLC | 33,604 | 1 | ||||||
| 2025-08-04 | 13F | Assetmark, Inc | 282,713 | 1.96 | 9,508 | 10.97 | ||||
| 2025-08-01 | 13F | Rossby Financial, LCC | 61 | 2 | ||||||
| 2025-07-14 | 13F | AdvisorNet Financial, Inc | 1,313 | 483.56 | 44 | 633.33 | ||||
| 2025-07-14 | 13F | Sowell Financial Services LLC | 46,832 | 376.95 | 1,575 | 419.47 | ||||
| 2025-07-30 | 13F | Bleakley Financial Group, LLC | 158,235 | 324.84 | 5,321 | 362.70 | ||||
| 2025-07-16 | 13F/A | CX Institutional | 619 | 82.06 | 0 | |||||
| 2025-08-06 | 13F | Wedbush Securities Inc | 26,696 | -41.50 | 1 | -100.00 | ||||
| 2025-08-06 | 13F | Commonwealth Equity Services, Llc | 1,898,865 | 20.31 | 64 | 31.25 | ||||
| 2025-08-14 | 13F | Stifel Financial Corp | 451,044 | 10.65 | 15,171 | 20.44 | ||||
| 2025-07-25 | 13F | M.e. Allison & Co., Inc. | 17,705 | 1.49 | 595 | 10.39 | ||||
| 2025-07-29 | 13F | Stratos Wealth Partners, LTD. | 46,380 | 276.03 | 1,560 | 309.19 | ||||
| 2025-07-22 | 13F | Confluence Wealth Services, Inc. | 1,661,858 | 5.96 | 55,888 | 16.80 | ||||
| 2025-08-14 | 13F | Sunbelt Securities, Inc. | 2,300 | 0.00 | 68 | -4.23 | ||||
| 2025-07-18 | 13F | Truist Financial Corp | 175,407 | 9.18 | 5,899 | 18.82 | ||||
| 2025-07-24 | 13F | CarsonAllaria Wealth Management, Ltd. | 0 | -100.00 | 0 | |||||
| 2025-08-12 | 13F | Insigneo Advisory Services, Llc | 15,928 | 0.00 | 536 | 8.74 | ||||
| 2025-08-13 | 13F | Jones Financial Companies Lllp | 457,991 | 131.20 | 15,434 | 151.78 | ||||
| 2025-07-28 | 13F | Mutual Advisors, LLC | 28,495 | 19.90 | 976 | 32.83 | ||||
| 2025-08-13 | 13F | Gateway Wealth Partners, LLC | 25,959 | 50.13 | 873 | 63.48 | ||||
| 2025-08-12 | 13F | Entruity Wealth, LLC | 175,917 | 5.05 | 5,916 | 14.34 | ||||
| 2025-07-03 | 13F | Arvest Investments, Inc. | 1,330 | 0.00 | 45 | 7.32 | ||||
| 2025-08-04 | 13F | Mayflower Financial Advisors, LLC | 56,484 | 1.20 | 1,900 | 10.15 | ||||
| 2025-07-25 | 13F | Envestnet Portfolio Solutions, Inc. | 134,327 | -33.14 | 4,517 | -27.23 | ||||
| 2025-08-13 | 13F | Vermillion & White Wealth Management Group, LLC | 3,593 | 2.95 | 121 | 12.15 | ||||
| 2025-07-30 | 13F | D.a. Davidson & Co. | 126,867 | 519.50 | 4,267 | 575.00 | ||||
| 2025-08-14 | 13F | Mariner, LLC | 30,664 | 5.85 | 1,031 | 15.20 | ||||
| 2025-07-24 | 13F | Endeavor Private Wealth, Inc. | 65,325 | 24.19 | 2,212 | 35.48 | ||||
| 2025-08-12 | 13F | Jacobi Capital Management LLC | 46,572 | 4.23 | 1,566 | 13.48 | ||||
| 2025-07-25 | 13F | Cwm, Llc | 6,615 | 21.58 | 0 | |||||
| 2025-08-15 | 13F | First Heartland Consultants, Inc. | 14,141 | 476 | ||||||
| 2025-08-14 | 13F | D. E. Shaw & Co., Inc. | 19,491 | 46.58 | 655 | 59.76 | ||||
| 2025-07-18 | 13F | Vicus Capital | 10,327 | 347 | ||||||
| 2025-08-13 | 13F | Northwestern Mutual Wealth Management Co | 545,726 | 44.32 | 18,353 | 57.07 | ||||
| 2025-08-08 | 13F | Avantax Advisory Services, Inc. | 295,664 | 274.50 | 9,943 | 307.67 | ||||
| 2025-07-14 | 13F | Park Avenue Securities Llc | 19,933 | 12.20 | 1 | |||||
| 2025-08-14 | 13F | Snowden Capital Advisors LLC | 9,192 | 311 | ||||||
| 2025-08-13 | 13F | Flow Traders U.s. Llc | 84,753 | 3 | ||||||
| 2025-05-15 | 13F | Perennial Investment Advisors, LLC | 0 | -100.00 | 0 |