Mga Batayang Estadistika
| Pemilik Institusional | 122 total, 122 long only, 0 short only, 0 long/short - change of 2.48% MRQ |
| Alokasi Portofolio Rata-rata | 0.0607 % - change of -16.94% MRQ |
| Saham Institusional (Jangka Panjang) | 10,226,244 (ex 13D/G) - change of 0.83MM shares 8.86% MRQ |
| Nilai Institusional (Jangka Panjang) | $ 172,870 USD ($1000) |
Kepemilikan Institusional dan Pemegang Saham
Global X Funds - Global X SuperDividend U.S. ETF (US:DIV) memiliki 122 pemilik institusional dan pemegang saham yang telah mengajukan formulir 13D/G atau 13F kepada Komisi Bursa Efek (Securities Exchange Commission/SEC). Lembaga-lembaga ini memegang total 10,226,244 saham. Pemegang saham terbesar meliputi FUKOKU MUTUAL LIFE INSURANCE Co, Morgan Stanley, AE Wealth Management LLC, LPL Financial LLC, Wells Fargo & Company/mn, Bank Of America Corp /de/, Global X Japan Co., Ltd., Wealthfront Advisers Llc, Northwestern Mutual Wealth Management Co, and Commonwealth Equity Services, Llc .
Struktur kepemilikan institusional Global X Funds - Global X SuperDividend U.S. ETF (ARCA:DIV) menunjukkan posisi terkini di perusahaan oleh institusi dan dana, serta perubahan terbaru dalam ukuran posisi. Pemegang saham utama dapat mencakup investor individu, reksa dana, dana lindung nilai, atau institusi. Jadwal 13D menunjukkan bahwa investor memegang (atau pernah memegang) lebih dari 5% saham perusahaan dan bermaksud (atau pernah bermaksud) untuk secara aktif mengejar perubahan strategi bisnis. Jadwal 13G menunjukkan investasi pasif lebih dari 5%.
The share price as of September 4, 2025 is 17.69 / share. Previously, on September 5, 2024, the share price was 18.27 / share. This represents a decline of 3.17% over that period.

Skor Sentimen Dana
Skor Sentimen Dana (sebelumnya dikenal sebagai Skor Akumulasi Kepemilikan) menemukan saham-saham yang paling banyak dibeli oleh dana. Ini adalah hasil dari model kuantitatif multi-faktor yang canggih yang mengidentifikasi perusahaan dengan tingkat akumulasi institusional tertinggi. Model penilaian menggunakan kombinasi dari total peningkatan pemilik yang diungkapkan, perubahan dalam alokasi portofolio pada pemilik tersebut, dan metrik lainnya. Angka berkisar dari 0 hingga 100, dengan angka yang lebih tinggi menunjukkan tingkat akumulasi yang lebih tinggi dibandingkan dengan perusahaan sejenisnya, dan 50 adalah rata-ratanya.
Frekuensi Pembaruan: Setiap Hari
Lihat Ownership Explorer, yang menyediakan daftar perusahaan dengan peringkat tertinggi.
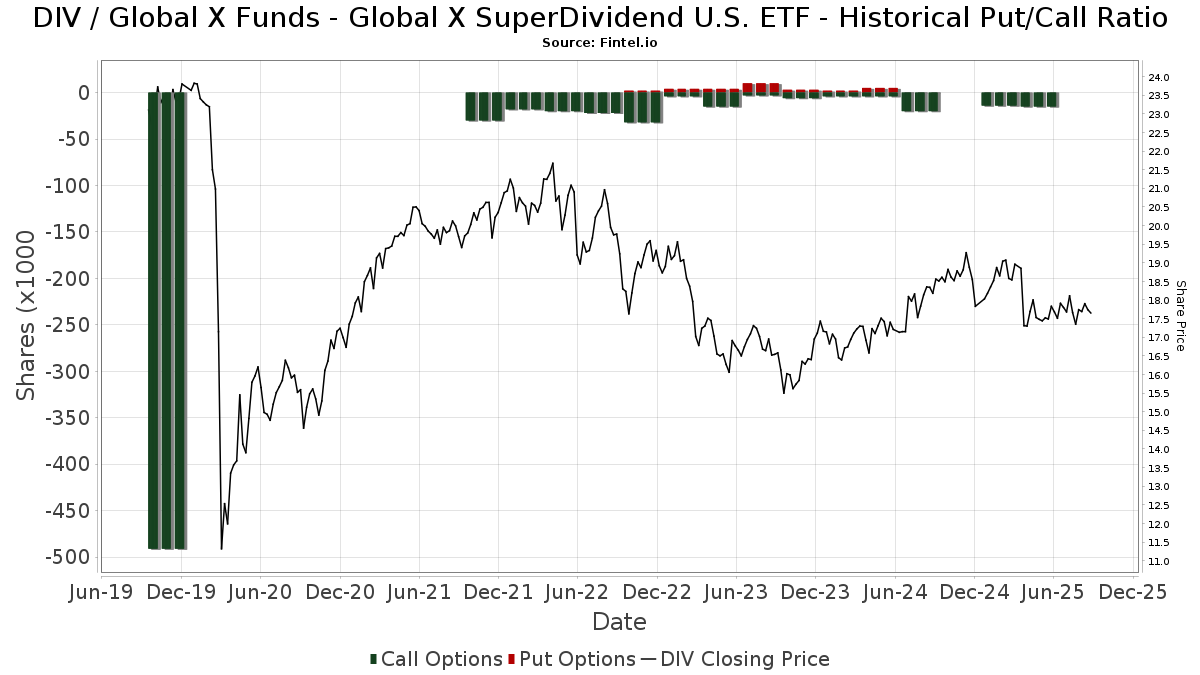
Rasio Put/Call Institusional
Selain melaporkan isu ekuitas dan utang standar, institusi dengan aset di bawah manajemen lebih dari 100 juta dolar AS juga harus mengungkapkan kepemilikan opsi put dan call mereka. Karena opsi put umumnya menunjukkan sentimen negatif, dan opsi call menunjukkan sentimen positif, kita dapat mengetahui sentimen institusional secara keseluruhan dengan memplot rasio put terhadap call. Grafik di sebelah kanan memplot rasio put/call historis untuk instrumen ini.
Menggunakan Rasio Put/Call sebagai indikator sentimen investor mengatasi salah satu kekurangan utama dari penggunaan total kepemilikan institusional, yaitu sejumlah besar aset yang dikelola diinvestasikan secara pasif untuk melacak indeks. Dana yang dikelola secara pasif biasanya tidak membeli opsi, sehingga indikator rasio put/call lebih akurat dalam melacak sentimen dana yang dikelola secara aktif.
Pengajuan 13F dan NPORT
Detail pada pengajuan 13F tersedia gratis. Detail pada pengajuan NP memerlukan keanggotaan premium. Baris berwarna hijau menunjukkan posisi baru. Baris berwarna merah menunjukkan posisi yang sudah ditutup. Klik tautan ini ikon untuk melihat riwayat transaksi selengkapnya.
Tingkatkan
untuk membuka data premium dan mengekspor ke Excel ![]() .
.
| Tanggal File | Sumber | Investor | Ketik | Presyo ng Avg (Silangan) |
Saham | Δ Saham (%) |
Dilaporkan Nilai ($1000) |
Nilai Δ (%) |
Alokasi Port (%) |
|
|---|---|---|---|---|---|---|---|---|---|---|
| 2025-08-08 | 13F | Creative Planning | 16,065 | -2.44 | 282 | -9.03 | ||||
| 2025-07-21 | 13F | Curran Financial Partners, LLC | 121,947 | -65.16 | 2,144 | -67.50 | ||||
| 2025-07-21 | 13F | Crews Bank & Trust | 7,305 | 0.00 | 128 | -6.57 | ||||
| 2025-08-14 | 13F | UBS Group AG | 40,512 | 14.95 | 712 | 7.39 | ||||
| 2025-08-11 | 13F | Private Advisor Group, LLC | 11,608 | 4.48 | 204 | -2.39 | ||||
| 2025-08-14 | 13F | Qube Research & Technologies Ltd | 303 | 10,000.00 | 5 | |||||
| 2025-07-18 | 13F | PFG Investments, LLC | 11,189 | -22.42 | 197 | -27.68 | ||||
| 2025-07-17 | 13F | Janney Montgomery Scott LLC | 35,832 | -3.84 | 1 | |||||
| 2025-07-11 | 13F | Caldwell Securities, Inc | 100 | 0.00 | 2 | 0.00 | ||||
| 2025-07-18 | 13F | Truist Financial Corp | 19,724 | -0.48 | 347 | -7.24 | ||||
| 2025-08-12 | 13F | Jpmorgan Chase & Co | 42,154 | -3.40 | 741 | -9.85 | ||||
| 2025-07-17 | 13F | C2C Wealth Management, LLC | 19,000 | 0.00 | 334 | -6.44 | ||||
| 2025-08-14 | 13F | Two Sigma Investments, Lp | 121,300 | 98.85 | 2,132 | 85.55 | ||||
| 2025-07-25 | 13F | Cwm, Llc | 16,119 | 0.00 | 0 | |||||
| 2025-08-05 | 13F | GPS Wealth Strategies Group, LLC | 4,639 | 366.23 | 82 | 350.00 | ||||
| 2025-04-30 | 13F | Slagle Financial, LLC | 0 | -100.00 | 0 | -100.00 | ||||
| 2025-04-29 | 13F | Wood Tarver Financial Group, LLC | 0 | -100.00 | 0 | |||||
| 2025-07-31 | 13F | Wealthfront Advisers Llc | 304,537 | 5.08 | 5,354 | -1.96 | ||||
| 2025-07-31 | 13F | Cambridge Investment Research Advisors, Inc. | 92,713 | -0.44 | 2 | 0.00 | ||||
| 2025-07-21 | 13F | Ntv Asset Management Llc | 24,725 | -7.48 | 435 | -13.72 | ||||
| 2025-07-21 | 13F | Ameritas Advisory Services, LLC | 2,049 | 36 | ||||||
| 2025-08-14 | 13F | Goldman Sachs Group Inc | 84,097 | -0.04 | 1,478 | -6.69 | ||||
| 2025-07-28 | 13F | Mutual Advisors, LLC | 36,840 | 23.36 | 657 | 22.80 | ||||
| 2025-08-08 | 13F | Advyzon Investment Management, LLC | 25,402 | 18.47 | 447 | 10.67 | ||||
| 2025-07-14 | 13F | AdvisorNet Financial, Inc | 646 | 0.00 | 11 | -8.33 | ||||
| 2025-08-14 | 13F | Royal Bank Of Canada | 145,222 | 22.80 | 2,553 | 14.59 | ||||
| 2025-08-06 | 13F | AE Wealth Management LLC | 999,605 | 7.93 | 17,573 | 0.71 | ||||
| 2025-08-12 | 13F | Founders Financial Alliance, LLC | 11,258 | 3.44 | 198 | -3.90 | ||||
| 2025-08-07 | 13F | Kestra Private Wealth Services, Llc | 21,415 | 24.33 | 376 | 16.05 | ||||
| 2025-07-18 | 13F | Chelsea Counsel Co | 5,350 | 46.58 | 94 | 38.24 | ||||
| 2025-07-21 | 13F | Ameriflex Group, Inc. | 367 | 0.00 | 6 | 0.00 | ||||
| 2025-08-14 | 13F | Citadel Advisors Llc | Put | 0 | -100.00 | 0 | ||||
| 2025-08-08 | 13F | Wiser Advisor Group LLC | 0 | -100.00 | 0 | |||||
| 2025-07-25 | 13F | Atria Wealth Solutions, Inc. | 0 | -100.00 | 0 | |||||
| 2025-08-04 | 13F | Creekmur Asset Management LLC | 0 | 0 | ||||||
| 2025-08-04 | 13F | Joseph P. Lucia & Associates, LLC | 15,610 | -11.21 | 274 | -17.22 | ||||
| 2025-08-12 | 13F | Park Square Financial Group, LLC | 11,068 | 4.11 | 195 | -3.00 | ||||
| 2025-08-19 | 13F | Newbridge Financial Services Group, Inc. | 1,800 | -28.57 | 32 | -34.04 | ||||
| 2025-07-24 | 13F | IFP Advisors, Inc | 4,300 | -7.27 | 76 | -13.79 | ||||
| 2025-07-30 | 13F | Patten Group, Inc. | 15,625 | 0.00 | 275 | -6.80 | ||||
| 2025-08-06 | 13F | Commonwealth Equity Services, Llc | 191,027 | 2.42 | 3 | 0.00 | ||||
| 2025-08-12 | 13F | Global Retirement Partners, LLC | 28,963 | 1.18 | 509 | -1.36 | ||||
| 2025-07-11 | 13F | Global X Japan Co., Ltd. | 424,451 | 22.92 | 7,462 | 14.70 | ||||
| 2025-08-13 | 13F | SMART Wealth LLC | 163,275 | 17.84 | 2,870 | 9.96 | ||||
| 2025-08-14 | 13F | Harwood Advisory Group, LLC | 1 | 0.00 | 0 | |||||
| 2025-07-16 | 13F | Perigon Wealth Management, LLC | 10,005 | 0.00 | 176 | -6.91 | ||||
| 2025-08-12 | 13F | BlackRock, Inc. | 188 | 2.17 | 3 | 0.00 | ||||
| 2025-07-28 | 13F | RFG Advisory, LLC | 21,149 | 0.16 | 372 | -6.55 | ||||
| 2025-08-11 | 13F | Pineridge Advisors LLC | 1,819 | 0.55 | 32 | -8.82 | ||||
| 2025-08-14 | 13F | Bank Of America Corp /de/ | 704,289 | -18.33 | 12,381 | -23.80 | ||||
| 2025-08-12 | 13F | FUKOKU MUTUAL LIFE INSURANCE Co | 1,873,000 | 26.98 | 32,927 | 18.49 | ||||
| 2025-07-09 | 13F | Triumph Capital Management | 29,515 | -0.05 | 519 | -6.83 | ||||
| 2025-08-04 | 13F | Daymark Wealth Partners, Llc | 10,789 | 0.00 | 190 | -6.90 | ||||
| 2025-08-08 | 13F | Kingsview Wealth Management, LLC | 36,417 | 10.67 | 640 | 3.39 | ||||
| 2025-08-08 | 13F | Cetera Investment Advisers | 77,466 | 12.92 | 1,362 | 5.34 | ||||
| 2025-08-14 | 13F | Sequent Planning LLC | 13,047 | 229 | ||||||
| 2025-08-12 | 13F | Proequities, Inc. | 0 | 0 | ||||||
| 2025-08-06 | 13F | Walkner Condon Financial Advisors LLC | 16,650 | 0.75 | 293 | -6.11 | ||||
| 2025-08-13 | 13F | Colonial Trust Advisors | 500 | 0.00 | 9 | -11.11 | ||||
| 2025-07-29 | 13F | Stratos Wealth Partners, LTD. | 68,423 | 2.61 | 1,203 | -4.30 | ||||
| 2025-08-14 | 13F | Stifel Financial Corp | 15,150 | -3.73 | 266 | -10.14 | ||||
| 2025-07-24 | 13F | Blair William & Co/il | 1,005 | 18 | ||||||
| 2025-05-01 | 13F | Quest 10 Wealth Builders, Inc. | 22,040 | -2.18 | 415 | 2.22 | ||||
| 2025-07-15 | 13F | FLP Wealth Management, LLC | 0 | -100.00 | 0 | |||||
| 2025-08-04 | 13F | Assetmark, Inc | 5 | 0.00 | 0 | |||||
| 2025-08-08 | 13F | SBI Securities Co., Ltd. | 7,206 | 8.46 | 127 | 0.80 | ||||
| 2025-08-08 | 13F | Fortis Group Advisors, LLC | 300 | 0.00 | 5 | 0.00 | ||||
| 2025-07-24 | 13F | Us Bancorp \de\ | 5,320 | 0.00 | 94 | -7.00 | ||||
| 2025-08-15 | 13F | Tower Research Capital LLC (TRC) | 47 | 1 | ||||||
| 2025-07-21 | 13F | Monticello Wealth Management, Llc | 10,267 | 0.00 | 180 | -6.74 | ||||
| 2025-08-15 | 13F | Morgan Stanley | 1,091,703 | 10.85 | 19,192 | 3.44 | ||||
| 2025-08-13 | 13F | Northwestern Mutual Wealth Management Co | 264,502 | 526.95 | 4,650 | 485.52 | ||||
| 2025-05-06 | 13F | Venturi Wealth Management, LLC | 0 | -100.00 | 0 | |||||
| 2025-07-14 | 13F | Wealth Advisory Solutions, LLC | 24,725 | 44.17 | 435 | 34.37 | ||||
| 2025-08-12 | 13F | SRS Capital Advisors, Inc. | 64 | 0.00 | 1 | 0.00 | ||||
| 2025-07-18 | 13F | B.O.S.S. Retirement Advisors, LLC | 100,726 | -0.36 | 1,771 | -7.04 | ||||
| 2025-08-15 | 13F | Kestra Advisory Services, LLC | 18,861 | 28.64 | 332 | 19.93 | ||||
| 2025-07-31 | 13F | Buckingham Strategic Partners | 14,145 | 0.01 | 249 | -6.77 | ||||
| 2025-07-29 | 13F | Ballast, Inc. | 15,610 | 274 | ||||||
| 2025-08-06 | 13F | Hallmark Capital Management Inc | 1 | 0.00 | 0 | |||||
| 2025-08-08 | 13F | Foundations Investment Advisors, LLC | 18,415 | 1.63 | 324 | -5.28 | ||||
| 2025-09-04 | 13F/A | Advisor Group Holdings, Inc. | 148,764 | 74.54 | 2,616 | 62.83 | ||||
| 2025-08-18 | 13F/A | National Bank Of Canada /fi/ | 4,650 | 2.20 | 82 | -4.71 | ||||
| 2025-08-14 | 13F | Mariner, LLC | 28,170 | 0.44 | 495 | -6.25 | ||||
| 2025-07-11 | 13F | Farther Finance Advisors, LLC | 22,080 | 4.28 | 388 | -2.76 | ||||
| 2025-08-14 | 13F | Fmr Llc | 2,454 | -38.14 | 43 | -41.89 | ||||
| 2025-08-14 | 13F | Sunbelt Securities, Inc. | 6,900 | -0.26 | 124 | -4.62 | ||||
| 2025-08-08 | 13F/A | Sterling Capital Management LLC | 52 | 1.96 | 1 | |||||
| 2025-08-08 | 13F | Tortoise Investment Management, LLC | 1,000 | 0.00 | 18 | -5.56 | ||||
| 2025-08-05 | 13F | Huntington National Bank | 79 | -5.95 | ||||||
| 2025-07-09 | 13F | Breakwater Investment Management | 33 | 0.00 | 1 | |||||
| 2025-08-12 | 13F | CIBC Private Wealth Group, LLC | 992 | 39.52 | 17 | 54.55 | ||||
| 2025-07-14 | 13F | Caitlin John, LLC | 22,855 | 1.88 | 402 | -4.98 | ||||
| 2025-08-06 | 13F | Wedbush Securities Inc | 35,386 | -6.96 | 1 | |||||
| 2025-07-24 | 13F | Jfs Wealth Advisors, Llc | 1,544 | 0.00 | 27 | -6.90 | ||||
| 2025-07-24 | 13F | Ronald Blue Trust, Inc. | 250 | 0.00 | 4 | 0.00 | ||||
| 2025-08-12 | 13F | Steward Partners Investment Advisory, Llc | 33,408 | 12.93 | 587 | 5.39 | ||||
| 2025-08-14 | 13F | Comerica Bank | 2,644 | 0.00 | 46 | -6.12 | ||||
| 2025-08-14 | 13F | Raymond James Financial Inc | 108,546 | -20.64 | 1,908 | -25.93 | ||||
| 2025-08-14 | 13F | Citadel Advisors Llc | Call | 15,400 | 9.22 | 271 | 1.89 | |||
| 2025-08-12 | 13F | MAI Capital Management | 947 | 0.00 | 17 | -5.88 | ||||
| 2025-08-11 | 13F | HighTower Advisors, LLC | 14,817 | 29.79 | 260 | 20.93 | ||||
| 2025-08-13 | 13F | Scotia Capital Inc. | 10,888 | 0.00 | 191 | -6.83 | ||||
| 2025-08-05 | 13F | Cherry Tree Wealth Management, LLC | 1,064 | 0.00 | 19 | -10.00 | ||||
| 2025-07-07 | 13F | Teamwork Financial Advisors, LLC | 12,388 | -0.26 | 218 | -6.87 | ||||
| 2025-08-14 | 13F | Mml Investors Services, Llc | 21,131 | 2.13 | 0 | |||||
| 2025-08-11 | 13F | Principal Securities, Inc. | 4,250 | 0.00 | 75 | -2.63 | ||||
| 2025-08-13 | 13F | Transce3nd, LLC | 4,352 | 3.20 | 77 | -3.80 | ||||
| 2025-07-21 | 13F | Mirae Asset Global Investments Co., Ltd. | 124,000 | 5.08 | 2,180 | -1.40 | ||||
| 2025-04-23 | 13F | Golden State Wealth Management, LLC | 0 | -100.00 | 0 | |||||
| 2025-08-06 | 13F | New Millennium Group LLC | 91 | 0.00 | 2 | 0.00 | ||||
| 2025-07-30 | 13F | Whittier Trust Co | 50 | 0.00 | 1 | |||||
| 2025-08-12 | 13F | J.w. Cole Advisors, Inc. | 15,456 | 272 | ||||||
| 2025-08-08 | 13F | Avantax Advisory Services, Inc. | 16,192 | -14.73 | 285 | -20.45 | ||||
| 2025-08-14 | 13F | GWM Advisors LLC | 4,858 | -0.96 | 85 | -7.61 | ||||
| 2025-07-22 | 13F | Simplicity Wealth,LLC | 27,414 | 72.77 | 482 | 61.41 | ||||
| 2025-08-14 | 13F | Susquehanna International Group, Llp | 25,718 | 452 | ||||||
| 2025-08-08 | 13F | Good Life Advisors, LLC | 23,339 | 3.62 | 410 | -3.30 | ||||
| 2025-08-11 | 13F | Citigroup Inc | 600 | 0.00 | 11 | -9.09 | ||||
| 2025-07-25 | 13F | Concord Wealth Partners | 725 | 13 | ||||||
| 2025-08-11 | 13F | TRUE Private Wealth Advisors | 12,175 | -17.73 | 214 | -23.02 | ||||
| 2025-08-01 | 13F | Envestnet Asset Management Inc | 64,596 | -2.25 | 1,136 | -8.84 | ||||
| 2025-07-23 | 13F | Eagle Strategies LLC | 39,354 | 6.99 | 692 | -0.14 | ||||
| 2025-08-14 | 13F | Arete Wealth Advisors, LLC | 0 | -100.00 | 0 | |||||
| 2025-08-13 | 13F | Jones Financial Companies Lllp | 45,727 | 24.12 | 803 | 16.38 | ||||
| 2025-07-31 | 13F | Cornerstone Management, Inc. | 11,663 | 0.00 | 205 | -6.39 | ||||
| 2025-08-11 | 13F | FSA Wealth Management LLC | 365 | 1.96 | 6 | 0.00 | ||||
| 2025-07-29 | 13F | Private Trust Co Na | 2,000 | 0.00 | 35 | -5.41 | ||||
| 2025-07-30 | 13F | LifeWealth Investments, LLC | 29,689 | 25.70 | 522 | 17.34 | ||||
| 2025-08-14 | 13F | Wells Fargo & Company/mn | 775,844 | 13.50 | 13,639 | 5.91 | ||||
| 2025-07-25 | 13F | Cypress Capital Group | 25,319 | 445 | ||||||
| 2025-07-25 | 13F | Apollon Wealth Management, LLC | 0 | -100.00 | 0 | -100.00 | ||||
| 2025-08-12 | 13F | LPL Financial LLC | 925,738 | -1.31 | 16,274 | -7.91 | ||||
| 2025-04-17 | 13F | Authentikos Wealth Advisory, LLC | 0 | -100.00 | 0 | |||||
| 2025-07-14 | 13F | Painted Porch Advisors LLC | 0 | -100.00 | 0 | |||||
| 2025-08-07 | 13F | Allworth Financial LP | 185 | -30.45 | 3 | -25.00 | ||||
| 2025-03-21 | 13F | Prostatis Group LLC | 0 | -100.00 | 0 | |||||
| 2025-08-14 | 13F | Bnp Paribas Arbitrage, Sa | 0 | -100.00 | 0 | |||||
| 2025-07-16 | 13F | Squire Investment Management Company, LLC | 14,089 | 0.00 | 248 | -6.79 |