Mga Batayang Estadistika
| Pemilik Institusional | 141 total, 141 long only, 0 short only, 0 long/short - change of -3.42% MRQ |
| Alokasi Portofolio Rata-rata | 0.1721 % - change of -9.08% MRQ |
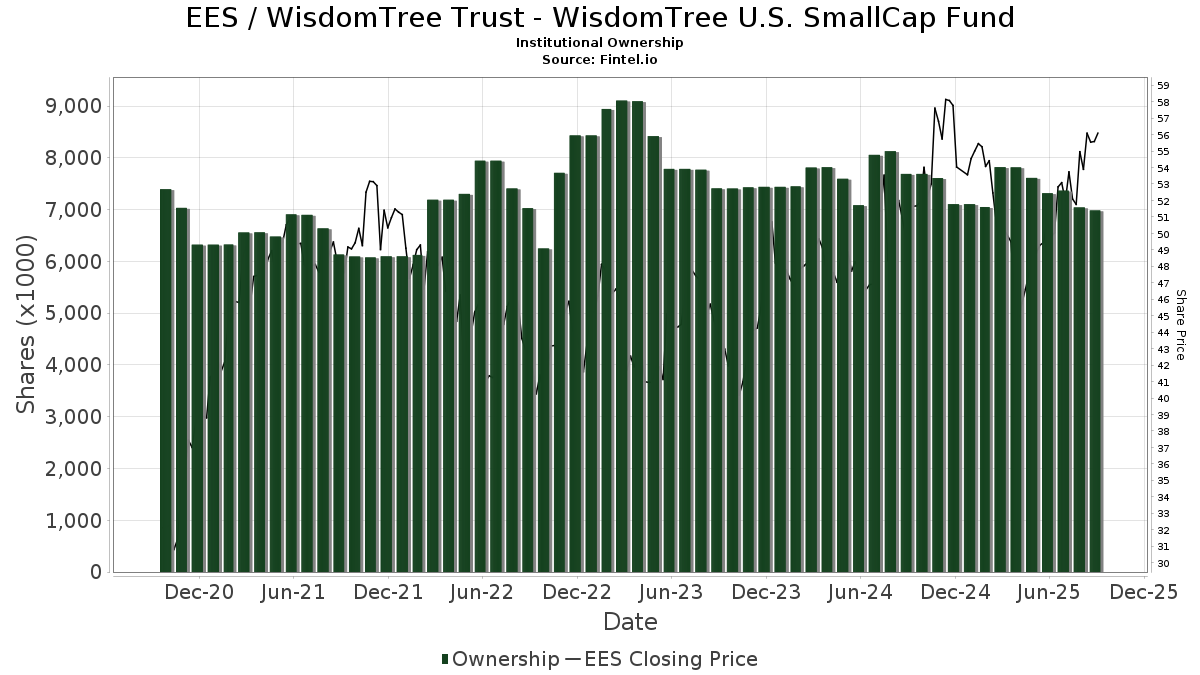
| Saham Institusional (Jangka Panjang) | 6,986,679 (ex 13D/G) - change of -0.33MM shares -4.55% MRQ |
| Nilai Institusional (Jangka Panjang) | $ 335,745 USD ($1000) |
Kepemilikan Institusional dan Pemegang Saham
WisdomTree Trust - WisdomTree U.S. SmallCap Fund (US:EES) memiliki 141 pemilik institusional dan pemegang saham yang telah mengajukan formulir 13D/G atau 13F kepada Komisi Bursa Efek (Securities Exchange Commission/SEC). Lembaga-lembaga ini memegang total 6,986,679 saham. Pemegang saham terbesar meliputi Bank Of America Corp /de/, Morgan Stanley, UBS Group AG, LPL Financial LLC, Ameriprise Financial Inc, Cetera Investment Advisers, Shore Point Advisors, LLC, Key FInancial Inc, Savant Capital, LLC, and Laurel Wealth Advisors LLC .
Struktur kepemilikan institusional WisdomTree Trust - WisdomTree U.S. SmallCap Fund (ARCA:EES) menunjukkan posisi terkini di perusahaan oleh institusi dan dana, serta perubahan terbaru dalam ukuran posisi. Pemegang saham utama dapat mencakup investor individu, reksa dana, dana lindung nilai, atau institusi. Jadwal 13D menunjukkan bahwa investor memegang (atau pernah memegang) lebih dari 5% saham perusahaan dan bermaksud (atau pernah bermaksud) untuk secara aktif mengejar perubahan strategi bisnis. Jadwal 13G menunjukkan investasi pasif lebih dari 5%.
The share price as of September 5, 2025 is 56.41 / share. Previously, on September 6, 2024, the share price was 50.02 / share. This represents an increase of 12.77% over that period.
Skor Sentimen Dana
Skor Sentimen Dana (sebelumnya dikenal sebagai Skor Akumulasi Kepemilikan) menemukan saham-saham yang paling banyak dibeli oleh dana. Ini adalah hasil dari model kuantitatif multi-faktor yang canggih yang mengidentifikasi perusahaan dengan tingkat akumulasi institusional tertinggi. Model penilaian menggunakan kombinasi dari total peningkatan pemilik yang diungkapkan, perubahan dalam alokasi portofolio pada pemilik tersebut, dan metrik lainnya. Angka berkisar dari 0 hingga 100, dengan angka yang lebih tinggi menunjukkan tingkat akumulasi yang lebih tinggi dibandingkan dengan perusahaan sejenisnya, dan 50 adalah rata-ratanya.
Frekuensi Pembaruan: Setiap Hari
Lihat Ownership Explorer, yang menyediakan daftar perusahaan dengan peringkat tertinggi.
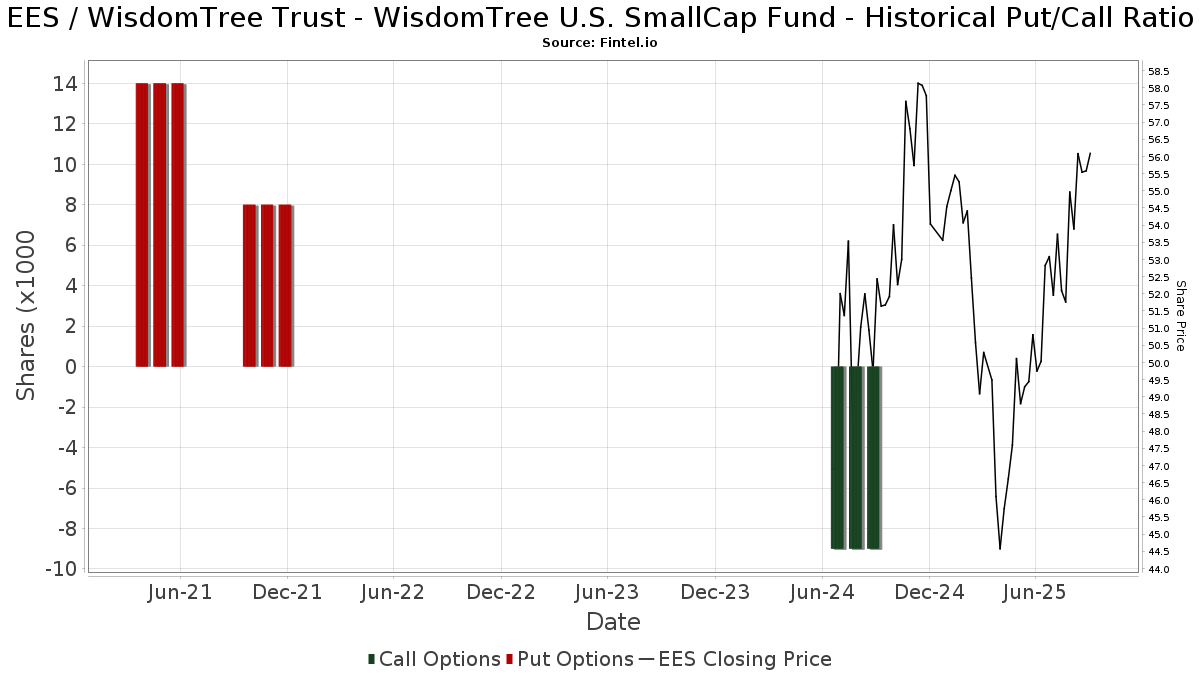
Rasio Put/Call Institusional
Selain melaporkan isu ekuitas dan utang standar, institusi dengan aset di bawah manajemen lebih dari 100 juta dolar AS juga harus mengungkapkan kepemilikan opsi put dan call mereka. Karena opsi put umumnya menunjukkan sentimen negatif, dan opsi call menunjukkan sentimen positif, kita dapat mengetahui sentimen institusional secara keseluruhan dengan memplot rasio put terhadap call. Grafik di sebelah kanan memplot rasio put/call historis untuk instrumen ini.
Menggunakan Rasio Put/Call sebagai indikator sentimen investor mengatasi salah satu kekurangan utama dari penggunaan total kepemilikan institusional, yaitu sejumlah besar aset yang dikelola diinvestasikan secara pasif untuk melacak indeks. Dana yang dikelola secara pasif biasanya tidak membeli opsi, sehingga indikator rasio put/call lebih akurat dalam melacak sentimen dana yang dikelola secara aktif.
Pengajuan 13F dan NPORT
Detail pada pengajuan 13F tersedia gratis. Detail pada pengajuan NP memerlukan keanggotaan premium. Baris berwarna hijau menunjukkan posisi baru. Baris berwarna merah menunjukkan posisi yang sudah ditutup. Klik tautan ini ikon untuk melihat riwayat transaksi selengkapnya.
Tingkatkan
untuk membuka data premium dan mengekspor ke Excel ![]() .
.
| Tanggal File | Sumber | Investor | Ketik | Presyo ng Avg (Silangan) |
Saham | Δ Saham (%) |
Dilaporkan Nilai ($1000) |
Nilai Δ (%) |
Alokasi Port (%) |
|
|---|---|---|---|---|---|---|---|---|---|---|
| 2025-08-19 | 13F | Newbridge Financial Services Group, Inc. | 375 | 0.00 | 19 | 5.56 | ||||
| 2025-07-07 | 13F | Nova Wealth Management, Inc. | 118 | 81.54 | 6 | 100.00 | ||||
| 2025-07-10 | 13F | Wealth Enhancement Advisory Services, Llc | 6,512 | -13.84 | 345 | -6.50 | ||||
| 2025-08-06 | 13F | Golden State Wealth Management, LLC | 535 | 0.19 | 27 | 3.85 | ||||
| 2025-08-05 | 13F | NewSquare Capital LLC | 47,387 | 8.51 | 2,415 | 13.23 | ||||
| 2025-07-09 | 13F | Shore Point Advisors, LLC | 277,857 | 3.67 | 14,160 | 8.17 | ||||
| 2025-07-15 | 13F | Optima Capital Llc | 24,222 | 0.04 | 1,234 | 4.40 | ||||
| 2025-07-22 | 13F | Berger Financial Group, Inc | 5,436 | 0.00 | 277 | 4.53 | ||||
| 2025-08-11 | 13F | Lowe Brockenbrough & Co Inc | 1,200 | 61 | ||||||
| 2025-08-26 | 13F | Claris Financial LLC | 16,342 | -33.43 | 833 | -37.16 | ||||
| 2025-07-22 | 13F | Team Financial Group, LLC | 2,769 | 141 | ||||||
| 2025-07-29 | 13F | Smithbridge Asset Management Inc/de | 6,591 | -84.77 | 336 | -84.15 | ||||
| 2025-08-04 | 13F | Linscomb & Williams, Inc. | 171,819 | -2.18 | 8,756 | 2.06 | ||||
| 2025-08-12 | 13F | Steward Partners Investment Advisory, Llc | 21,854 | -64.36 | 1,114 | -62.83 | ||||
| 2025-08-15 | 13F | Kestra Advisory Services, LLC | 20,427 | 8.17 | 1,041 | 12.80 | ||||
| 2025-07-29 | 13F | Chicago Partners Investment Group LLC | 7,330 | 0.26 | 394 | 13.26 | ||||
| 2025-08-14 | 13F | Smartleaf Asset Management LLC | 17,957 | 3.61 | 916 | 8.03 | ||||
| 2025-08-11 | 13F | Rothschild Investment Llc | 1,400 | 0.00 | 71 | 4.41 | ||||
| 2025-08-12 | 13F | Coston, McIsaac & Partners | 100 | 0.00 | 0 | |||||
| 2025-08-11 | 13F | HighTower Advisors, LLC | 0 | -100.00 | 0 | |||||
| 2025-08-08 | 13F | Cetera Investment Advisers | 313,673 | -1.66 | 15,985 | 2.61 | ||||
| 2025-08-11 | 13F | Covestor Ltd | 109 | 15.96 | 0 | |||||
| 2025-07-08 | 13F | Nbc Securities, Inc. | 10,125 | 2.26 | 1 | |||||
| 2025-08-14 | 13F | UBS Group AG | 720,106 | -1.88 | 36,697 | 2.38 | ||||
| 2025-07-17 | 13F | Janney Montgomery Scott LLC | 4,810 | 0.00 | 0 | |||||
| 2025-08-08 | 13F | Larson Financial Group LLC | 16,507 | 0.35 | 841 | 4.73 | ||||
| 2025-08-13 | 13F | Transce3nd, LLC | 711 | -0.70 | 36 | 5.88 | ||||
| 2025-08-13 | 13F | Cheviot Value Management, LLC | 199 | 0.00 | 10 | 11.11 | ||||
| 2025-08-12 | 13F | CIBC Private Wealth Group, LLC | 10,740 | 0.00 | 547 | 19.96 | ||||
| 2025-07-14 | 13F | S.A. Mason LLC | 9,450 | 0.00 | 482 | 4.34 | ||||
| 2025-07-23 | 13F | Indiana Trust & Investment Management CO | 2,143 | 0.00 | 109 | 4.81 | ||||
| 2025-08-06 | 13F | Prospera Financial Services Inc | 15,653 | -22.01 | 799 | -18.65 | ||||
| 2025-08-11 | 13F | NewEdge Wealth, LLC | 0 | -100.00 | 0 | |||||
| 2025-07-21 | 13F | Ameriflex Group, Inc. | 0 | -100.00 | 0 | |||||
| 2025-08-12 | 13F | LPL Financial LLC | 510,962 | 7.63 | 26,039 | 12.31 | ||||
| 2025-04-09 | 13F | Graves-Light Private Wealth Management, Inc. | 0 | -100.00 | 0 | |||||
| 2025-08-15 | 13F | Equitable Holdings, Inc. | 4,795 | 244 | ||||||
| 2025-08-14 | 13F | Qube Research & Technologies Ltd | 133 | 0.00 | 7 | 0.00 | ||||
| 2025-08-08 | 13F | Creative Planning | 26,177 | 0.42 | 1,334 | 4.79 | ||||
| 2025-05-13 | 13F | EPG Wealth Management LLC | 0 | -100.00 | 0 | -100.00 | ||||
| 2025-07-24 | 13F | Us Bancorp \de\ | 8,577 | 0.00 | 437 | 4.55 | ||||
| 2025-08-12 | 13F | PSI Advisors, LLC | 5,971 | 0.00 | 304 | 4.47 | ||||
| 2025-08-04 | 13F | Assetmark, Inc | 777 | 432.19 | 40 | 457.14 | ||||
| 2025-08-11 | 13F | Citigroup Inc | 1,839 | 9.14 | 94 | 13.41 | ||||
| 2025-07-10 | 13F | Global Financial Private Client, LLC | 0 | -100.00 | 0 | |||||
| 2025-07-22 | 13F | DAVENPORT & Co LLC | 7,158 | 57.39 | 365 | 63.96 | ||||
| 2025-08-04 | 13F | Pensionmark Financial Group, Llc | 0 | -100.00 | 0 | |||||
| 2025-08-04 | 13F | Atria Investments Llc | 39,702 | 18.29 | 2,023 | 23.43 | ||||
| 2025-08-11 | 13F | Invenio Wealth Partners Llc | 0 | -100.00 | 0 | |||||
| 2025-08-12 | 13F | Clearwater Capital Advisors, LLC | 4,230 | -1.76 | 216 | 2.38 | ||||
| 2025-07-24 | 13F | Blair William & Co/il | 12,599 | -12.26 | 642 | -8.42 | ||||
| 2025-05-28 | 13F | Intrua Financial, LLC | 0 | -100.00 | 0 | -100.00 | ||||
| 2025-07-15 | 13F | FLP Wealth Management, LLC | 0 | -100.00 | 0 | |||||
| 2025-08-14 | 13F | Mariner, LLC | 5,407 | 6.37 | 276 | 10.89 | ||||
| 2025-07-08 | 13F | Arlington Trust Co LLC | 500 | 0.00 | 25 | 4.17 | ||||
| 2025-07-24 | 13F | Financial Connections Group, Inc. | 1,350 | 0.00 | 0 | |||||
| 2025-08-12 | 13F | Laurel Wealth Advisors LLC | 214,542 | 4,996.01 | 4 | -98.05 | ||||
| 2025-07-25 | 13F | Ruedi Wealth Management, Inc. | 0 | -100.00 | 0 | |||||
| 2025-07-30 | 13F | Insight Advisors, LLC/ PA | 40,118 | 4.60 | 2,044 | 9.13 | ||||
| 2025-07-31 | 13F | Cambridge Investment Research Advisors, Inc. | 18,553 | -4.04 | 1 | |||||
| 2025-07-10 | 13F | Kmg Fiduciary Partners, Llc | 10,334 | 11.43 | 527 | 16.37 | ||||
| 2025-08-11 | 13F | Culbertson A N & Co Inc | 62,454 | -1.45 | 3,183 | 2.81 | ||||
| 2025-03-14 | 13F | Leicht Financial Planning & Wealth Management, Inc. | 0 | -100.00 | 0 | |||||
| 2025-07-15 | 13F | Fifth Third Bancorp | 0 | -100.00 | 0 | |||||
| 2025-08-11 | 13F | Private Advisor Group, LLC | 64,768 | 5.03 | 3,301 | 9.60 | ||||
| 2025-08-14 | 13F | Royal Bank Of Canada | 111,081 | -1.16 | 5,660 | 3.12 | ||||
| 2025-08-07 | 13F | Allworth Financial LP | 638 | 16.00 | 33 | 28.00 | ||||
| 2025-08-14 | 13F/A | Rockefeller Capital Management L.P. | 11,375 | 0.02 | 580 | 4.32 | ||||
| 2025-07-21 | 13F | Precedent Wealth Partners, Llc | 8,079 | 0.90 | 412 | 5.12 | ||||
| 2025-08-14 | 13F/A | Forefront Analytics, LLC | 20,571 | -20.90 | 1,048 | -17.42 | ||||
| 2025-08-08 | 13F | Hartland & Co., LLC | 751 | 38 | ||||||
| 2025-07-28 | 13F | Frazier Financial Advisors, LLC | 133 | 0.00 | 7 | 0.00 | ||||
| 2025-07-15 | 13F | World Equity Group, Inc. | 5,751 | -2.13 | 293 | 0.69 | ||||
| 2025-08-14 | 13F | Susquehanna International Group, Llp | 27,966 | -79.01 | 1,425 | -78.10 | ||||
| 2025-08-15 | 13F | Captrust Financial Advisors | 3,945 | -23.10 | 201 | -19.60 | ||||
| 2025-07-24 | 13F | Jfs Wealth Advisors, Llc | 1,813 | 0.00 | 92 | 4.55 | ||||
| 2025-08-08 | 13F | Kingsview Wealth Management, LLC | 5,210 | -1.14 | 266 | 3.11 | ||||
| 2025-05-21 | 13F/A | Geneos Wealth Management Inc. | 0 | -100.00 | 0 | -100.00 | ||||
| 2025-07-23 | 13F | Defined Financial Planning LLC | 38,586 | 17.54 | 1,993 | 24.03 | ||||
| 2025-07-07 | 13F | Horizons Wealth Management | 832 | 0.00 | 42 | 5.00 | ||||
| 2025-07-29 | 13F | Uhlmann Price Securities, Llc | 4,587 | -5.03 | 234 | -0.85 | ||||
| 2025-08-14 | 13F | Mml Investors Services, Llc | 7,734 | -11.04 | 0 | |||||
| 2025-08-11 | 13F | Howard Wealth Management, Llc | 19,255 | 0.00 | 981 | 4.36 | ||||
| 2025-08-11 | 13F | Principal Securities, Inc. | 739 | -15.93 | 38 | -21.28 | ||||
| 2025-08-19 | 13F | Asset Dedication, LLC | 3,162 | 0.00 | 161 | 4.55 | ||||
| 2025-07-24 | 13F | Ronald Blue Trust, Inc. | 2,708 | 0.00 | 138 | 4.55 | ||||
| 2025-08-14 | 13F | Ancora Advisors, LLC | 95 | 0.00 | 5 | 0.00 | ||||
| 2025-04-10 | 13F | Cathy Pareto & Associates, Inc | 0 | -100.00 | 0 | |||||
| 2025-07-28 | 13F | Capital Management Corp /va | 5,427 | 3.37 | 277 | 7.81 | ||||
| 2025-08-05 | 13F | Dunhill Financial, LLC | 62 | 0.00 | 3 | 0.00 | ||||
| 2025-08-14 | 13F | Bank Of America Corp /de/ | 769,014 | -5.23 | 39,189 | -1.12 | ||||
| 2025-08-15 | 13F | Tower Research Capital LLC (TRC) | 20 | 566.67 | 1 | |||||
| 2025-07-25 | 13F | Concurrent Investment Advisors, LLC | 14,478 | 28.19 | 738 | 33.76 | ||||
| 2025-08-06 | 13F | Columbia River Financial Group, LLC | 10,080 | 0.24 | 1 | |||||
| 2025-08-13 | 13F | Oxler Private Wealth LLC | 13,164 | -8.96 | 671 | -5.10 | ||||
| 2025-08-04 | 13F | Amplius Wealth Advisors, LLC | 144,551 | 7,366 | ||||||
| 2025-08-12 | 13F | Proequities, Inc. | 0 | 0 | ||||||
| 2025-08-14 | 13F | Betterment LLC | 9,443 | 9.80 | 0 | |||||
| 2025-08-01 | 13F | Envestnet Asset Management Inc | 113,183 | 3.72 | 5,768 | 8.22 | ||||
| 2025-05-15 | 13F | D. E. Shaw & Co., Inc. | 0 | -100.00 | 0 | |||||
| 2025-07-11 | 13F | Essex Savings Bank | 4,200 | 0.00 | 214 | 3.90 | ||||
| 2025-07-10 | 13F | Moller Financial Services | 18,442 | 0.00 | 940 | 4.33 | ||||
| 2025-08-12 | 13F | Archer Investment Corp | 0 | -100.00 | 0 | |||||
| 2025-08-12 | 13F | Global Retirement Partners, LLC | 24,890 | -90.86 | 1,268 | -91.37 | ||||
| 2025-05-19 | 13F | Heck Capital Advisors, LLC | 0 | -100.00 | 0 | -100.00 | ||||
| 2025-07-15 | 13F | Herbst Group, Llc | 29,806 | -1.97 | 1,519 | 2.22 | ||||
| 2025-08-13 | 13F | Cresset Asset Management, LLC | 7,728 | 0.00 | 394 | 4.24 | ||||
| 2025-08-12 | 13F | Jpmorgan Chase & Co | 44,080 | -15.62 | 2,246 | -11.96 | ||||
| 2025-08-14 | 13F | Ameriprise Financial Inc | 488,696 | -0.15 | 24,909 | 4.44 | ||||
| 2025-07-11 | 13F | Pinnacle Bancorp, Inc. | 0 | -100.00 | 0 | |||||
| 2025-07-25 | 13F | Means Investment Co., Inc. | 12,836 | 0.10 | 654 | 4.47 | ||||
| 2025-07-31 | 13F | Kathleen S. Wright Associates Inc. | 134,700 | -1.71 | 6,864 | 2.57 | ||||
| 2025-08-06 | 13F | Commonwealth Equity Services, Llc | 104,907 | -8.76 | 5 | 0.00 | ||||
| 2025-08-14 | 13F | Blue Capital, Inc. | 0 | -100.00 | 0 | |||||
| 2025-07-30 | 13F | Eqis Capital Management, Inc. | 4,962 | -1.70 | 253 | 2.44 | ||||
| 2025-08-14 | 13F | Fmr Llc | 6,412 | 22.23 | 327 | 27.34 | ||||
| 2025-08-05 | 13F | Claro Advisors LLC | 8,199 | 3.12 | 418 | 7.47 | ||||
| 2025-08-12 | 13F | Nemes Rush Group LLC | 9,215 | -37.70 | 470 | -35.04 | ||||
| 2025-08-13 | 13F | Jones Financial Companies Lllp | 1,144 | 12.27 | 58 | 18.37 | ||||
| 2025-08-14 | 13F | Citadel Advisors Llc | 0 | -100.00 | 0 | |||||
| 2025-08-07 | 13F | Howard Bailey Securities, Llc | 48,781 | -0.52 | 2,486 | 3.76 | ||||
| 2025-08-14 | 13F | CoreCap Advisors, LLC | 2,434 | -0.65 | 124 | 4.20 | ||||
| 2025-08-14 | 13F | Stifel Financial Corp | 46,487 | 6.99 | 2,369 | 11.59 | ||||
| 2025-07-18 | 13F | Institute for Wealth Management, LLC. | 4,290 | 0.00 | 219 | 4.31 | ||||
| 2025-07-24 | 13F | IFP Advisors, Inc | 624 | 0.00 | 32 | 3.33 | ||||
| 2025-08-06 | 13F | Modera Wealth Management, LLC | 6,821 | 0.00 | 348 | 4.20 | ||||
| 2025-08-15 | 13F | Morgan Stanley | 726,470 | -3.13 | 37,021 | 1.07 | ||||
| 2025-08-12 | 13F | O'shaughnessy Asset Management, Llc | 3,417 | 125.10 | 174 | 135.14 | ||||
| 2025-09-04 | 13F/A | Advisor Group Holdings, Inc. | 48,005 | 44.22 | 2,447 | 50.52 | ||||
| 2025-07-25 | 13F | Cwm, Llc | 12,502 | 1.22 | 1 | |||||
| 2025-08-14 | 13F | Warren Averett Asset Management, LLC | 79,765 | 0.00 | 4,065 | 4.34 | ||||
| 2025-08-14 | 13F | Wiley Bros.-aintree Capital, Llc | 34,555 | 0.00 | 1,761 | 4.14 | ||||
| 2025-08-27 | NP | FFOX - FundX Future Fund Opportunities ETF | 1,078 | 55 | ||||||
| 2025-08-14 | 13F | Jane Street Group, Llc | 9,970 | 508 | ||||||
| 2025-08-07 | 13F | Addison Advisors LLC | 225 | 0.00 | 11 | 10.00 | ||||
| 2025-05-08 | 13F | FSA Advisors, Inc. | 0 | -100.00 | 0 | |||||
| 2025-08-14 | 13F | Colony Group, LLC | 3,975 | -37.15 | 203 | -34.42 | ||||
| 2025-05-01 | 13F | Quest 10 Wealth Builders, Inc. | 46 | -50.00 | 2 | -50.00 | ||||
| 2025-08-14 | 13F | Talon Private Wealth, LLC | 168 | 9 | ||||||
| 2025-08-13 | 13F | Beacon Pointe Advisors, LLC | 0 | -100.00 | 0 | |||||
| 2025-08-18 | 13F | Tyler-Stone Wealth Management | 18,197 | 0.12 | 927 | 4.51 | ||||
| 2025-04-29 | 13F | U.S. Capital Wealth Advisors, LLC | 0 | -100.00 | 0 | |||||
| 2025-08-07 | 13F | Parkside Financial Bank & Trust | 0 | -100.00 | 0 | |||||
| 2025-04-25 | 13F | Joel Isaacson & Co., LLC | 0 | -100.00 | 0 | |||||
| 2025-08-19 | 13F | Advisory Services Network, LLC | 5,167 | -2.18 | 266 | 3.50 | ||||
| 2025-05-12 | 13F | First Western Trust Bank | 0 | -100.00 | 0 | |||||
| 2025-08-14 | 13F | Goldman Sachs Group Inc | 15,029 | 0.00 | 766 | 4.22 | ||||
| 2025-05-07 | 13F | Motco | 0 | -100.00 | 0 | |||||
| 2025-08-13 | 13F | Luminist Capital LLC | 7 | 0.00 | 0 | |||||
| 2025-08-13 | 13F | Northwestern Mutual Wealth Management Co | 821 | 22.90 | 42 | 28.13 | ||||
| 2025-08-14 | 13F | Two Sigma Investments, Lp | 45,700 | -43.58 | 2,329 | -41.15 | ||||
| 2025-05-08 | 13F | Wellington Shields Capital Management, LLC | 0 | -100.00 | 0 | -100.00 | ||||
| 2025-08-14 | 13F | Raymond James Financial Inc | 106,755 | -0.52 | 5,440 | 3.80 | ||||
| 2025-08-14 | 13F | Comerica Bank | 2,905 | -20.13 | 148 | -16.38 | ||||
| 2025-08-14 | 13F | Wells Fargo & Company/mn | 124,571 | 73.19 | 6,348 | 80.75 | ||||
| 2025-07-10 | 13F | Envision Financial LLC | 4,632 | 0.00 | 236 | 4.42 | ||||
| 2025-07-28 | 13F | Harbour Investments, Inc. | 3,712 | 11.17 | 189 | 15.95 | ||||
| 2025-07-29 | 13F | Crux Wealth Advisors | 4,988 | -65.58 | 254 | -64.07 | ||||
| 2025-07-07 | 13F | Wilson & Boucher Capital Management, LLC | 5,400 | 0.00 | 275 | 4.56 | ||||
| 2025-08-08 | 13F | Pnc Financial Services Group, Inc. | 1,605 | 0.00 | 82 | 3.85 | ||||
| 2025-08-05 | 13F | Key FInancial Inc | 255,510 | -19.37 | 13,021 | -15.87 | ||||
| 2025-08-06 | 13F | Savant Capital, LLC | 215,894 | -7.90 | 11,002 | -3.90 | ||||
| 2025-08-04 | 13F | Flagship Harbor Advisors, Llc | 14,957 | 1.78 | 762 | 6.28 | ||||
| 2025-08-13 | 13F | Continuum Advisory, LLC | 0 | -100.00 | 0 | |||||
| 2025-08-14 | 13F | Essential Planning, LLC. | 7,803 | 0.01 | 398 | 4.20 | ||||
| 2025-07-02 | 13F | Lvm Capital Management Ltd/mi | 4,326 | -0.69 | 0 | |||||
| 2025-07-28 | 13F | RFG Advisory, LLC | 5,912 | -6.34 | 301 | -2.27 | ||||
| 2025-08-06 | 13F | AE Wealth Management LLC | 2,309 | -5.02 | 118 | -0.85 | ||||
| 2025-07-17 | 13F | New Perspectives, Inc | 25,905 | -16.30 | 1,320 | -12.64 | ||||
| 2025-07-10 | 13F | Exchange Traded Concepts, Llc | 669 | 34 | ||||||
| 2025-08-08 | 13F | Avantax Advisory Services, Inc. | 48,331 | -0.45 | 2,463 | 3.84 | ||||
| 2025-08-04 | 13F | Savvy Advisors, Inc. | 5,908 | 0.03 | 301 | 4.51 |
Other Listings
| MX:EES |