Mga Batayang Estadistika
| Pemilik Institusional | 173 total, 173 long only, 0 short only, 0 long/short - change of 21.83% MRQ |
| Alokasi Portofolio Rata-rata | 0.9328 % - change of -17.12% MRQ |
| Saham Institusional (Jangka Panjang) | 36,067,627 (ex 13D/G) - change of 8.34MM shares 30.09% MRQ |
| Nilai Institusional (Jangka Panjang) | $ 1,742,957 USD ($1000) |
Kepemilikan Institusional dan Pemegang Saham
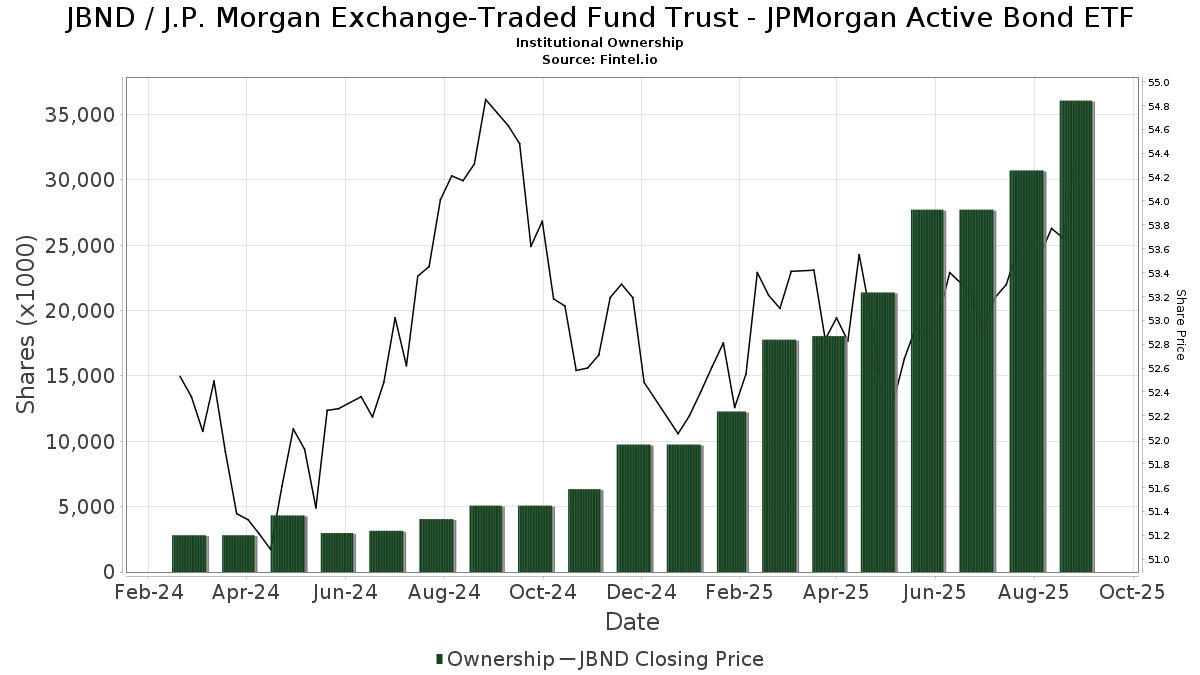
J.P. Morgan Exchange-Traded Fund Trust - JPMorgan Active Bond ETF (US:JBND) memiliki 173 pemilik institusional dan pemegang saham yang telah mengajukan formulir 13D/G atau 13F kepada Komisi Bursa Efek (Securities Exchange Commission/SEC). Lembaga-lembaga ini memegang total 36,067,627 saham. Pemegang saham terbesar meliputi LPL Financial LLC, Cetera Investment Advisers, Diversified Portfolios, Inc., Envestnet Asset Management Inc, Baldwin Brothers Inc/ma, Berger Financial Group, Inc, IAG Wealth Partners, LLC, Royal Bank Of Canada, Cwm, Llc, and Mml Investors Services, Llc .
Struktur kepemilikan institusional J.P. Morgan Exchange-Traded Fund Trust - JPMorgan Active Bond ETF (NYSE:JBND) menunjukkan posisi terkini di perusahaan oleh institusi dan dana, serta perubahan terbaru dalam ukuran posisi. Pemegang saham utama dapat mencakup investor individu, reksa dana, dana lindung nilai, atau institusi. Jadwal 13D menunjukkan bahwa investor memegang (atau pernah memegang) lebih dari 5% saham perusahaan dan bermaksud (atau pernah bermaksud) untuk secara aktif mengejar perubahan strategi bisnis. Jadwal 13G menunjukkan investasi pasif lebih dari 5%.
The share price as of September 5, 2025 is 54.12 / share. Previously, on September 9, 2024, the share price was 54.61 / share. This represents a decline of 0.90% over that period.
Skor Sentimen Dana
Skor Sentimen Dana (sebelumnya dikenal sebagai Skor Akumulasi Kepemilikan) menemukan saham-saham yang paling banyak dibeli oleh dana. Ini adalah hasil dari model kuantitatif multi-faktor yang canggih yang mengidentifikasi perusahaan dengan tingkat akumulasi institusional tertinggi. Model penilaian menggunakan kombinasi dari total peningkatan pemilik yang diungkapkan, perubahan dalam alokasi portofolio pada pemilik tersebut, dan metrik lainnya. Angka berkisar dari 0 hingga 100, dengan angka yang lebih tinggi menunjukkan tingkat akumulasi yang lebih tinggi dibandingkan dengan perusahaan sejenisnya, dan 50 adalah rata-ratanya.
Frekuensi Pembaruan: Setiap Hari
Lihat Ownership Explorer, yang menyediakan daftar perusahaan dengan peringkat tertinggi.
Rasio Put/Call Institusional
Selain melaporkan isu ekuitas dan utang standar, institusi dengan aset di bawah manajemen lebih dari 100 juta dolar AS juga harus mengungkapkan kepemilikan opsi put dan call mereka. Karena opsi put umumnya menunjukkan sentimen negatif, dan opsi call menunjukkan sentimen positif, kita dapat mengetahui sentimen institusional secara keseluruhan dengan memplot rasio put terhadap call. Grafik di sebelah kanan memplot rasio put/call historis untuk instrumen ini.
Menggunakan Rasio Put/Call sebagai indikator sentimen investor mengatasi salah satu kekurangan utama dari penggunaan total kepemilikan institusional, yaitu sejumlah besar aset yang dikelola diinvestasikan secara pasif untuk melacak indeks. Dana yang dikelola secara pasif biasanya tidak membeli opsi, sehingga indikator rasio put/call lebih akurat dalam melacak sentimen dana yang dikelola secara aktif.
Pengajuan 13F dan NPORT
Detail pada pengajuan 13F tersedia gratis. Detail pada pengajuan NP memerlukan keanggotaan premium. Baris berwarna hijau menunjukkan posisi baru. Baris berwarna merah menunjukkan posisi yang sudah ditutup. Klik tautan ini ikon untuk melihat riwayat transaksi selengkapnya.
Tingkatkan
untuk membuka data premium dan mengekspor ke Excel ![]() .
.
| Tanggal File | Sumber | Investor | Ketik | Presyo ng Avg (Silangan) |
Saham | Δ Saham (%) |
Dilaporkan Nilai ($1000) |
Nilai Δ (%) |
Alokasi Port (%) |
|
|---|---|---|---|---|---|---|---|---|---|---|
| 2025-08-01 | 13F | Gwn Securities Inc. | 21,342 | -8.40 | 1,145 | -8.11 | ||||
| 2025-08-14 | 13F | Aqr Capital Management Llc | 14,036 | -32.17 | 752 | -32.07 | ||||
| 2025-07-31 | 13F | MN Wealth Advisors, LLC | 15,486 | -3.74 | 830 | -3.60 | ||||
| 2025-08-05 | 13F | Sigma Planning Corp | 60,046 | 3,218 | ||||||
| 2025-07-08 | 13F | Gallacher Capital Management LLC | 106,630 | 3.27 | 5,714 | 3.42 | ||||
| 2025-08-08 | 13F | Larson Financial Group LLC | 379,409 | 69.37 | 20,333 | 69.59 | ||||
| 2025-07-15 | 13F | Garrett Investment Advisors LLC | 254,980 | -16.81 | 13,664 | -16.70 | ||||
| 2025-05-06 | 13F | Lifeworks Advisors, LLC | 0 | -100.00 | 0 | -100.00 | ||||
| 2025-08-11 | 13F | Private Advisor Group, LLC | 505,074 | 668.64 | 27,067 | 669.80 | ||||
| 2025-08-05 | 13F | AGH Wealth Advisors, LLC | 118,797 | 4.94 | 6,367 | 5.08 | ||||
| 2025-08-05 | 13F | BEAM Asset Management, LLC | 39,793 | 235.49 | 2,133 | 236.28 | ||||
| 2025-08-11 | 13F | NewEdge Wealth, LLC | 424,089 | 11,146.06 | 22,723 | 11,204.48 | ||||
| 2025-08-04 | 13F | IFG Advisory, LLC | 63,621 | 325.44 | 3,409 | 326.13 | ||||
| 2025-08-11 | 13F | Diversified Portfolios, Inc. | 1,625,209 | 9.04 | 87,095 | 9.18 | ||||
| 2025-07-29 | 13F | Pinnacle Wealth Management, LLC | 236,927 | 24.30 | 12,697 | 24.46 | ||||
| 2025-05-14 | 13F | Susquehanna International Group, Llp | 0 | -100.00 | 0 | |||||
| 2025-07-28 | 13F | Essex LLC | 36,400 | 1,951 | ||||||
| 2025-08-15 | 13F | High Falls Advisors, Inc | 3,895 | 209 | ||||||
| 2025-07-18 | 13F | Truist Financial Corp | 22,051 | 145.26 | 1,182 | 145.53 | ||||
| 2025-08-14 | 13F | Atomi Financial Group, Inc. | 5,468 | 293 | ||||||
| 2025-08-06 | 13F | Vestmark Advisory Solutions, Inc. | 35,213 | 1,887 | ||||||
| 2025-08-12 | 13F | Vawter Financial, Ltd. | 14,098 | -84.97 | 756 | -84.96 | ||||
| 2025-08-07 | 13F | Parkside Financial Bank & Trust | 450 | 24 | ||||||
| 2025-08-21 | 13F | Aveo Capital Partners, LLC | 0 | -100.00 | 0 | |||||
| 2025-07-09 | 13F | Fermata Advisors, LLC | 43,291 | -87.01 | 2,320 | -87.00 | ||||
| 2025-05-16 | 13F | Coordinated Financial Services, Inc./CO | 7,851 | 420 | ||||||
| 2025-08-07 | 13F | Compass Financial Group, Inc. | 60,634 | -0.19 | 3,249 | -0.06 | ||||
| 2025-08-11 | 13F | Summit Wealth Partners, LLC | 9,596 | 514 | ||||||
| 2025-07-15 | 13F | Avaii Wealth Management, Llc | 22,700 | -2.66 | 1,217 | -2.56 | ||||
| 2025-08-12 | 13F | Proequities, Inc. | 0 | 0 | ||||||
| 2025-07-11 | 13F | Bond & Devick Financial Network, Inc. | 4,060 | 0.00 | 218 | 0.00 | ||||
| 2025-07-21 | 13F | Ascent Group, LLC | 17,380 | 10.03 | 931 | 10.18 | ||||
| 2025-04-28 | 13F | Financial Advocates Investment Management | 0 | -100.00 | 0 | |||||
| 2025-07-23 | 13F | Defined Financial Planning LLC | 62,911 | 3,321 | ||||||
| 2025-07-25 | 13F | Means Investment Co., Inc. | 364,117 | 1.70 | 19,513 | 1.84 | ||||
| 2025-08-08 | 13F | Kingsview Wealth Management, LLC | 4,279 | 229 | ||||||
| 2025-07-25 | 13F | Envestnet Portfolio Solutions, Inc. | 4,151 | 222 | ||||||
| 2025-07-30 | 13F | Bleakley Financial Group, LLC | 29,542 | 1,583 | ||||||
| 2025-08-13 | 13F | Cary Street Partners Financial Llc | 1,925 | 414.71 | 103 | 415.00 | ||||
| 2025-08-01 | 13F | Ashton Thomas Private Wealth, LLC | 49,914 | 22.90 | 2,675 | 23.06 | ||||
| 2025-08-14 | 13F | Mariner, LLC | 183,168 | 20.79 | 9,816 | 20.95 | ||||
| 2025-07-25 | 13F | Total Clarity Wealth Management, Inc. | 11,400 | 15.28 | 611 | 18.22 | ||||
| 2025-07-30 | 13F | D.a. Davidson & Co. | 288,528 | 7.32 | 15,462 | 7.46 | ||||
| 2025-08-11 | 13F | Advisor Resource Council | 0 | -100.00 | 0 | |||||
| 2025-07-23 | 13F | WESPAC Advisors, LLC | 51,762 | 911.77 | 2,774 | 915.75 | ||||
| 2025-08-20 | 13F/A | Coppell Advisory Solutions LLC | 11,763 | 628 | ||||||
| 2025-07-17 | 13F | Sterling Investment Advisors, Ltd. | 21,810 | 9.27 | 1,169 | 9.36 | ||||
| 2025-08-04 | 13F | Spire Wealth Management | 33 | 3.12 | 2 | 0.00 | ||||
| 2025-07-09 | 13F | Pallas Capital Advisors LLC | 612,640 | -2.47 | 32,831 | -2.34 | ||||
| 2025-08-04 | 13F | Assetmark, Inc | 1,024 | 55 | ||||||
| 2025-07-16 | 13F | Beaumont Financial Advisors, LLC | 13,323 | 1.77 | 714 | 1.86 | ||||
| 2025-07-28 | 13F | Axxcess Wealth Management, Llc | 141,567 | 174.94 | 7,587 | 175.35 | ||||
| 2025-08-11 | 13F | Principal Securities, Inc. | 1,388 | 74 | ||||||
| 2025-08-14 | 13F | Bank Of America Corp /de/ | 346,945 | 18,593 | ||||||
| 2025-08-12 | 13F | Jpmorgan Chase & Co | 570,031 | 9.06 | 30,548 | 9.20 | ||||
| 2025-08-12 | 13F | Steward Partners Investment Advisory, Llc | 227 | 180.25 | 12 | 200.00 | ||||
| 2025-09-04 | 13F/A | Advisor Group Holdings, Inc. | 177,922 | 24.35 | 9,535 | 24.51 | ||||
| 2025-08-05 | 13F | Beckerman Institutional, LLC | 4,234 | 0.07 | 0 | |||||
| 2025-07-25 | 13F | Yarger Wealth Strategies, Llc | 92,505 | -5.95 | 4,957 | -5.81 | ||||
| 2025-07-17 | 13F | KWB Wealth | 106,932 | 95.28 | 5,723 | 100.00 | ||||
| 2025-08-12 | 13F | Archer Investment Corp | 21,693 | 135.61 | 1,163 | 136.18 | ||||
| 2025-07-18 | 13F | Cooper Financial Group | 107,522 | -1.52 | 5,762 | -1.39 | ||||
| 2025-08-05 | 13F | Aurdan Capital Management, LLC | 17,185 | 19.33 | 921 | 19.48 | ||||
| 2025-04-23 | 13F | Golden State Wealth Management, LLC | 0 | -100.00 | 0 | |||||
| 2025-07-23 | 13F | Prime Capital Investment Advisors, LLC | 26,303 | 1,410 | ||||||
| 2025-08-08 | 13F/A | Prospect Financial Services LLC | 4,135 | 222 | ||||||
| 2025-08-14 | 13F | Mml Investors Services, Llc | 934,225 | 20.39 | 50 | 21.95 | ||||
| 2025-07-08 | 13F | Parallel Advisors, LLC | 84,463 | -0.99 | 4,526 | -0.85 | ||||
| 2025-08-14 | 13F | Stifel Financial Corp | 10,617 | 569 | ||||||
| 2025-08-12 | 13F | Eldridge Investment Advisors, Inc. | 201,405 | 164.85 | 10,755 | 164.29 | ||||
| 2025-08-06 | 13F | Legacy Wealth Managment, LLC/ID | 41,462 | 7.27 | 2,222 | 7.40 | ||||
| 2025-08-08 | 13F | Fortis Group Advisors, LLC | 15,034 | 802 | ||||||
| 2025-07-21 | 13F | Cornell Pochily Investment Advisors, Inc. | 0 | -100.00 | 0 | |||||
| 2025-08-14 | 13F | GWM Advisors LLC | 72,915 | -2.62 | 3,908 | -2.50 | ||||
| 2025-07-15 | 13F | LVZ Advisors, Inc. | 920,066 | 0.79 | 49,306 | 0.92 | ||||
| 2025-07-16 | 13F | ORG Partners LLC | 12,304 | 657 | ||||||
| 2025-08-08 | 13F | Atlantic Trust, LLC | 56 | -30.00 | 3 | -25.00 | ||||
| 2025-07-24 | 13F | Jfs Wealth Advisors, Llc | 1,889 | 0.00 | 101 | 0.00 | ||||
| 2025-08-06 | 13F | Prospera Financial Services Inc | 29,935 | 16.42 | 1,604 | 16.57 | ||||
| 2025-08-13 | 13F | Baird Financial Group, Inc. | 112,727 | 1.70 | 6,041 | 1.84 | ||||
| 2025-08-13 | 13F | Rosenblum Silverman Sutton S F Inc /ca | 83,010 | 38.69 | 4,449 | 38.87 | ||||
| 2025-07-28 | 13F | Evernest Financial Advisors, LLC | 41,939 | 2,248 | ||||||
| 2025-05-15 | 13F | Two Sigma Securities, Llc | 0 | -100.00 | 0 | -100.00 | ||||
| 2025-07-14 | 13F | Cobblestone Asset Management LLC | 195,775 | -11.53 | 10,492 | -11.42 | ||||
| 2025-08-07 | 13F | Nwam Llc | 4,404 | 235 | ||||||
| 2025-08-06 | 13F | Innealta Capital, Llc | 44,591 | -87.85 | 2,390 | -87.83 | ||||
| 2025-08-15 | 13F | Kestra Advisory Services, LLC | 6,078 | 35.19 | 326 | 35.42 | ||||
| 2025-07-21 | 13F | Mattern Capital Management, Llc | 104,228 | 5,586 | ||||||
| 2025-08-14 | 13F | Vienna Asset Management LLC | 40,577 | 20.76 | 2,175 | 20.91 | ||||
| 2025-08-13 | 13F | VestGen Advisors, LLC | 236,931 | 23.50 | 12,709 | 23.78 | ||||
| 2025-08-06 | 13F | Commonwealth Equity Services, Llc | 932,398 | 16.84 | 50 | 16.67 | ||||
| 2025-08-12 | 13F | Resolute Wealth Strategies, LLC | 5,856 | 51.87 | 314 | 51.94 | ||||
| 2025-07-10 | 13F | Sovran Advisors, LLC | 75,302 | 3,990 | ||||||
| 2025-07-24 | 13F | Coordinated Financial Services, Inc. | 7,851 | 421 | ||||||
| 2025-08-08 | 13F | Pnc Financial Services Group, Inc. | 0 | -100.00 | 0 | |||||
| 2025-08-06 | 13F | Quadrant Private Wealth Management, LLC | 4,900 | 22.50 | 263 | 22.43 | ||||
| 2025-08-06 | 13F | AE Wealth Management LLC | 11,221 | 601 | ||||||
| 2025-04-28 | 13F | Strategic Financial Concepts, LLC | 0 | -100.00 | 0 | -100.00 | ||||
| 2025-07-17 | 13F | Janney Montgomery Scott LLC | 532,384 | 4.85 | 29 | 3.70 | ||||
| 2025-07-21 | 13F | Ameriflex Group, Inc. | 932 | -14.57 | 50 | -15.52 | ||||
| 2025-08-14 | 13F | Integrated Wealth Concepts LLC | 83,883 | 47.14 | 4,495 | 47.33 | ||||
| 2025-07-28 | 13F | RFG Advisory, LLC | 41,181 | 5.49 | 2,207 | 5.60 | ||||
| 2025-08-08 | 13F/A | Ignite Planners, LLC | 4,156 | 220 | ||||||
| 2025-05-15 | 13F | Old Mission Capital Llc | 0 | -100.00 | 0 | -100.00 | ||||
| 2025-08-07 | 13F | Sollinda Capital Management LLC | 41,810 | 2,241 | ||||||
| 2025-08-11 | 13F | Perennial Investment Advisors, LLC | 0 | -100.00 | 0 | |||||
| 2025-08-11 | 13F | Regal Investment Advisors LLC | 11,851 | 1.80 | 635 | 1.93 | ||||
| 2025-08-13 | 13F | Northwestern Mutual Wealth Management Co | 503 | -67.15 | 27 | -67.90 | ||||
| 2025-07-28 | 13F | SFG Wealth Management, LLC. | 0 | -100.00 | 0 | |||||
| 2025-08-13 | 13F | IAG Wealth Partners, LLC | 991,378 | -8.23 | 53,128 | -8.11 | ||||
| 2025-07-10 | 13F | Guided Capital Wealth Management, LLC | 128,188 | -3.69 | 6,870 | -3.57 | ||||
| 2025-08-01 | 13F/A | GGM Financials LLC | 12,078 | 91.99 | 647 | 92.56 | ||||
| 2025-07-31 | 13F | Insight Wealth Partners, LLC | 94,436 | 7.39 | 5,061 | 7.52 | ||||
| 2025-07-29 | 13F | Latitude Advisors, LLC | 4,569 | 245 | ||||||
| 2025-07-31 | 13F | Cambridge Investment Research Advisors, Inc. | 116,289 | 9.67 | 6 | 20.00 | ||||
| 2025-08-14 | 13F | Ruggaard & Associates LLC | 227,167 | 0.06 | 12,174 | 0.18 | ||||
| 2025-07-22 | 13F | Sutton Place Investors Llc | 7,087 | -5.28 | 380 | -5.25 | ||||
| 2025-07-25 | 13F | Cwm, Llc | 978,086 | 834.19 | 52 | 940.00 | ||||
| 2025-08-08 | 13F | Intrua Financial, LLC | 657,211 | -1.47 | 35,220 | -1.34 | ||||
| 2025-07-24 | 13F | Robertson Stephens Wealth Management, LLC | 15,134 | 811 | ||||||
| 2025-07-24 | 13F | Baldwin Brothers Inc/ma | 1,343,741 | -0.62 | 72,011 | -0.49 | ||||
| 2025-07-24 | 13F | Us Bancorp \de\ | 26,168 | 47.11 | 1,402 | 47.27 | ||||
| 2025-05-12 | 13F | Independent Advisor Alliance | 0 | -100.00 | 0 | |||||
| 2025-08-14 | 13F | Fmr Llc | 9 | 12.50 | 0 | |||||
| 2025-07-29 | 13F | Citizens Business Bank | 199,665 | 10,700 | ||||||
| 2025-08-14 | 13F | Jane Street Group, Llc | 203,111 | -16.00 | 10,885 | -15.90 | ||||
| 2025-07-30 | 13F | Wbh Advisory Inc | 90,445 | 816.36 | 4,847 | 817.80 | ||||
| 2025-08-08 | 13F | Royal Harbor Partners, LLC | 166,166 | 0.92 | 8,905 | 1.04 | ||||
| 2025-08-13 | 13F | Cary Street Partner Investment Advisory Llc | 3,506 | -24.75 | 188 | -24.90 | ||||
| 2025-08-25 | 13F | Silverlake Wealth Management Llc | 34,505 | 6.77 | 1,849 | 6.94 | ||||
| 2025-07-31 | 13F | Opes Wealth Management LLC | 170,970 | 10.06 | 9,162 | 10.21 | ||||
| 2025-08-08 | 13F | OmniStar Financial Group, Inc. | 53,937 | 16.34 | 2,890 | 16.34 | ||||
| 2025-08-28 | NP | ICSIX - Dynamic U.S. Opportunity Fund Class I | 6,087 | -98.24 | 326 | -98.24 | ||||
| 2025-07-08 | 13F | Goldstone Financial Group, LLC | 154,474 | -43.21 | 8,213 | -43.58 | ||||
| 2025-07-28 | 13F | Harbour Investments, Inc. | 2,890 | 21.48 | 155 | 21.26 | ||||
| 2025-07-24 | 13F | Ronald Blue Trust, Inc. | 19,718 | 42.52 | 1,057 | 42.70 | ||||
| 2025-08-11 | 13F | HighTower Advisors, LLC | 283,186 | 9.32 | 15,176 | 9.46 | ||||
| 2025-08-14 | 13F | CoreCap Advisors, LLC | 102 | 5 | ||||||
| 2025-08-18 | 13F | Tyler-Stone Wealth Management | 102,707 | 2.02 | 5,504 | 2.15 | ||||
| 2025-05-16 | 13F | American Trust | 0 | -100.00 | 0 | |||||
| 2025-07-28 | 13F | CGC Financial Services, LLC | 443,166 | 23,749 | ||||||
| 2025-07-07 | 13F | Centurion Wealth Management LLC | 183,158 | -6.48 | 9,815 | -4.08 | ||||
| 2025-07-22 | 13F | Berger Financial Group, Inc | 1,266,953 | 1.28 | 67,896 | 1.41 | ||||
| 2025-07-22 | 13F | Cedar Mountain Advisors, LLC | 53,096 | -2.84 | 2,845 | -2.70 | ||||
| 2025-07-28 | 13F | Sagespring Wealth Partners, Llc | 368,452 | 19,745 | ||||||
| 2025-08-14 | 13F | Goldman Sachs Group Inc | 0 | -100.00 | 0 | |||||
| 2025-08-04 | 13F | Northwest Financial Advisors | 41,915 | 3.41 | 2,246 | 3.55 | ||||
| 2025-07-15 | 13F | Foster Victor Wealth Advisors, LLC | 49,975 | 2,659 | ||||||
| 2025-08-18 | 13F | Geneos Wealth Management Inc. | 2,120 | 107.44 | 114 | 109.26 | ||||
| 2025-07-25 | 13F | Atria Wealth Solutions, Inc. | 0 | -100.00 | 0 | |||||
| 2025-08-14 | 13F | Visionary Wealth Advisors | 6,183 | 331 | ||||||
| 2025-08-14 | 13F | EP Wealth Advisors, Inc. | 0 | -100.00 | 0 | |||||
| 2025-04-25 | 13F | MidAtlantic Capital Management, Inc. | 0 | -100.00 | 0 | |||||
| 2025-08-04 | 13F | Savvy Advisors, Inc. | 205,026 | 10,987 | ||||||
| 2025-08-12 | 13F | Martin Worley Group | 89,954 | 15.39 | 4,821 | 15.53 | ||||
| 2025-08-11 | 13F | Forge Financial Services LLC | 0 | -100.00 | 0 | |||||
| 2025-08-11 | 13F | Inspire Advisors, LLC | 21,410 | 1,147 | ||||||
| 2025-08-14 | 13F | Royal Bank Of Canada | 988,313 | 89.71 | 52,964 | 89.96 | ||||
| 2025-08-13 | 13F | Twin Peaks Wealth Advisors, LLC | 9,836 | 10.64 | 526 | 12.15 | ||||
| 2025-08-15 | 13F | Equitable Holdings, Inc. | 34,216 | 56.48 | 1,834 | 56.67 | ||||
| 2025-08-06 | 13F | Mark Sheptoff Financial Planning, Llc | 797 | 42.32 | 43 | 44.83 | ||||
| 2025-08-12 | 13F | LPL Financial LLC | 7,155,369 | 58.18 | 383,456 | 58.39 | ||||
| 2025-08-11 | 13F | Western Wealth Management, LLC | 40,075 | 13.75 | 2,148 | 13.90 | ||||
| 2025-07-14 | 13F | Chapin Davis, Inc. | 11,315 | 0.00 | 606 | 0.17 | ||||
| 2025-07-17 | 13F | ERn Financial, LLC | 74,137 | 3,973 | ||||||
| 2025-08-04 | 13F | Atria Investments Llc | 63,469 | 3,401 | ||||||
| 2025-08-06 | 13F | Legacy Investment Solutions, LLC | 41,462 | 2,222 | ||||||
| 2025-08-07 | 13F | Kestra Private Wealth Services, Llc | 252,157 | 36.29 | 13,513 | 36.48 | ||||
| 2025-08-08 | 13F | Cetera Investment Advisers | 1,700,150 | 63.71 | 91,111 | 63.92 | ||||
| 2025-08-13 | 13F | StoneX Group Inc. | 264,181 | 15.45 | 14,157 | 15.60 | ||||
| 2025-07-09 | 13F | Lifelong Wealth Advisors, Inc. | 566,067 | 30,336 | ||||||
| 2025-07-07 | 13F | Taylor & Morgan Wealth Management, LLC | 4,911 | 0.00 | 263 | 0.38 | ||||
| 2025-08-12 | 13F | Global Retirement Partners, LLC | 95,268 | 1,058,433.33 | 5,105 | |||||
| 2025-08-01 | 13F | Envestnet Asset Management Inc | 1,475,828 | 3.38 | 78,717 | 3.02 | ||||
| 2025-08-13 | 13F | Jones Financial Companies Lllp | 326,852 | 117.01 | 17,464 | 117.17 | ||||
| 2025-07-10 | 13F | Waypoint Wealth Partners Inc. | 8,194 | 439 | ||||||
| 2025-08-14 | 13F | UBS Group AG | 0 | -100.00 | 0 | |||||
| 2025-07-18 | 13F | Newman Dignan & Sheerar, Inc. | 5,925 | -14.44 | 318 | -14.32 | ||||
| 2025-08-14 | 13F | Raymond James Financial Inc | 377,875 | -17.60 | 20,250 | -17.49 | ||||
| 2025-07-03 | 13F | TrueWealth Advisors, LLC | 11,240 | 23.73 | 602 | 23.87 | ||||
| 2025-07-24 | 13F | IFP Advisors, Inc | 48,695 | 1,368.49 | 2,610 | 1,374.01 | ||||
| 2025-07-22 | 13F | USAdvisors Wealth Management, LLC | 32,554 | 11.71 | 2 | 0.00 | ||||
| 2025-07-14 | 13F | AdvisorNet Financial, Inc | 981 | 53 | ||||||
| 2025-07-11 | 13F | Farther Finance Advisors, LLC | 500 | 0.00 | 27 | 0.00 | ||||
| 2025-07-30 | 13F | LGT Financial Advisors LLC | 340 | -3.41 | 18 | 0.00 | ||||
| 2025-08-08 | 13F | Capital Investment Advisory Services, LLC | 316,167 | 1.15 | 16,943 | 1.29 | ||||
| 2025-08-14 | 13F | Colony Group, LLC | 10,068 | 34.78 | 540 | 35.09 | ||||
| 2025-07-16 | 13F | Essex Financial Services, Inc. | 135,131 | 5.31 | 7,242 | 5.45 | ||||
| 2025-07-10 | 13F | Wealth Enhancement Advisory Services, Llc | 412,063 | 50.03 | 21,909 | 49.05 | ||||
| 2025-07-29 | 13F | Private Trust Co Na | 10,702 | 145.91 | 574 | 146.98 | ||||
| 2025-07-07 | 13F | Peterson Wealth Advisors, LLC | 176,130 | 15.29 | 9,439 | 15.90 | ||||
| 2025-07-10 | 13F | Focus Financial Network, Inc. | 25,584 | -88.42 | 1,371 | -88.40 | ||||
| 2025-07-24 | 13F | Bernard Wealth Management Corp. | 225 | 0.00 | 12 | 0.00 | ||||
| 2025-08-14 | 13F | Great Valley Advisor Group, Inc. | 128,997 | -3.83 | 6,913 | -3.71 | ||||
| 2025-07-21 | 13F | Triad Wealth Partners, LLC | 9,171 | 47.73 | 491 | 47.89 |