Mga Batayang Estadistika
| Pemilik Institusional | 80 total, 77 long only, 0 short only, 3 long/short - change of 3.90% MRQ |
| Alokasi Portofolio Rata-rata | 0.0284 % - change of -25.48% MRQ |
| Saham Institusional (Jangka Panjang) | 4,590,997 (ex 13D/G) - change of -0.68MM shares -12.92% MRQ |
| Nilai Institusional (Jangka Panjang) | $ 42,902 USD ($1000) |
Kepemilikan Institusional dan Pemegang Saham
Mesoblast Limited - Depositary Receipt (Common Stock) (US:MESO) memiliki 80 pemilik institusional dan pemegang saham yang telah mengajukan formulir 13D/G atau 13F kepada Komisi Bursa Efek (Securities Exchange Commission/SEC). Lembaga-lembaga ini memegang total 4,590,997 saham. Pemegang saham terbesar meliputi QCSTRX - Stock Account Class R1, BlackRock, Inc., Morgan Stanley, IBB - iShares Nasdaq Biotechnology ETF, Goldman Sachs Group Inc, Susquehanna International Group, Llp, Summit X, LLC, UBS Group AG, Susquehanna International Group, Llp, and Citadel Advisors Llc .
Struktur kepemilikan institusional Mesoblast Limited - Depositary Receipt (Common Stock) (NasdaqGS:MESO) menunjukkan posisi terkini di perusahaan oleh institusi dan dana, serta perubahan terbaru dalam ukuran posisi. Pemegang saham utama dapat mencakup investor individu, reksa dana, dana lindung nilai, atau institusi. Jadwal 13D menunjukkan bahwa investor memegang (atau pernah memegang) lebih dari 5% saham perusahaan dan bermaksud (atau pernah bermaksud) untuk secara aktif mengejar perubahan strategi bisnis. Jadwal 13G menunjukkan investasi pasif lebih dari 5%.
The share price as of September 5, 2025 is 14.39 / share. Previously, on September 9, 2024, the share price was 6.14 / share. This represents an increase of 134.36% over that period.

Skor Sentimen Dana
Skor Sentimen Dana (sebelumnya dikenal sebagai Skor Akumulasi Kepemilikan) menemukan saham-saham yang paling banyak dibeli oleh dana. Ini adalah hasil dari model kuantitatif multi-faktor yang canggih yang mengidentifikasi perusahaan dengan tingkat akumulasi institusional tertinggi. Model penilaian menggunakan kombinasi dari total peningkatan pemilik yang diungkapkan, perubahan dalam alokasi portofolio pada pemilik tersebut, dan metrik lainnya. Angka berkisar dari 0 hingga 100, dengan angka yang lebih tinggi menunjukkan tingkat akumulasi yang lebih tinggi dibandingkan dengan perusahaan sejenisnya, dan 50 adalah rata-ratanya.
Frekuensi Pembaruan: Setiap Hari
Lihat Ownership Explorer, yang menyediakan daftar perusahaan dengan peringkat tertinggi.
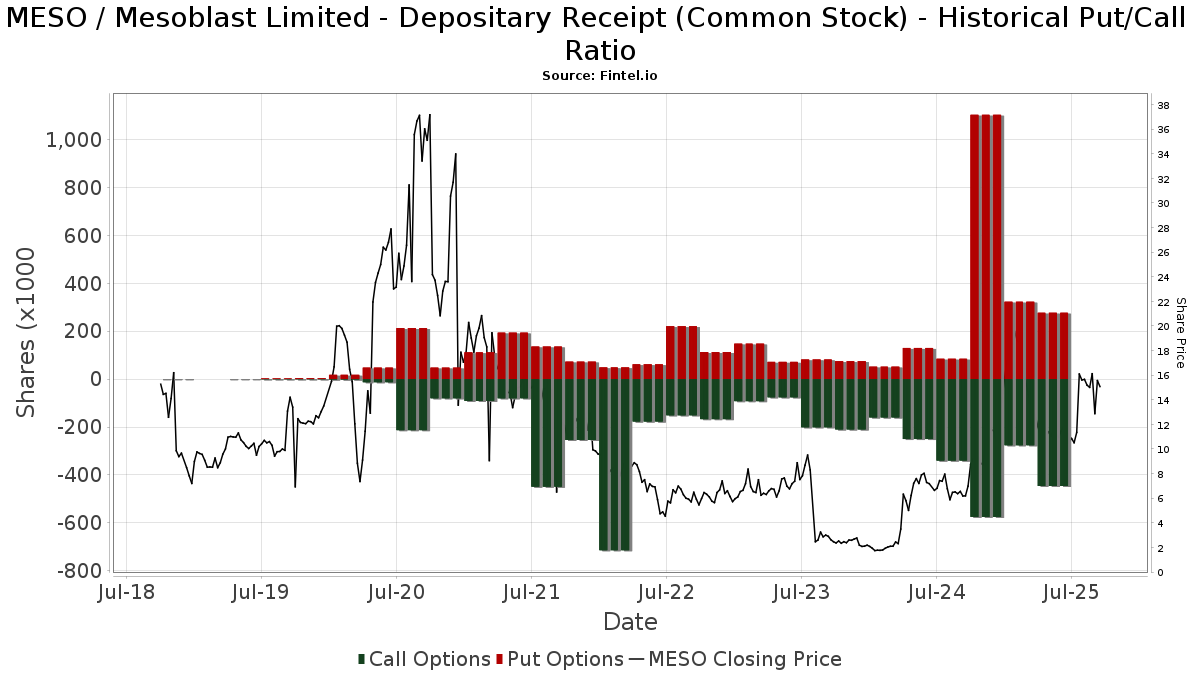
Rasio Put/Call Institusional
Selain melaporkan isu ekuitas dan utang standar, institusi dengan aset di bawah manajemen lebih dari 100 juta dolar AS juga harus mengungkapkan kepemilikan opsi put dan call mereka. Karena opsi put umumnya menunjukkan sentimen negatif, dan opsi call menunjukkan sentimen positif, kita dapat mengetahui sentimen institusional secara keseluruhan dengan memplot rasio put terhadap call. Grafik di sebelah kanan memplot rasio put/call historis untuk instrumen ini.
Menggunakan Rasio Put/Call sebagai indikator sentimen investor mengatasi salah satu kekurangan utama dari penggunaan total kepemilikan institusional, yaitu sejumlah besar aset yang dikelola diinvestasikan secara pasif untuk melacak indeks. Dana yang dikelola secara pasif biasanya tidak membeli opsi, sehingga indikator rasio put/call lebih akurat dalam melacak sentimen dana yang dikelola secara aktif.
Pengajuan 13F dan NPORT
Detail pada pengajuan 13F tersedia gratis. Detail pada pengajuan NP memerlukan keanggotaan premium. Baris berwarna hijau menunjukkan posisi baru. Baris berwarna merah menunjukkan posisi yang sudah ditutup. Klik tautan ini ikon untuk melihat riwayat transaksi selengkapnya.
Tingkatkan
untuk membuka data premium dan mengekspor ke Excel ![]() .
.
| Tanggal File | Sumber | Investor | Ketik | Presyo ng Avg (Silangan) |
Saham | Δ Saham (%) |
Dilaporkan Nilai ($1000) |
Nilai Δ (%) |
Alokasi Port (%) |
|
|---|---|---|---|---|---|---|---|---|---|---|
| 2025-08-14 | 13F | Bnp Paribas Arbitrage, Sa | 6,082 | -31.46 | 66 | -40.00 | ||||
| 2025-08-28 | NP | IBB - iShares Nasdaq Biotechnology ETF | 500,796 | -12.48 | 5,454 | -23.63 | ||||
| 2025-08-14 | 13F | Cubist Systematic Strategies, LLC | 12,204 | -83.02 | 133 | -85.28 | ||||
| 2025-05-15 | 13F | Oaktree Capital Management Lp | 0 | -100.00 | 0 | |||||
| 2025-07-28 | 13F | BRYN MAWR TRUST Co | 858 | 0.00 | 9 | -10.00 | ||||
| 2025-08-07 | 13F | Allworth Financial LP | 145 | 2 | ||||||
| 2025-08-14 | 13F | Verition Fund Management LLC | 28,844 | 314 | ||||||
| 2025-08-19 | 13F | Marex Group plc | Put | 100,000 | 1,089 | |||||
| 2025-08-19 | 13F | Marex Group plc | 100,000 | 1,089 | ||||||
| 2025-05-14 | 13F | Jump Financial, LLC | 0 | -100.00 | 0 | |||||
| 2025-08-12 | 13F | LPL Financial LLC | Call | 10,000 | 0.00 | 109 | -12.90 | |||
| 2025-08-12 | 13F | LPL Financial LLC | 50,047 | 25.10 | 545 | 9.22 | ||||
| 2025-08-14 | 13F | Oasis Management Co Ltd. | 29,524 | -28.77 | 322 | -37.91 | ||||
| 2025-08-14 | 13F | Cantor Fitzgerald, L. P. | 10,147 | 111 | ||||||
| 2025-08-07 | 13F | Summit X, LLC | 199,295 | 0.57 | 2,170 | -12.25 | ||||
| 2025-08-13 | 13F | Tobias Financial Advisors, Inc. | 10,000 | 0.00 | 109 | -12.90 | ||||
| 2025-08-14 | 13F | Millennium Management Llc | 32,283 | 88.55 | 352 | 64.79 | ||||
| 2025-09-04 | 13F/A | Advisor Group Holdings, Inc. | 857 | -0.23 | 9 | -10.00 | ||||
| 2025-08-07 | 13F | Zurcher Kantonalbank (Zurich Cantonalbank) | 633 | 0.00 | 7 | -14.29 | ||||
| 2025-08-07 | 13F | Rathbone Brothers plc | 14,017 | 0.00 | 153 | -12.64 | ||||
| 2025-08-28 | 13F | China Universal Asset Management Co., Ltd. | 9,124 | 33.74 | 99 | 16.47 | ||||
| 2025-07-24 | NP | FNCMX - Fidelity Nasdaq Composite Index Fund This fund is a listed as child fund of Fmr Llc and if that institution has disclosed ownership in this security, then these positions will not be double counted when calculating total shares and total value | 18,245 | 0.00 | 194 | -37.82 | ||||
| 2025-08-14 | 13F | Jane Street Group, Llc | 0 | -100.00 | 0 | |||||
| 2025-08-13 | 13F | Quadrant Capital Group Llc | 0 | -100.00 | 0 | |||||
| 2025-05-05 | 13F | Lindbrook Capital, Llc | 2,253 | 3.73 | 28 | -34.88 | ||||
| 2025-08-14 | 13F | Banque Transatlantique SA | 0 | -100.00 | 0 | |||||
| 2025-05-08 | 13F | XTX Topco Ltd | 0 | -100.00 | 0 | |||||
| 2025-08-15 | 13F | Tower Research Capital LLC (TRC) | 648 | -80.55 | 7 | -82.93 | ||||
| 2025-08-08 | 13F | SBI Securities Co., Ltd. | 4 | 0.00 | 0 | |||||
| 2025-08-13 | 13F | Fi3 FINANCIAL ADVISORS, LLC | 36,625 | 0.00 | 399 | -12.91 | ||||
| 2025-07-15 | 13F | Ballentine Partners, LLC | 11,414 | 124 | ||||||
| 2025-05-08 | NP | QGBLX - Quantified Global Fund Investor Class | 4,578 | 224.91 | 57 | 111.11 | ||||
| 2025-08-14 | 13F | Jane Street Group, Llc | Call | 137,500 | 631.38 | 1,497 | 539.74 | |||
| 2025-07-24 | 13F | Us Bancorp \de\ | 410 | -62.32 | 4 | -69.23 | ||||
| 2025-08-08 | 13F | Geode Capital Management, Llc | 18,320 | 0.41 | 200 | -12.33 | ||||
| 2025-07-14 | 13F | Clayton Financial Group LLC | 0 | -100.00 | 0 | |||||
| 2025-08-11 | 13F | Citigroup Inc | 25,866 | 1.45 | 282 | -11.64 | ||||
| 2025-08-08 | 13F | Creative Planning | 12,964 | 141 | ||||||
| 2025-08-14 | 13F | UBS Group AG | 193,987 | 38.07 | 2,113 | 20.48 | ||||
| 2025-07-16 | 13F | Signaturefd, Llc | 7,123 | -25.19 | 78 | -34.75 | ||||
| 2025-08-12 | 13F | Jpmorgan Chase & Co | 1,819 | -16.71 | 20 | -29.63 | ||||
| 2025-07-21 | 13F | Mirae Asset Global Investments Co., Ltd. | 1,755 | 54.22 | 19 | 46.15 | ||||
| 2025-07-24 | 13F | Strengthening Families & Communities, LLC | 10 | 0 | ||||||
| 2025-08-12 | 13F | Rhumbline Advisers | 6,094 | 4.47 | 66 | -8.33 | ||||
| 2025-08-14 | 13F | Toronto Dominion Bank | 0 | -100.00 | 0 | |||||
| 2025-08-12 | 13F | BlackRock, Inc. | 656,834 | -8.13 | 7,153 | -19.84 | ||||
| 2025-07-28 | NP | IBBQ - Invesco Nasdaq Biotechnology ETF This fund is a listed as child fund of Invesco Ltd. and if that institution has disclosed ownership in this security, then these positions will not be double counted when calculating total shares and total value | 1,334 | 9.61 | 14 | -30.00 | ||||
| 2025-07-22 | 13F | Gf Fund Management Co. Ltd. | 817 | 0.00 | 9 | -20.00 | ||||
| 2025-08-14 | 13F | Two Sigma Investments, Lp | 33,213 | 362 | ||||||
| 2025-07-30 | NP | APIE - ActivePassive International Equity ETF | 4,190 | -50.60 | 45 | -69.66 | ||||
| 2025-07-21 | 13F | Sageworth Trust Co | 0 | -100.00 | 0 | |||||
| 2025-08-13 | 13F | Rsm Us Wealth Management Llc | 10,625 | 3.41 | 116 | -10.16 | ||||
| 2025-08-14 | 13F | XY Capital Ltd | 0 | -100.00 | 0 | |||||
| 2025-05-14 | 13F | Affinity Asset Advisors, LLC | Put | 0 | -100.00 | 0 | ||||
| 2025-05-14 | 13F | EntryPoint Capital, LLC | 0 | -100.00 | 0 | |||||
| 2025-08-14 | 13F | Wells Fargo & Company/mn | 25,335 | -4.91 | 276 | -17.17 | ||||
| 2025-05-15 | 13F | Oaktree Fund Advisors, LLC | 0 | -100.00 | 0 | |||||
| 2025-08-12 | 13F | MAI Capital Management | 223 | 2 | ||||||
| 2025-04-28 | 13F | Strategic Financial Concepts, LLC | 0 | -100.00 | 0 | -100.00 | ||||
| 2025-08-12 | 13F | Steward Partners Investment Advisory, Llc | 128 | 0.00 | 1 | 0.00 | ||||
| 2025-08-15 | 13F | Morgan Stanley | 504,391 | -7.38 | 5,493 | -19.19 | ||||
| 2025-07-08 | 13F | Parallel Advisors, LLC | 933 | 23.09 | 10 | 11.11 | ||||
| 2025-08-12 | 13F | Deutsche Bank Ag\ | 1,402 | 15 | ||||||
| 2025-08-14 | 13F | Point72 Asset Management, L.P. | 0 | -100.00 | 0 | |||||
| 2025-08-13 | 13F | Jones Financial Companies Lllp | 300 | 3 | ||||||
| 2025-07-28 | NP | BIB - ProShares Ultra Nasdaq Biotechnology | 1,251 | -9.54 | 13 | -43.48 | ||||
| 2025-08-12 | 13F | Proequities, Inc. | 0 | 0 | ||||||
| 2025-08-28 | NP | QCSTRX - Stock Account Class R1 | 693,498 | -13.11 | 754 | -23.68 | ||||
| 2025-08-05 | 13F | Simplex Trading, Llc | 10,673 | -33.57 | 0 | |||||
| 2025-07-28 | 13F/A | Penbrook Management LLC | 87,675 | 0.00 | 955 | -12.80 | ||||
| 2025-08-11 | 13F | Rockbridge Investment Management, LCC | 49,150 | 0.00 | 535 | -12.72 | ||||
| 2025-08-13 | 13F | Marshall Wace, Llp | 40,710 | -43.18 | 443 | -50.45 | ||||
| 2025-07-14 | 13F | Chapin Davis, Inc. | 15,000 | 0.00 | 163 | -12.83 | ||||
| 2025-08-14 | 13F/A | Barclays Plc | 3,571 | 39.66 | 0 | |||||
| 2025-07-14 | 13F | UMA Financial Services, Inc. | 57 | 1 | ||||||
| 2025-08-14 | 13F | Old Mission Capital Llc | 0 | -100.00 | 0 | |||||
| 2025-08-14 | 13F | Susquehanna International Group, Llp | Call | 158,000 | 62.55 | 1,721 | 41.80 | |||
| 2025-08-18 | 13F/A | National Bank Of Canada /fi/ | 525 | 0.00 | 6 | -16.67 | ||||
| 2025-07-17 | 13F | Lazari Capital Management, Inc. | 46,471 | 2.21 | 506 | -10.76 | ||||
| 2025-06-26 | NP | DFIEX - International Core Equity Portfolio - Institutional Class This fund is a listed as child fund of Dimensional Fund Advisors Lp and if that institution has disclosed ownership in this security, then these positions will not be double counted when calculating total shares and total value | 796 | 0.00 | 9 | -43.75 | ||||
| 2025-08-14 | 13F | Citadel Advisors Llc | Call | 141,350 | -6.36 | 1,539 | -18.27 | |||
| 2025-08-14 | 13F | Citadel Advisors Llc | 74,636 | -84.67 | 813 | -86.63 | ||||
| 2025-08-14 | 13F | Susquehanna International Group, Llp | Put | 113,600 | -52.82 | 1,237 | -58.84 | |||
| 2025-08-14 | 13F | Citadel Advisors Llc | Put | 63,400 | -23.34 | 690 | -33.14 | |||
| 2025-08-14 | 13F | Susquehanna International Group, Llp | 234,587 | -10.10 | 2,555 | -21.56 | ||||
| 2025-07-31 | 13F | Caitong International Asset Management Co., Ltd | 510 | 88.19 | 6 | 66.67 | ||||
| 2025-08-14 | 13F | Raymond James Financial Inc | 7,892 | 86 | ||||||
| 2025-08-14 | 13F | Daiwa Securities Group Inc. | 105 | 0.00 | 0 | |||||
| 2025-08-15 | 13F | WealthCollab, LLC | 73 | 1 | ||||||
| 2025-07-25 | 13F | JustInvest LLC | 13,331 | 26.97 | 145 | 10.69 | ||||
| 2025-08-14 | 13F | Aqr Capital Management Llc | 13,932 | 152 | ||||||
| 2025-08-05 | 13F | Advisors Preferred, LLC | 0 | -100.00 | 0 | |||||
| 2025-08-08 | 13F | Thoroughbred Financial Services, Llc | 0 | -100.00 | 0 | |||||
| 2025-08-13 | 13F | EverSource Wealth Advisors, LLC | 159 | -46.46 | 2 | -66.67 | ||||
| 2025-08-14 | 13F | Bank Of America Corp /de/ | 12,499 | -65.85 | 136 | -70.18 | ||||
| 2025-07-31 | 13F | R Squared Ltd | 11,571 | 126 | ||||||
| 2025-08-05 | 13F | Prosperity Wealth Management, Inc. | 50,100 | 2.87 | 546 | -10.21 | ||||
| 2025-07-14 | 13F | GAMMA Investing LLC | 6,838 | -0.20 | 74 | -12.94 | ||||
| 2025-08-14 | 13F | Goldman Sachs Group Inc | 415,465 | 61.57 | 4,524 | 40.98 | ||||
| 2025-08-14 | 13F | Royal Bank Of Canada | 85,674 | 756.74 | 933 | 646.40 | ||||
| 2025-07-15 | 13F | Compagnie Lombard Odier SCmA | 1,000 | 0.00 | 11 | -16.67 | ||||
| 2025-08-14 | 13F | Visionary Wealth Advisors | 10,901 | 0.00 | 119 | -13.24 | ||||
| 2025-08-27 | 13F/A | Squarepoint Ops LLC | 14,603 | -3.03 | 159 | -14.97 | ||||
| 2025-07-31 | 13F | Cambridge Investment Research Advisors, Inc. | 10,146 | -11.08 | 0 | |||||
| 2025-08-14 | 13F | Group One Trading, L.p. | 90,902 | -39.89 | 990 | -47.59 | ||||
| 2025-05-15 | 13F | Sio Capital Management, LLC | 0 | -100.00 | 0 | |||||
| 2025-07-15 | 13F | SJS Investment Consulting Inc. | 0 | -100.00 | 0 |
Other Listings
| DE:LWB1 |