Mga Batayang Estadistika
| Pemilik Institusional | 114 total, 114 long only, 0 short only, 0 long/short - change of -2.56% MRQ |
| Alokasi Portofolio Rata-rata | 0.1865 % - change of -35.92% MRQ |
| Saham Institusional (Jangka Panjang) | 12,374,117 (ex 13D/G) - change of -0.14MM shares -1.12% MRQ |
| Nilai Institusional (Jangka Panjang) | $ 239,332 USD ($1000) |
Kepemilikan Institusional dan Pemegang Saham
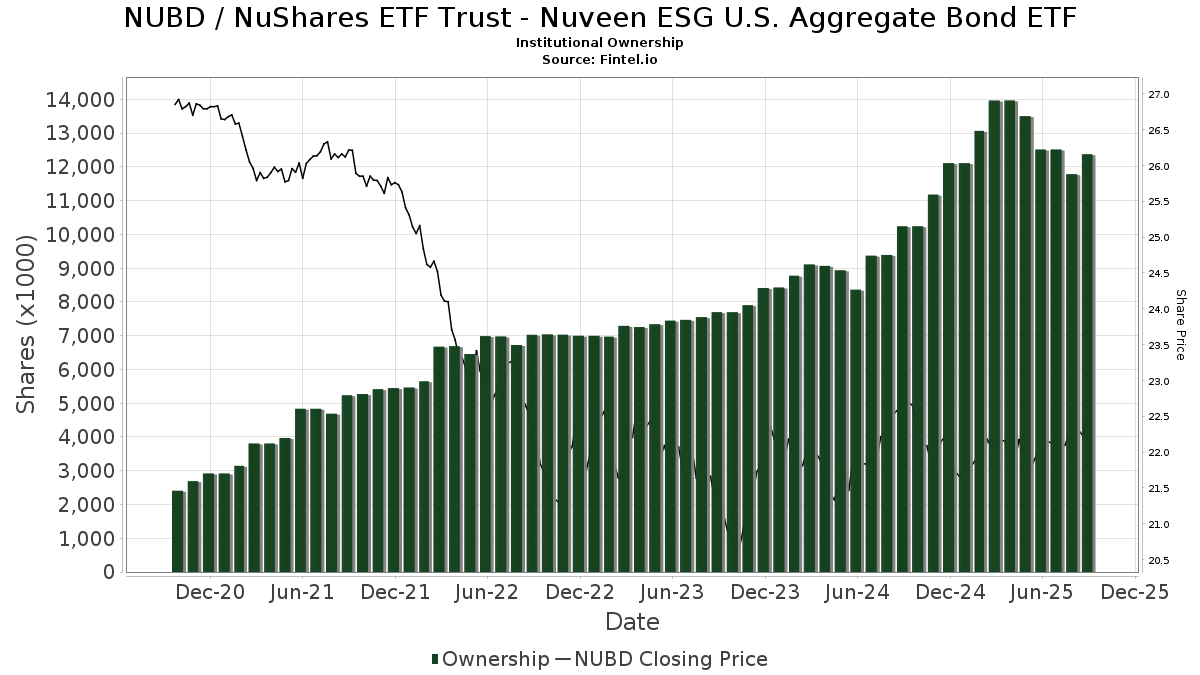
NuShares ETF Trust - Nuveen ESG U.S. Aggregate Bond ETF (US:NUBD) memiliki 114 pemilik institusional dan pemegang saham yang telah mengajukan formulir 13D/G atau 13F kepada Komisi Bursa Efek (Securities Exchange Commission/SEC). Lembaga-lembaga ini memegang total 12,374,117 saham. Pemegang saham terbesar meliputi Morgan Stanley, First Pacific Financial, Cambridge Investment Research Advisors, Inc., Vestmark Advisory Solutions, Inc., Envestnet Portfolio Solutions, Inc., Bank of New York Mellon Corp, Envestnet Asset Management Inc, LPL Financial LLC, WCG Wealth Advisors LLC, and Garrett Investment Advisors LLC .
Struktur kepemilikan institusional NuShares ETF Trust - Nuveen ESG U.S. Aggregate Bond ETF (ARCA:NUBD) menunjukkan posisi terkini di perusahaan oleh institusi dan dana, serta perubahan terbaru dalam ukuran posisi. Pemegang saham utama dapat mencakup investor individu, reksa dana, dana lindung nilai, atau institusi. Jadwal 13D menunjukkan bahwa investor memegang (atau pernah memegang) lebih dari 5% saham perusahaan dan bermaksud (atau pernah bermaksud) untuk secara aktif mengejar perubahan strategi bisnis. Jadwal 13G menunjukkan investasi pasif lebih dari 5%.
The share price as of September 5, 2025 is 22.42 / share. Previously, on September 9, 2024, the share price was 22.72 / share. This represents a decline of 1.28% over that period.
Skor Sentimen Dana
Skor Sentimen Dana (sebelumnya dikenal sebagai Skor Akumulasi Kepemilikan) menemukan saham-saham yang paling banyak dibeli oleh dana. Ini adalah hasil dari model kuantitatif multi-faktor yang canggih yang mengidentifikasi perusahaan dengan tingkat akumulasi institusional tertinggi. Model penilaian menggunakan kombinasi dari total peningkatan pemilik yang diungkapkan, perubahan dalam alokasi portofolio pada pemilik tersebut, dan metrik lainnya. Angka berkisar dari 0 hingga 100, dengan angka yang lebih tinggi menunjukkan tingkat akumulasi yang lebih tinggi dibandingkan dengan perusahaan sejenisnya, dan 50 adalah rata-ratanya.
Frekuensi Pembaruan: Setiap Hari
Lihat Ownership Explorer, yang menyediakan daftar perusahaan dengan peringkat tertinggi.
Rasio Put/Call Institusional
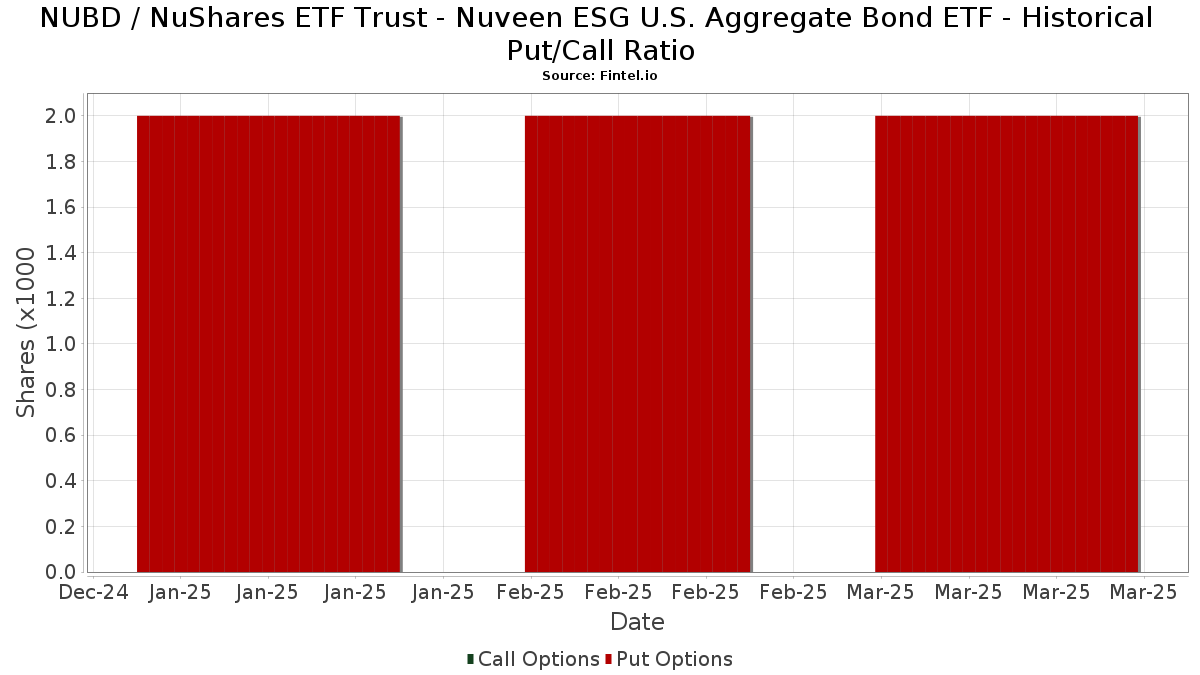
Selain melaporkan isu ekuitas dan utang standar, institusi dengan aset di bawah manajemen lebih dari 100 juta dolar AS juga harus mengungkapkan kepemilikan opsi put dan call mereka. Karena opsi put umumnya menunjukkan sentimen negatif, dan opsi call menunjukkan sentimen positif, kita dapat mengetahui sentimen institusional secara keseluruhan dengan memplot rasio put terhadap call. Grafik di sebelah kanan memplot rasio put/call historis untuk instrumen ini.
Menggunakan Rasio Put/Call sebagai indikator sentimen investor mengatasi salah satu kekurangan utama dari penggunaan total kepemilikan institusional, yaitu sejumlah besar aset yang dikelola diinvestasikan secara pasif untuk melacak indeks. Dana yang dikelola secara pasif biasanya tidak membeli opsi, sehingga indikator rasio put/call lebih akurat dalam melacak sentimen dana yang dikelola secara aktif.
Pengajuan 13F dan NPORT
Detail pada pengajuan 13F tersedia gratis. Detail pada pengajuan NP memerlukan keanggotaan premium. Baris berwarna hijau menunjukkan posisi baru. Baris berwarna merah menunjukkan posisi yang sudah ditutup. Klik tautan ini ikon untuk melihat riwayat transaksi selengkapnya.
Tingkatkan
untuk membuka data premium dan mengekspor ke Excel ![]() .
.
| Tanggal File | Sumber | Investor | Ketik | Presyo ng Avg (Silangan) |
Saham | Δ Saham (%) |
Dilaporkan Nilai ($1000) |
Nilai Δ (%) |
Alokasi Port (%) |
|
|---|---|---|---|---|---|---|---|---|---|---|
| 2025-07-29 | 13F | Novare Capital Management Llc | 12,072 | 269 | ||||||
| 2025-08-13 | 13F | Millstone Evans Group, LLC | 4,389 | 0.00 | 98 | 0.00 | ||||
| 2025-05-08 | 13F | Natixis Advisors, L.p. | 0 | -100.00 | 0 | |||||
| 2025-08-12 | 13F | Integrated Advisors Network LLC | 14,999 | -36.68 | 334 | -36.57 | ||||
| 2025-08-15 | 13F | Morgan Stanley | 1,498,260 | 7.07 | 33,351 | 7.43 | ||||
| 2025-08-07 | 13F | Allworth Financial LP | 37,012 | -4.84 | 824 | -3.74 | ||||
| 2025-08-12 | 13F | LPL Financial LLC | 481,528 | 6.12 | 10,719 | 6.48 | ||||
| 2025-08-12 | 13F | Proequities, Inc. | 0 | 0 | ||||||
| 2025-07-25 | 13F | Natural Investments, Llc | 20,485 | -19.52 | 0 | |||||
| 2025-08-14 | 13F | Mml Investors Services, Llc | 0 | -100.00 | 0 | |||||
| 2025-07-10 | 13F | Charter Oak Capital Management, LLC | 242,692 | -1.49 | 5,402 | -1.15 | ||||
| 2025-07-23 | 13F | Tcfg Wealth Management, Llc | 9,680 | 215 | ||||||
| 2025-08-14 | 13F | Comerica Bank | 2,440 | 0.99 | 54 | 1.89 | ||||
| 2025-08-01 | 13F | Rossby Financial, LCC | 7,147 | -28.91 | 159 | -28.05 | ||||
| 2025-08-11 | 13F | HighTower Advisors, LLC | 69,481 | -2.20 | 1,547 | -1.90 | ||||
| 2025-08-14 | 13F | IHT Wealth Management, LLC | 14,652 | 0.00 | 326 | 0.31 | ||||
| 2025-07-22 | 13F | Stanich Group LLC | 0 | -100.00 | 0 | |||||
| 2025-08-14 | 13F | UBS Group AG | 81,022 | 0.70 | 1,804 | 1.01 | ||||
| 2025-08-13 | 13F | EverSource Wealth Advisors, LLC | 415 | 0.00 | 9 | 0.00 | ||||
| 2025-07-18 | 13F | First Pacific Financial | 1,054,279 | 0.65 | 23,468 | 0.99 | ||||
| 2025-07-31 | 13F | Silver Oak Advisory Group, Inc. | 118,862 | -0.61 | 3 | 0.00 | ||||
| 2025-07-31 | 13F | Orion Capital Management LLC | 408 | 0.00 | 9 | 0.00 | ||||
| 2025-08-14 | 13F | Bank Of America Corp /de/ | 267,188 | -38.65 | 5,948 | -38.45 | ||||
| 2025-08-14 | 13F | Gerber Kawasaki Wealth & Investment Management | 15,044 | -11.87 | 335 | -11.64 | ||||
| 2025-07-29 | 13F | Stratos Wealth Partners, LTD. | 9,635 | -24.67 | 214 | -24.38 | ||||
| 2025-07-15 | 13F | Garrett Investment Advisors LLC | 317,556 | -0.43 | 7,069 | -0.10 | ||||
| 2025-08-12 | 13F | MAI Capital Management | 613 | 0.00 | 14 | 0.00 | ||||
| 2025-08-08 | 13F | Creative Planning | 13,280 | 0.00 | 296 | 0.34 | ||||
| 2025-08-13 | 13F | SageView Advisory Group, LLC | 36,085 | -2.73 | 795 | -3.28 | ||||
| 2025-07-17 | 13F | Nelson, Van Denburg & Campbell Wealth Management Group, LLC | 10,920 | 1.01 | 243 | 1.67 | ||||
| 2025-08-11 | 13F | Tidemark, LLC | 1,925 | 0.00 | 43 | 0.00 | ||||
| 2025-05-15 | 13F | Diversified Enterprises, LLC | 0 | -100.00 | 0 | |||||
| 2025-07-15 | 13F | Legacy Financial Group LLC | 31,370 | -6.79 | 698 | -6.43 | ||||
| 2025-08-05 | 13F | Mission Wealth Management, Lp | 21,861 | -33.11 | 487 | -32.97 | ||||
| 2025-07-25 | 13F | Envestnet Portfolio Solutions, Inc. | 741,144 | 0.99 | 16,498 | 1.33 | ||||
| 2025-08-14 | 13F | Susquehanna International Group, Llp | 58,361 | 1,299 | ||||||
| 2025-07-23 | 13F | Litman Gregory Asset Management LLC | 55,194 | 0.26 | 1,229 | 0.57 | ||||
| 2025-07-17 | 13F | BayBridge Capital Group, LLC | 30,567 | 13.53 | 680 | 13.90 | ||||
| 2025-08-12 | 13F | Global Retirement Partners, LLC | 4,355 | 0.39 | 97 | 2.13 | ||||
| 2025-08-14 | 13F | Raymond James Financial Inc | 21,370 | -48.93 | 476 | -48.81 | ||||
| 2025-08-14 | 13F | Jane Street Group, Llc | 89,631 | -22.17 | 1,995 | -21.89 | ||||
| 2025-07-11 | 13F | Colorado Capital Management, Inc. | 163,741 | -7.18 | 4 | 0.00 | ||||
| 2025-07-11 | 13F | Westfuller Advisors, LLC | 307,916 | 1.00 | 6,854 | 1.35 | ||||
| 2025-07-24 | 13F | Us Bancorp \de\ | 42,947 | -15.29 | 956 | -15.04 | ||||
| 2025-07-31 | 13F | Cambridge Investment Research Advisors, Inc. | 851,115 | -2.71 | 19 | -5.26 | ||||
| 2025-08-13 | 13F | WCG Wealth Advisors LLC | 369,935 | 18.11 | 8,235 | 18.51 | ||||
| 2025-07-17 | 13F | LexAurum Advisors, LLC | 15,721 | 0.92 | 350 | 1.16 | ||||
| 2025-07-22 | 13F | Miracle Mile Advisors, LLC | 258,840 | -0.29 | 5,762 | 0.05 | ||||
| 2025-08-11 | 13F | Covestor Ltd | 795 | -1.36 | 0 | |||||
| 2025-08-14 | 13F | Mariner, LLC | 34,524 | -1.80 | 769 | -1.41 | ||||
| 2025-07-24 | 13F | Etesian Wealth Advisors, Inc. | 13,867 | 34.67 | 309 | 35.09 | ||||
| 2025-08-06 | 13F | Vestmark Advisory Solutions, Inc. | 799,770 | 130.71 | 17,803 | 131.50 | ||||
| 2025-07-18 | 13F | Lockerman Financial Group, Inc. | 24,561 | -8.27 | 547 | -7.93 | ||||
| 2025-05-12 | 13F | Independent Advisor Alliance | 0 | -100.00 | 0 | |||||
| 2025-07-08 | 13F | Parallel Advisors, LLC | 9,450 | 210 | ||||||
| 2025-08-07 | 13F | Sound View Wealth Advisors Group, LLC | 20,133 | 7.58 | 448 | 7.95 | ||||
| 2025-07-31 | 13F | Wealthfront Advisers Llc | 42,143 | -4.02 | 938 | -3.70 | ||||
| 2025-08-11 | 13F | Private Advisor Group, LLC | 81,611 | -2.49 | 1,817 | -2.16 | ||||
| 2025-08-01 | 13F | Envestnet Asset Management Inc | 540,378 | -4.53 | 12,029 | -4.21 | ||||
| 2025-08-04 | 13F | Quaker Wealth Management, LLC | 2,695 | 60 | ||||||
| 2025-07-31 | 13F | Brinker Capital Investments, LLC | 0 | -100.00 | 0 | -100.00 | ||||
| 2025-08-08 | 13F | Cetera Investment Advisers | 14,036 | 23.72 | 312 | 24.30 | ||||
| 2025-08-11 | 13F | Retirement Capital Strategies | 108,626 | 20.87 | 2,418 | 21.32 | ||||
| 2025-08-14 | 13F | Fmr Llc | 2,158 | -28.26 | 48 | -27.27 | ||||
| 2025-08-08 | 13F | Financial Gravity Companies, Inc. | 3,674 | -10.35 | 82 | -8.99 | ||||
| 2025-04-29 | 13F | Financial Network Wealth Management LLC | 110,776 | -23.22 | 2 | -33.33 | ||||
| 2025-07-28 | 13F | Axxcess Wealth Management, Llc | 48,113 | -2.60 | 1,071 | -2.28 | ||||
| 2025-08-06 | 13F | Walkner Condon Financial Advisors LLC | 21,072 | 0.00 | 469 | 0.43 | ||||
| 2025-07-11 | 13F/A | Umb Bank N A/mo | 84,741 | -1.64 | 1,886 | -1.31 | ||||
| 2025-08-04 | 13F | Assetmark, Inc | 148,439 | 0.51 | 3,304 | 0.85 | ||||
| 2025-07-31 | 13F | LongView Asset Management LLC | 15,214 | -31.88 | 339 | -31.72 | ||||
| 2025-08-11 | 13F | Avantax Planning Partners, Inc. | 22,952 | -30.03 | 511 | -29.85 | ||||
| 2025-08-14 | 13F/A | Rockefeller Capital Management L.P. | 30,755 | 36.60 | 685 | 37.07 | ||||
| 2025-07-29 | 13F | Kelman-Lazarov, Inc. | 30,060 | -0.09 | 669 | 0.30 | ||||
| 2025-05-14 | 13F | Atomi Financial Group, Inc. | 0 | -100.00 | 0 | |||||
| 2025-07-25 | 13F | Midwest Capital Advisors, LLC | 0 | -100.00 | 0 | |||||
| 2025-07-09 | 13F | Lifelong Wealth Advisors, Inc. | 19,098 | 3.09 | 425 | 3.66 | ||||
| 2025-08-11 | 13F | Citigroup Inc | 42,524 | 197.37 | 947 | 198.42 | ||||
| 2025-08-04 | 13F | WNY Asset Management, LLC | 13,117 | -7.65 | 292 | -7.62 | ||||
| 2025-08-05 | 13F | Bank of New York Mellon Corp | 549,543 | 13.68 | 12,233 | 14.06 | ||||
| 2025-08-13 | 13F | Flow Traders U.s. Llc | 0 | -100.00 | 0 | |||||
| 2025-07-10 | 13F | Wealth Enhancement Advisory Services, Llc | 31,356 | -9.52 | 692 | -9.90 | ||||
| 2025-07-25 | 13F | Cwm, Llc | 7,633 | 45.17 | 0 | |||||
| 2025-08-12 | 13F | Ameritas Investment Partners, Inc. | 7,628 | -0.37 | 170 | 0.00 | ||||
| 2025-07-23 | 13F | Proffitt & Goodson Inc | 407 | -6.86 | 9 | 0.00 | ||||
| 2025-08-04 | 13F | Creative Financial Designs Inc /adv | 273 | 0.00 | 6 | 0.00 | ||||
| 2025-09-04 | 13F/A | Advisor Group Holdings, Inc. | 46,796 | 2,736.12 | 1,041 | 2,788.89 | ||||
| 2025-08-04 | 13F | Atria Investments Llc | 39,800 | 886 | ||||||
| 2025-08-12 | 13F | Coldstream Capital Management Inc | 48,367 | 1,077 | ||||||
| 2025-04-23 | 13F | Keudell/Morrison Wealth Management | 0 | -100.00 | 0 | |||||
| 2025-08-07 | 13F | Mayport, Llc | 94,104 | 0.00 | 2,095 | 0.34 | ||||
| 2025-05-02 | 13F | Cable Hill Partners, LLC | 48,367 | 2.26 | 1,073 | 4.08 | ||||
| 2025-05-15 | 13F | Hrt Financial Lp | 0 | -100.00 | 0 | |||||
| 2025-07-22 | 13F | Simplicity Wealth,LLC | 0 | -100.00 | 0 | |||||
| 2025-08-04 | 13F | Quaker Wealth Management, LLC | Put | 0 | -100.00 | 0 | -100.00 | |||
| 2025-08-06 | 13F | Commonwealth Equity Services, Llc | 107,443 | -29.87 | 2 | -33.33 | ||||
| 2025-07-29 | 13F | Stordahl Capital Management, Inc. | 9,920 | -4.07 | 221 | -3.93 | ||||
| 2025-07-29 | 13F | Private Trust Co Na | 2,162 | 30.01 | 48 | 33.33 | ||||
| 2025-08-14 | 13F | Citadel Advisors Llc | 74,988 | -48.65 | 1,669 | -48.47 | ||||
| 2025-07-09 | 13F | Bank of New Hampshire | 780 | 0.00 | 17 | 0.00 | ||||
| 2025-07-30 | 13F | D.a. Davidson & Co. | 33,556 | 34.82 | 747 | 35.14 | ||||
| 2025-07-28 | 13F | Harbour Investments, Inc. | 8,444 | 0.00 | 188 | 0.00 | ||||
| 2025-07-23 | 13F | SGL Investment Advisors, Inc. | 10,718 | 8.44 | 236 | 8.80 | ||||
| 2025-08-01 | 13F | Koss-Olinger Consulting, LLC | 275,279 | -27.91 | 6,128 | -27.67 | ||||
| 2025-07-09 | 13F | Sandbox Financial Partners, LLC | 17,354 | -6.70 | 386 | -6.31 | ||||
| 2025-08-15 | 13F | Captrust Financial Advisors | 0 | -100.00 | 0 | |||||
| 2025-07-16 | 13F | Perigon Wealth Management, LLC | 91,391 | 9.94 | 2,034 | 10.30 | ||||
| 2025-07-25 | 13F | Evolution Advisers, Inc. | 116,036 | 0.00 | 3 | 0.00 | ||||
| 2025-07-29 | 13F | TFC Financial Management | 1,111 | 0.00 | 25 | 0.00 | ||||
| 2025-08-14 | 13F | Wells Fargo & Company/mn | 105,514 | -4.14 | 2,349 | -3.81 | ||||
| 2025-08-08 | 13F | Smithfield Trust Co | 151 | 0.00 | 0 | |||||
| 2025-08-13 | 13F | IAG Wealth Partners, LLC | 5,016 | 51.27 | 112 | 52.05 | ||||
| 2025-08-12 | 13F | Gitterman Wealth Management, LLC | 34,221 | -1.39 | 762 | -1.04 | ||||
| 2025-08-14 | 13F | Colony Group, LLC | 309,097 | 39.63 | 6,881 | 40.09 | ||||
| 2025-04-17 | 13F | Stewardship Advisors, LLC | 0 | -100.00 | 0 | |||||
| 2025-07-22 | 13F | Wealthcare Advisory Partners LLC | 22,362 | -3.51 | 498 | -3.31 | ||||
| 2025-07-14 | 13F | Ai Financial Services Llc | 49,631 | 11.82 | 1,105 | 12.20 | ||||
| 2025-07-18 | 13F/A | MJT & Associates Financial Advisory Group, Inc. | 3,323 | -22.20 | 74 | -22.34 | ||||
| 2025-08-12 | 13F | Jpmorgan Chase & Co | 33,924 | 0.20 | 755 | 0.53 | ||||
| 2025-08-14 | 13F | Royal Bank Of Canada | 146,539 | 6.27 | 3,262 | 6.64 | ||||
| 2025-04-30 | 13F | Sofos Investments, Inc. | 4,098 | -54.99 | 91 | -54.55 | ||||
| 2025-08-13 | 13F | Baird Financial Group, Inc. | 9,602 | 1.02 | 214 | 1.43 | ||||
| 2025-07-18 | 13F | Cantor Fitzgerald Investment Adviser L.p. | 35,492 | -13.02 | 790 | -12.71 | ||||
| 2025-08-14 | 13F | City National Bank Of Florida /msd | 0 | -100.00 | 0 | |||||
| 2025-08-08 | 13F | Emerald Investment Partners, Llc | 248 | 0.00 | 6 | 0.00 | ||||
| 2025-08-07 | 13F | Resources Investment Advisors, LLC. | 29,751 | -11.68 | 662 | -11.38 | ||||
| 2025-08-05 | 13F | Cherry Tree Wealth Management, LLC | 14,825 | -15.65 | 330 | -15.17 | ||||
| 2025-08-11 | 13F | Aptus Capital Advisors, LLC | 436 | 0.00 | 10 | 0.00 | ||||
| 2025-07-02 | 13F | Boston Standard Wealth Management, LLC | 119,617 | 36.14 | 2,663 | 38.91 | ||||
| 2025-07-09 | 13F | Aaron Wealth Advisors LLC | 12,003 | 0.00 | 267 | 0.38 | ||||
| 2025-07-14 | 13F | Park Avenue Securities Llc | 123,392 | -6.34 | 3 | 0.00 |