Mga Batayang Estadistika
| Pemilik Institusional | 129 total, 128 long only, 1 short only, 0 long/short - change of 0.78% MRQ |
| Alokasi Portofolio Rata-rata | 0.0773 % - change of 4.94% MRQ |
| Saham Institusional (Jangka Panjang) | 18,872,953 (ex 13D/G) - change of 0.37MM shares 2.02% MRQ |
| Nilai Institusional (Jangka Panjang) | $ 353,493 USD ($1000) |
Kepemilikan Institusional dan Pemegang Saham
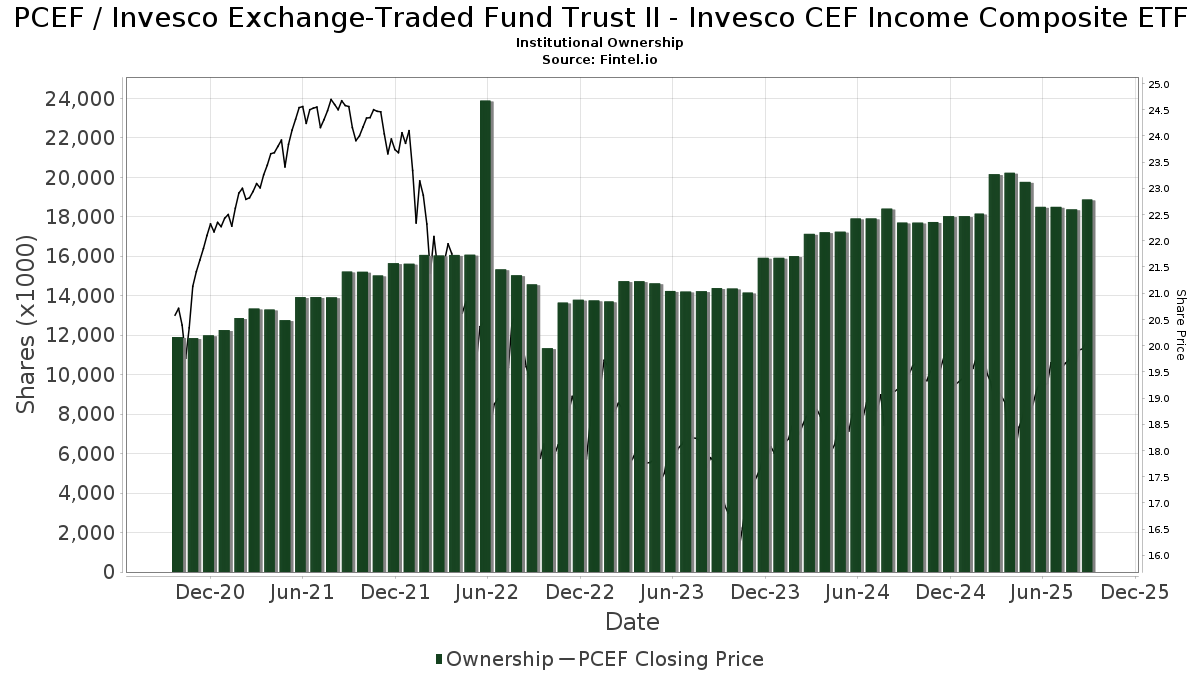
Invesco Exchange-Traded Fund Trust II - Invesco CEF Income Composite ETF (US:PCEF) memiliki 129 pemilik institusional dan pemegang saham yang telah mengajukan formulir 13D/G atau 13F kepada Komisi Bursa Efek (Securities Exchange Commission/SEC). Lembaga-lembaga ini memegang total 18,879,453 saham. Pemegang saham terbesar meliputi Envestnet Asset Management Inc, Morgan Stanley, Wells Fargo & Company/mn, Royal Bank Of Canada, Raymond James Financial Inc, LPL Financial LLC, Bank Of America Corp /de/, Larson Financial Group LLC, Cetera Investment Advisers, and Ameriprise Financial Inc .
Struktur kepemilikan institusional Invesco Exchange-Traded Fund Trust II - Invesco CEF Income Composite ETF (ARCA:PCEF) menunjukkan posisi terkini di perusahaan oleh institusi dan dana, serta perubahan terbaru dalam ukuran posisi. Pemegang saham utama dapat mencakup investor individu, reksa dana, dana lindung nilai, atau institusi. Jadwal 13D menunjukkan bahwa investor memegang (atau pernah memegang) lebih dari 5% saham perusahaan dan bermaksud (atau pernah bermaksud) untuk secara aktif mengejar perubahan strategi bisnis. Jadwal 13G menunjukkan investasi pasif lebih dari 5%.
The share price as of September 5, 2025 is 19.97 / share. Previously, on September 6, 2024, the share price was 19.07 / share. This represents an increase of 4.72% over that period.
Skor Sentimen Dana
Skor Sentimen Dana (sebelumnya dikenal sebagai Skor Akumulasi Kepemilikan) menemukan saham-saham yang paling banyak dibeli oleh dana. Ini adalah hasil dari model kuantitatif multi-faktor yang canggih yang mengidentifikasi perusahaan dengan tingkat akumulasi institusional tertinggi. Model penilaian menggunakan kombinasi dari total peningkatan pemilik yang diungkapkan, perubahan dalam alokasi portofolio pada pemilik tersebut, dan metrik lainnya. Angka berkisar dari 0 hingga 100, dengan angka yang lebih tinggi menunjukkan tingkat akumulasi yang lebih tinggi dibandingkan dengan perusahaan sejenisnya, dan 50 adalah rata-ratanya.
Frekuensi Pembaruan: Setiap Hari
Lihat Ownership Explorer, yang menyediakan daftar perusahaan dengan peringkat tertinggi.
Rasio Put/Call Institusional
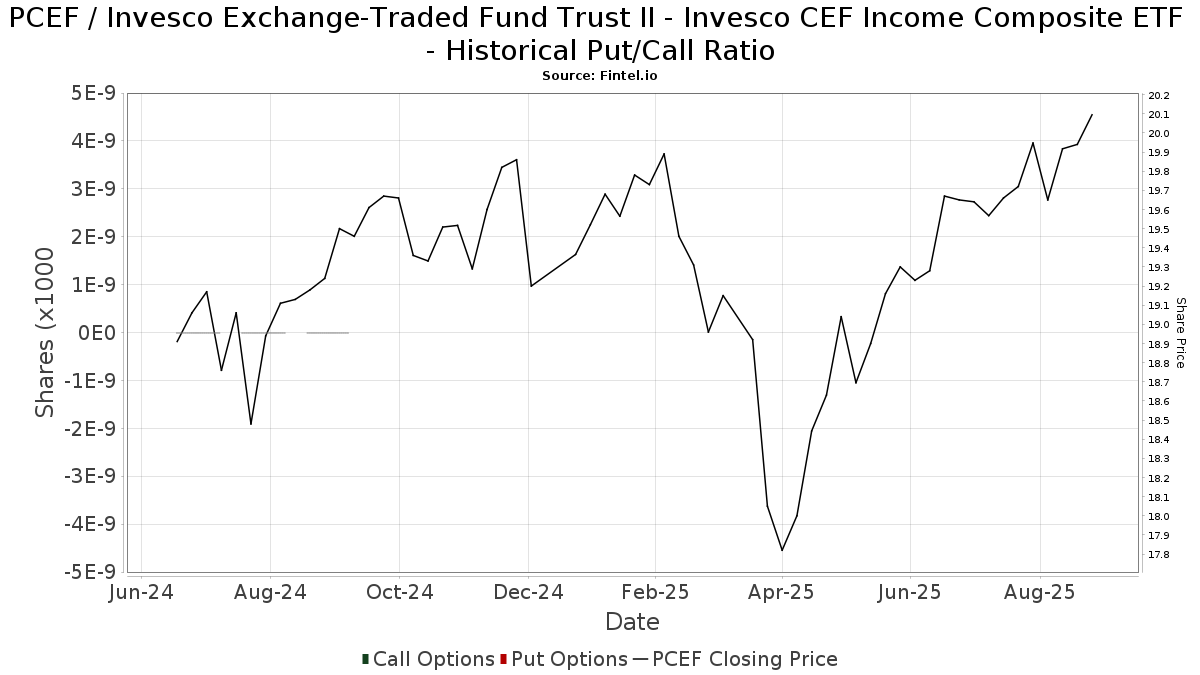
Selain melaporkan isu ekuitas dan utang standar, institusi dengan aset di bawah manajemen lebih dari 100 juta dolar AS juga harus mengungkapkan kepemilikan opsi put dan call mereka. Karena opsi put umumnya menunjukkan sentimen negatif, dan opsi call menunjukkan sentimen positif, kita dapat mengetahui sentimen institusional secara keseluruhan dengan memplot rasio put terhadap call. Grafik di sebelah kanan memplot rasio put/call historis untuk instrumen ini.
Menggunakan Rasio Put/Call sebagai indikator sentimen investor mengatasi salah satu kekurangan utama dari penggunaan total kepemilikan institusional, yaitu sejumlah besar aset yang dikelola diinvestasikan secara pasif untuk melacak indeks. Dana yang dikelola secara pasif biasanya tidak membeli opsi, sehingga indikator rasio put/call lebih akurat dalam melacak sentimen dana yang dikelola secara aktif.
Pengajuan 13F dan NPORT
Detail pada pengajuan 13F tersedia gratis. Detail pada pengajuan NP memerlukan keanggotaan premium. Baris berwarna hijau menunjukkan posisi baru. Baris berwarna merah menunjukkan posisi yang sudah ditutup. Klik tautan ini ikon untuk melihat riwayat transaksi selengkapnya.
Tingkatkan
untuk membuka data premium dan mengekspor ke Excel ![]() .
.
| Tanggal File | Sumber | Investor | Ketik | Presyo ng Avg (Silangan) |
Saham | Δ Saham (%) |
Dilaporkan Nilai ($1000) |
Nilai Δ (%) |
Alokasi Port (%) |
|
|---|---|---|---|---|---|---|---|---|---|---|
| 2025-08-14 | 13F | Gotham Asset Management, LLC | 19,418 | 22.03 | 379 | 26.76 | ||||
| 2025-08-12 | 13F | Steward Partners Investment Advisory, Llc | 4,281 | -0.19 | 84 | 3.75 | ||||
| 2025-08-12 | 13F | Boxwood Ventures, Inc. | 14,893 | 2.10 | 291 | 6.20 | ||||
| 2025-08-14 | 13F | Qube Research & Technologies Ltd | 57 | 0.00 | 1 | 0.00 | ||||
| 2025-07-17 | 13F | Janney Montgomery Scott LLC | 25,842 | -9.07 | 1 | |||||
| 2025-08-14 | 13F | Sunbelt Securities, Inc. | 801 | -2.08 | 15 | 0.00 | ||||
| 2025-07-08 | 13F | Heartwood Wealth Advisors LLC | 35,000 | 0.00 | 684 | 3.64 | ||||
| 2025-04-22 | 13F | Merkkuri Wealth Advisors LLC | 0 | -100.00 | 0 | |||||
| 2025-07-30 | 13F | Cullen/frost Bankers, Inc. | 0 | -100.00 | 0 | |||||
| 2025-05-15 | 13F/A | Orion Portfolio Solutions, LLC | 50,024 | -10.77 | 943 | -12.29 | ||||
| 2025-08-26 | 13F/A | Thrivent Financial For Lutherans | 0 | -100.00 | 0 | |||||
| 2025-05-09 | 13F | Blair William & Co/il | 0 | -100.00 | 0 | -100.00 | ||||
| 2025-07-18 | 13F | Truist Financial Corp | 74,536 | -14.71 | 1,434 | -12.93 | ||||
| 2025-08-04 | 13F | Adell Harriman & Carpenter Inc | 124,300 | 4.63 | 2,429 | 8.44 | ||||
| 2025-08-06 | 13F | Prospera Financial Services Inc | 12,711 | 0.88 | 248 | 4.64 | ||||
| 2025-07-23 | 13F | Sax Wealth Advisors, Llc | 12,500 | 0.00 | 244 | 3.83 | ||||
| 2025-08-14 | 13F | Wealth Preservation Advisors, LLC | 500 | 0.00 | 10 | 0.00 | ||||
| 2025-08-14 | 13F | Mml Investors Services, Llc | 91,654 | -7.58 | 2 | 0.00 | ||||
| 2025-08-14 | 13F | Warren Averett Asset Management, LLC | 13,073 | -3.67 | 255 | 0.00 | ||||
| 2025-08-15 | 13F | Morgan Stanley | 2,172,900 | 1.30 | 42,458 | 5.00 | ||||
| 2025-08-13 | 13F | EverSource Wealth Advisors, LLC | 0 | -100.00 | 0 | |||||
| 2025-07-31 | 13F | Glass Jacobson Investment Advisors llc | 135 | 0.00 | 3 | 0.00 | ||||
| 2025-07-08 | 13F | Zrc Wealth Management, Llc | 1,311 | 0.00 | 26 | 4.17 | ||||
| 2025-08-01 | 13F | Gwn Securities Inc. | 0 | -100.00 | 0 | |||||
| 2025-08-19 | 13F | Newbridge Financial Services Group, Inc. | 7,449 | -24.94 | 146 | -22.46 | ||||
| 2025-08-08 | 13F | Emerald Investment Partners, Llc | 62,100 | 6.99 | 1,213 | 10.88 | ||||
| 2025-08-14 | 13F | UBS Group AG | 298,828 | -2.14 | 5,839 | 1.44 | ||||
| 2025-07-22 | 13F | Merit Financial Group, LLC | 131,883 | 55.57 | 2,577 | 61.30 | ||||
| 2025-07-28 | 13F | Harbour Investments, Inc. | 6,574 | -5.19 | 128 | -1.54 | ||||
| 2025-08-04 | 13F | Wolverine Asset Management Llc | 0 | -100.00 | 0 | |||||
| 2025-07-14 | 13F | Sowell Financial Services LLC | 28,634 | 0.46 | 560 | 4.10 | ||||
| 2025-08-04 | 13F | Assetmark, Inc | 54 | 1 | ||||||
| 2025-07-14 | 13F | Buska Wealth Management, LLC | 19,886 | 3.38 | 389 | 7.18 | ||||
| 2025-08-08 | 13F | Larson Financial Group LLC | 572,383 | 886.63 | 11,184 | 923.24 | ||||
| 2025-08-08 | 13F | Capital Investment Advisory Services, LLC | 4,673 | 2.10 | 91 | 5.81 | ||||
| 2025-04-23 | 13F | Bessemer Group Inc | 0 | -100.00 | 0 | |||||
| 2025-05-29 | NP | BTSAX - BTS Managed Income Fund Class A Shares | 15,669 | -0.67 | 295 | -2.32 | ||||
| 2025-07-11 | 13F | Farther Finance Advisors, LLC | 6,544 | 129.29 | 128 | 139.62 | ||||
| 2025-08-15 | 13F | WFA of San Diego, LLC | 2,300 | -9.80 | 45 | -12.00 | ||||
| 2025-07-10 | 13F | Wealth Enhancement Advisory Services, Llc | 469,408 | 6.94 | 9,261 | 11.93 | ||||
| 2025-07-21 | 13F | Ameritas Advisory Services, LLC | 4,687 | 92 | ||||||
| 2025-08-12 | 13F | Ameritas Investment Partners, Inc. | 1 | 0 | ||||||
| 2025-08-12 | 13F | LPL Financial LLC | 1,101,222 | 14.88 | 21,518 | 19.08 | ||||
| 2025-08-14 | 13F | GWM Advisors LLC | 38,836 | 3.23 | 759 | 6.91 | ||||
| 2025-05-14 | 13F | Oarsman Capital, Inc. | 0 | -100.00 | 0 | -100.00 | ||||
| 2025-08-05 | 13F | Atlas Private Wealth Advisors | 0 | -100.00 | 0 | |||||
| 2025-07-17 | 13F | Wagner Wealth Management, Llc | 3,116 | 0.00 | 61 | 3.45 | ||||
| 2025-07-21 | 13F | Future Financial Wealth Managment LLC | 55,349 | 1.85 | 1,082 | 5.57 | ||||
| 2025-05-14 | 13F | Jane Street Group, Llc | 0 | -100.00 | 0 | |||||
| 2025-08-14 | 13F | Money Concepts Capital Corp | 10,739 | 210 | ||||||
| 2025-05-12 | 13F | Independent Advisor Alliance | 0 | -100.00 | 0 | |||||
| 2025-08-12 | 13F | Cornerstone Wealth Management, LLC | 63,722 | 1,245 | ||||||
| 2025-07-29 | 13F | Mezzasalma Advisors, LLC | 0 | -100.00 | 0 | |||||
| 2025-09-04 | 13F/A | Advisor Group Holdings, Inc. | 185,311 | 7.18 | 3,622 | 11.11 | ||||
| 2025-08-06 | 13F | AE Wealth Management LLC | 1,096 | -63.21 | 21 | -62.50 | ||||
| 2025-08-04 | 13F | Spire Wealth Management | 250 | 0.00 | 5 | 0.00 | ||||
| 2025-08-11 | 13F | Pinnacle Wealth Planning Services, Inc. | 17,190 | 0.00 | 336 | 3.40 | ||||
| 2025-08-11 | 13F | Sykon Capital Llc | 96,215 | -21.11 | 1,880 | -18.23 | ||||
| 2025-04-24 | 13F/A | Golden State Wealth Management, LLC | 0 | -100.00 | 0 | -100.00 | ||||
| 2025-07-21 | 13F | Hudson Valley Investment Advisors Inc /adv | 15,704 | 0.00 | 307 | 3.38 | ||||
| 2025-07-31 | 13F | Oppenheimer & Co Inc | 78,614 | 25.46 | 1,536 | 30.06 | ||||
| 2025-08-13 | 13F | Summit Financial, LLC | 61,860 | 204.16 | 1,209 | 215.40 | ||||
| 2025-08-14 | 13F | Susquehanna International Group, Llp | 0 | -100.00 | 0 | |||||
| 2025-05-08 | 13F | Menard Financial Group LLC | 0 | -100.00 | 0 | |||||
| 2025-08-07 | 13F | 1620 Investment Advisors, Inc. | 435 | 0.00 | 8 | 0.00 | ||||
| 2025-07-25 | 13F | Atria Wealth Solutions, Inc. | 15,263 | -72.01 | 298 | -70.98 | ||||
| 2025-08-14 | 13F | Garden State Investment Advisory Services LLC | 18,941 | 0.00 | 370 | 3.64 | ||||
| 2025-08-07 | 13F | Allworth Financial LP | 40 | 0.00 | 1 | |||||
| 2025-08-08 | 13F | Hartland & Co., LLC | 15,232 | 298 | ||||||
| 2025-07-24 | 13F | IFP Advisors, Inc | 1,620 | 0.00 | 32 | 3.33 | ||||
| 2025-08-07 | 13F | Resources Investment Advisors, LLC. | 13,157 | 2.10 | 257 | 6.20 | ||||
| 2025-08-14 | 13F | Raymond James Financial Inc | 1,152,972 | 13.55 | 22,529 | 17.71 | ||||
| 2025-07-25 | 13F | Endowment Wealth Management, Inc. | 21,888 | 10.05 | 428 | 14.17 | ||||
| 2025-05-29 | NP | ACEFX - Absolute Strategies Fund Institutional Shares | Short | -6,500 | -123 | |||||
| 2025-08-08 | 13F | Beck Bode, LLC | 29,559 | -31.03 | 578 | -28.50 | ||||
| 2025-08-14 | 13F | Bnp Paribas Arbitrage, Sa | 1,396 | -43.55 | 27 | -41.30 | ||||
| 2025-07-08 | 13F | Parallel Advisors, LLC | 321 | 6 | ||||||
| 2025-07-10 | 13F | Atticus Wealth Management, Llc | 4,784 | 0.00 | 93 | 3.33 | ||||
| 2025-08-12 | 13F | Jpmorgan Chase & Co | 0 | -100.00 | 0 | -100.00 | ||||
| 2025-08-14 | 13F/A | Rockefeller Capital Management L.P. | 103,038 | 0.55 | 2,013 | 4.25 | ||||
| 2025-08-01 | 13F | Envestnet Asset Management Inc | 2,851,970 | 8.26 | 55,720 | 12.21 | ||||
| 2025-04-25 | 13F | Tradewinds Capital Management, LLC | 0 | -100.00 | 0 | |||||
| 2025-08-13 | 13F | Level Four Advisory Services, Llc | 10,777 | 4.99 | 211 | 8.81 | ||||
| 2025-07-08 | 13F | Nbc Securities, Inc. | 4,853 | 101.96 | 0 | |||||
| 2025-07-29 | 13F | Chicago Partners Investment Group LLC | 27,137 | -8.60 | 531 | -3.98 | ||||
| 2025-07-14 | 13F | Toth Financial Advisory Corp | 146 | 0.00 | 3 | 0.00 | ||||
| 2025-08-13 | 13F | Jones Financial Companies Lllp | 614 | 12 | ||||||
| 2025-08-01 | 13F | Pasadena Private Wealth, LLC | 0 | -100.00 | 0 | |||||
| 2025-07-29 | 13F | Salomon & Ludwin, LLC | 773 | 0.00 | 15 | 7.14 | ||||
| 2025-08-14 | 13F | CoreCap Advisors, LLC | 7,414 | -0.01 | 145 | 3.60 | ||||
| 2025-08-14 | 13F | Ameriprise Financial Inc | 495,423 | -25.11 | 9,680 | -22.52 | ||||
| 2025-08-15 | 13F | Kestra Advisory Services, LLC | 35,459 | 1.40 | 693 | 5.01 | ||||
| 2025-05-09 | 13F | Pathway Financial Advisers, LLC | 0 | -100.00 | 0 | |||||
| 2025-08-08 | 13F | Avantax Advisory Services, Inc. | 37,727 | -15.01 | 737 | -11.84 | ||||
| 2025-08-14 | 13F | Stifel Financial Corp | 49,382 | -1.92 | 965 | 1.58 | ||||
| 2025-08-14 | 13F | Mariner, LLC | 94,176 | -1.75 | 1,840 | 1.94 | ||||
| 2025-07-25 | 13F | Envestnet Portfolio Solutions, Inc. | 11,180 | -55.41 | 218 | -53.81 | ||||
| 2025-08-14 | 13F | Quartz Partners, LLC | 13,834 | 0.00 | 270 | 3.85 | ||||
| 2025-08-08 | 13F | Compass Financial Services Inc | 14,221 | -29.96 | 278 | -27.49 | ||||
| 2025-07-30 | 13F | BG Investment Services, Inc. | 15,726 | 307 | ||||||
| 2025-07-29 | 13F | Stephens Inc /ar/ | 104,870 | 5.70 | 2,049 | 9.57 | ||||
| 2025-08-07 | 13F | Readystate Asset Management Lp | 15,047 | 294 | ||||||
| 2025-07-25 | 13F | Cwm, Llc | 3,046 | -29.91 | 0 | |||||
| 2025-07-18 | 13F | Marino, Stram & Associates Llc | 46,515 | 0.00 | 909 | 3.65 | ||||
| 2025-07-31 | 13F | Cambridge Investment Research Advisors, Inc. | 202,780 | -13.32 | 4 | -25.00 | ||||
| 2025-08-08 | 13F | Pnc Financial Services Group, Inc. | 11,635 | -1.27 | 227 | 2.25 | ||||
| 2025-08-11 | 13F | Hexagon Capital Partners LLC | 12,299 | 0.00 | 240 | 3.90 | ||||
| 2025-08-13 | 13F | Beacon Pointe Advisors, LLC | 12,189 | -16.01 | 238 | -12.82 | ||||
| 2025-08-11 | 13F | Citigroup Inc | 256 | 0.00 | 5 | 25.00 | ||||
| 2025-07-17 | 13F | Sound Income Strategies, LLC | 60 | 0.00 | 1 | 0.00 | ||||
| 2025-08-05 | 13F | GPS Wealth Strategies Group, LLC | 6,305 | -24.58 | 123 | -21.66 | ||||
| 2025-05-02 | 13F | Apollon Wealth Management, LLC | 0 | -100.00 | 0 | -100.00 | ||||
| 2025-07-14 | 13F | GAMMA Investing LLC | 75,127 | -65.89 | 1,468 | -64.66 | ||||
| 2025-08-05 | 13F | Key FInancial Inc | 6 | 0.00 | 0 | |||||
| 2025-08-13 | 13F | Argyle Capital Partners, LLC | 23,364 | 0.00 | 457 | 3.64 | ||||
| 2025-08-11 | 13F | Principal Securities, Inc. | 149 | 0.00 | 3 | 0.00 | ||||
| 2025-07-07 | 13F | Investors Research Corp | 213 | 0.00 | 4 | 0.00 | ||||
| 2025-08-14 | 13F | Comerica Bank | 21,427 | 1.60 | 419 | 5.29 | ||||
| 2025-07-17 | 13F | Vermillion Wealth Management, Inc. | 1,333 | -0.82 | 26 | 4.00 | ||||
| 2025-08-08 | 13F | Creative Planning | 60,205 | -14.32 | 1,176 | -11.18 | ||||
| 2025-07-07 | 13F | Thurston, Springer, Miller, Herd & Titak, Inc. | 2,613 | 0.00 | 51 | 4.08 | ||||
| 2025-08-15 | 13F | Equitable Holdings, Inc. | 10,431 | -10.03 | 204 | -6.88 | ||||
| 2025-07-24 | 13F | Us Bancorp \de\ | 2,700 | 0.00 | 53 | 4.00 | ||||
| 2025-08-06 | 13F | Commonwealth Equity Services, Llc | 452,065 | -1.76 | 9 | 0.00 | ||||
| 2025-08-27 | 13F/A | Brinker Capital Investments, LLC | 46,084 | -7.88 | 900 | -4.46 | ||||
| 2025-08-08 | 13F | Crossmark Global Holdings, Inc. | 0 | -100.00 | 0 | |||||
| 2025-08-13 | 13F | Johnson Financial Group, Inc. | 462 | 0.00 | 9 | 12.50 | ||||
| 2025-08-13 | 13F | Baird Financial Group, Inc. | 443,295 | 3.86 | 8,662 | 7.66 | ||||
| 2025-08-14 | 13F | Fmr Llc | 2,684 | -63.36 | 52 | -62.32 | ||||
| 2025-08-11 | 13F | Anfield Capital Management, LLC | 7,323 | 0.00 | 143 | 3.62 | ||||
| 2025-08-07 | 13F | Panoramic Investment Advisors, Llc | 51,203 | 0.57 | 1,001 | 4.28 | ||||
| 2025-08-08 | 13F | Intrua Financial, LLC | 470,852 | 237.91 | 9,200 | 250.34 | ||||
| 2025-08-12 | 13F | PSI Advisors, LLC | 0 | -100.00 | 0 | |||||
| 2025-08-14 | 13F | Royal Bank Of Canada | 1,837,577 | -14.03 | 35,906 | -10.88 | ||||
| 2025-08-13 | 13F | Northwestern Mutual Wealth Management Co | 0 | -100.00 | 0 | |||||
| 2025-07-21 | 13F | TFG Advisers LLC | 14,998 | 4.68 | 293 | 8.52 | ||||
| 2025-08-21 | 13F | Aveo Capital Partners, LLC | 0 | -100.00 | 0 | |||||
| 2025-07-29 | 13F | Dumont & Blake Investment Advisors Llc | 137,517 | -0.12 | 2,687 | 3.55 | ||||
| 2025-08-14 | 13F | Bank Of America Corp /de/ | 941,215 | 0.81 | 18,391 | 4.50 | ||||
| 2025-08-11 | 13F | HighTower Advisors, LLC | 103,247 | -12.48 | 2,017 | -9.27 | ||||
| 2025-08-12 | 13F | NWF Advisory Services Inc. | 24,000 | 452 | ||||||
| 2025-07-30 | 13F | BTS Asset Management, Inc. | 0 | -100.00 | 0 | |||||
| 2025-08-12 | 13F | Proequities, Inc. | 0 | 0 | ||||||
| 2025-08-08 | 13F | Cetera Investment Advisers | 498,833 | 19.32 | 9,747 | 23.69 | ||||
| 2025-07-31 | 13F | Moser Wealth Advisors, LLC | 1,000 | 0.00 | 20 | 5.56 | ||||
| 2025-08-11 | 13F | VSM Wealth Advisory, LLC | 4,543 | 1.43 | 89 | 4.76 | ||||
| 2025-08-14 | 13F | Wells Fargo & Company/mn | 1,994,801 | -10.33 | 38,978 | -7.05 | ||||
| 2025-08-11 | 13F | Private Advisor Group, LLC | 25,818 | -1.64 | 504 | 2.02 | ||||
| 2025-07-08 | 13F | Goldstone Financial Group, LLC | 53,404 | -1.69 | 1,054 | 2.93 | ||||
| 2025-07-24 | 13F | Von Berge Wealth Management Group, LLC | 12,035 | 1.69 | 235 | 8.84 | ||||
| 2025-08-12 | 13F | Global Retirement Partners, LLC | 44 | 4.76 | 1 | |||||
| 2025-08-18 | 13F | Geneos Wealth Management Inc. | 48,941 | 20.26 | 956 | 24.64 | ||||
| 2025-07-09 | 13F | Massmutual Trust Co Fsb/adv | 244 | 5 | ||||||
| 2025-08-06 | 13F | Aspect Partners, LLC | 590 | 12 | ||||||
| 2025-08-12 | 13F | Gladstone Institutional Advisory LLC | 20,512 | -2.81 | 401 | 0.76 | ||||
| 2025-08-14 | 13F | Glen Eagle Advisors, LLC | 3,405 | 0.00 | 67 | 3.13 |