Mga Batayang Estadistika
| Pemilik Institusional | 169 total, 169 long only, 0 short only, 0 long/short - change of -3.98% MRQ |
| Alokasi Portofolio Rata-rata | 0.3288 % - change of -13.17% MRQ |
| Saham Institusional (Jangka Panjang) | 15,735,335 (ex 13D/G) - change of 1.04MM shares 7.07% MRQ |
| Nilai Institusional (Jangka Panjang) | $ 439,869 USD ($1000) |
Kepemilikan Institusional dan Pemegang Saham
SPDR Series Trust - SPDR ICE Preferred Securities ETF (US:PSK) memiliki 169 pemilik institusional dan pemegang saham yang telah mengajukan formulir 13D/G atau 13F kepada Komisi Bursa Efek (Securities Exchange Commission/SEC). Lembaga-lembaga ini memegang total 15,735,335 saham. Pemegang saham terbesar meliputi Wells Fargo & Company/mn, Kingstone Capital Partners Texas, LLC, Morgan Stanley, Bank of New York Mellon Corp, Royal Bank Of Canada, State of Wisconsin - Board of Commissioners of Public Lands, CNO Financial Group, Inc., Envestnet Asset Management Inc, LPL Financial LLC, and Park Avenue Securities Llc .
Struktur kepemilikan institusional SPDR Series Trust - SPDR ICE Preferred Securities ETF (ARCA:PSK) menunjukkan posisi terkini di perusahaan oleh institusi dan dana, serta perubahan terbaru dalam ukuran posisi. Pemegang saham utama dapat mencakup investor individu, reksa dana, dana lindung nilai, atau institusi. Jadwal 13D menunjukkan bahwa investor memegang (atau pernah memegang) lebih dari 5% saham perusahaan dan bermaksud (atau pernah bermaksud) untuk secara aktif mengejar perubahan strategi bisnis. Jadwal 13G menunjukkan investasi pasif lebih dari 5%.
The share price as of September 5, 2025 is 33.07 / share. Previously, on September 9, 2024, the share price was 35.20 / share. This represents a decline of 6.05% over that period.

Skor Sentimen Dana
Skor Sentimen Dana (sebelumnya dikenal sebagai Skor Akumulasi Kepemilikan) menemukan saham-saham yang paling banyak dibeli oleh dana. Ini adalah hasil dari model kuantitatif multi-faktor yang canggih yang mengidentifikasi perusahaan dengan tingkat akumulasi institusional tertinggi. Model penilaian menggunakan kombinasi dari total peningkatan pemilik yang diungkapkan, perubahan dalam alokasi portofolio pada pemilik tersebut, dan metrik lainnya. Angka berkisar dari 0 hingga 100, dengan angka yang lebih tinggi menunjukkan tingkat akumulasi yang lebih tinggi dibandingkan dengan perusahaan sejenisnya, dan 50 adalah rata-ratanya.
Frekuensi Pembaruan: Setiap Hari
Lihat Ownership Explorer, yang menyediakan daftar perusahaan dengan peringkat tertinggi.
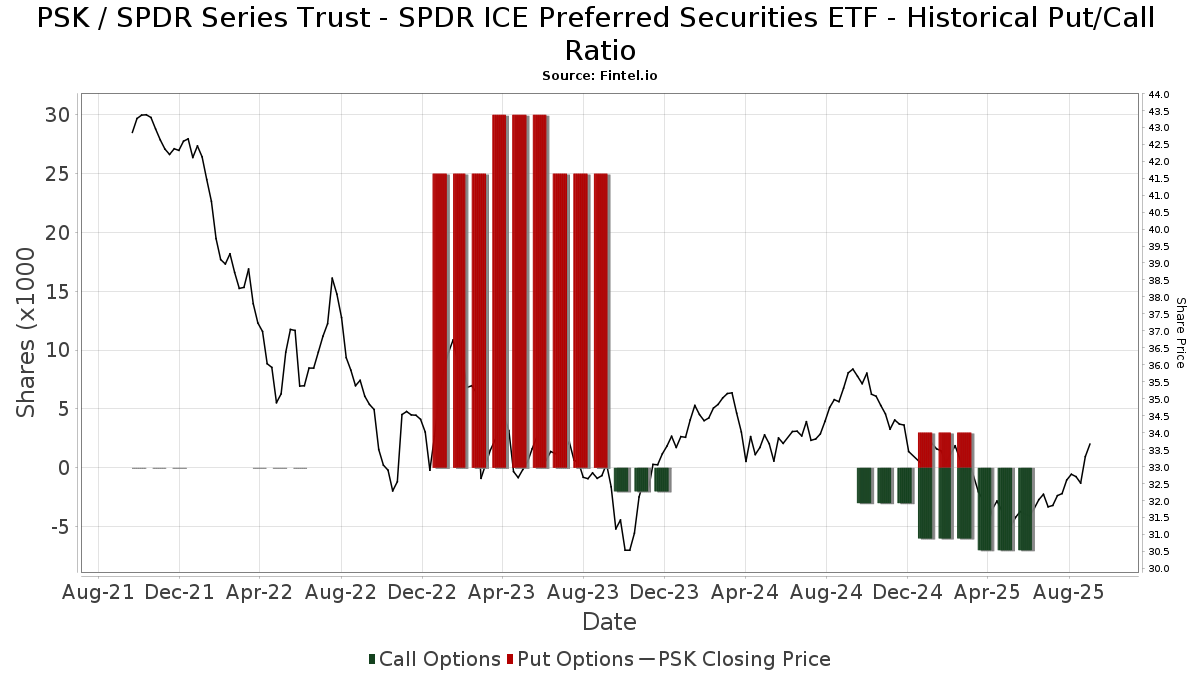
Rasio Put/Call Institusional
Selain melaporkan isu ekuitas dan utang standar, institusi dengan aset di bawah manajemen lebih dari 100 juta dolar AS juga harus mengungkapkan kepemilikan opsi put dan call mereka. Karena opsi put umumnya menunjukkan sentimen negatif, dan opsi call menunjukkan sentimen positif, kita dapat mengetahui sentimen institusional secara keseluruhan dengan memplot rasio put terhadap call. Grafik di sebelah kanan memplot rasio put/call historis untuk instrumen ini.
Menggunakan Rasio Put/Call sebagai indikator sentimen investor mengatasi salah satu kekurangan utama dari penggunaan total kepemilikan institusional, yaitu sejumlah besar aset yang dikelola diinvestasikan secara pasif untuk melacak indeks. Dana yang dikelola secara pasif biasanya tidak membeli opsi, sehingga indikator rasio put/call lebih akurat dalam melacak sentimen dana yang dikelola secara aktif.
Pengajuan 13F dan NPORT
Detail pada pengajuan 13F tersedia gratis. Detail pada pengajuan NP memerlukan keanggotaan premium. Baris berwarna hijau menunjukkan posisi baru. Baris berwarna merah menunjukkan posisi yang sudah ditutup. Klik tautan ini ikon untuk melihat riwayat transaksi selengkapnya.
Tingkatkan
untuk membuka data premium dan mengekspor ke Excel ![]() .
.
| Tanggal File | Sumber | Investor | Ketik | Presyo ng Avg (Silangan) |
Saham | Δ Saham (%) |
Dilaporkan Nilai ($1000) |
Nilai Δ (%) |
Alokasi Port (%) |
|
|---|---|---|---|---|---|---|---|---|---|---|
| 2025-08-06 | 13F | Prospera Financial Services Inc | 6,530 | -37.55 | 207 | -38.76 | ||||
| 2025-08-12 | 13F | Putnam Fl Investment Management Co | 19,036 | -96.97 | 605 | -97.03 | ||||
| 2025-08-04 | 13F | Keybank National Association/oh | 8,100 | 0.00 | 257 | -1.91 | ||||
| 2025-07-21 | 13F | Crews Bank & Trust | 286,753 | -2.33 | 9,107 | -4.23 | ||||
| 2025-07-11 | 13F | Kingstone Capital Partners Texas, LLC | 1,203,024 | 41 | ||||||
| 2025-08-14 | 13F | Betterment LLC | 24,739 | 3.23 | 1 | |||||
| 2025-07-22 | 13F | Checchi Capital Advisers, LLC | 0 | -100.00 | 0 | |||||
| 2025-07-25 | 13F | Apollon Wealth Management, LLC | 12,335 | -21.60 | 392 | -23.18 | ||||
| 2025-07-16 | 13F | FORM Wealth Advisors, LLC | 9,825 | 1.35 | 312 | -0.32 | ||||
| 2025-08-15 | 13F | Morgan Stanley | 1,168,821 | -14.40 | 37,122 | -16.07 | ||||
| 2025-07-21 | 13F | Fortis Capital Advisors, LLC | 0 | -100.00 | 0 | |||||
| 2025-08-12 | 13F | Coldstream Capital Management Inc | 0 | -100.00 | 0 | |||||
| 2025-08-15 | 13F | Tower Research Capital LLC (TRC) | 3 | -50.00 | 0 | |||||
| 2025-07-22 | 13F | Iron Horse Wealth Management, LLC | 2,067 | -6.17 | 66 | -8.45 | ||||
| 2025-08-05 | 13F | Artemis Wealth Advisors, LLC | 10,371 | 1.68 | 329 | -0.30 | ||||
| 2025-08-12 | 13F | Steward Partners Investment Advisory, Llc | 2,142 | -36.72 | 68 | -37.61 | ||||
| 2025-08-18 | 13F | Geneos Wealth Management Inc. | 6,224 | -5.37 | 198 | -7.51 | ||||
| 2025-07-25 | 13F | Envestnet Portfolio Solutions, Inc. | 30,754 | -9.31 | 977 | -11.11 | ||||
| 2025-07-22 | 13F | Wealthcare Advisory Partners LLC | 38,194 | 1.19 | 1,213 | -0.74 | ||||
| 2025-07-18 | 13F | Truist Financial Corp | 211,217 | -22.73 | 6,708 | -24.23 | ||||
| 2025-08-04 | 13F | Assetmark, Inc | 0 | -100.00 | 0 | |||||
| 2025-08-11 | 13F | State of Wisconsin - Board of Commissioners of Public Lands | 840,093 | 0.00 | 26,681 | -1.94 | ||||
| 2025-08-01 | 13F | Austin Private Wealth, LLC | 7,240 | 13.69 | 230 | 11.17 | ||||
| 2025-07-24 | 13F | IFP Advisors, Inc | 398 | 5.01 | 13 | 0.00 | ||||
| 2025-08-28 | NP | INKM - SPDR SSGA Income Allocation ETF This fund is a listed as child fund of State Street Corp and if that institution has disclosed ownership in this security, then these positions will not be double counted when calculating total shares and total value | 128,189 | -3.65 | 4,071 | -5.52 | ||||
| 2025-07-10 | 13F | Wedmont Private Capital | 11,780 | 1.72 | 379 | 5.57 | ||||
| 2025-07-23 | 13F | Fulton Breakefield Broenniman Llc | 34,617 | -3.66 | 1,099 | -5.50 | ||||
| 2025-07-10 | 13F | Bath Savings Trust Co | 32,072 | -2.95 | 1,019 | -4.86 | ||||
| 2025-08-18 | 13F | Front Row Advisors LLC | 139 | -35.35 | 4 | -33.33 | ||||
| 2025-08-14 | 13F | Sunbelt Securities, Inc. | 2,298 | 0.00 | 76 | 1.35 | ||||
| 2025-08-11 | 13F | Delta Asset Management Llc/tn | 56 | 0.00 | 2 | 0.00 | ||||
| 2025-08-05 | 13F | GPS Wealth Strategies Group, LLC | 103 | 0.00 | 3 | 0.00 | ||||
| 2025-07-21 | 13F | Ameritas Advisory Services, LLC | 54,452 | -28.04 | 1,729 | -29.46 | ||||
| 2025-08-12 | 13F | Jpmorgan Chase & Co | 25,649 | -52.17 | 815 | -53.14 | ||||
| 2025-07-16 | 13F | Twelve Points Wealth Management LLC | 153,924 | 6.55 | 4,889 | 4.47 | ||||
| 2025-08-06 | 13F | Aspetuck Financial Management LLC | 57,970 | 0.00 | 1,841 | -1.92 | ||||
| 2025-08-11 | 13F | Hexagon Capital Partners LLC | 0 | -100.00 | 0 | |||||
| 2025-08-11 | 13F | Strategic Wealth Partners, Ltd. | 3,045 | 97 | ||||||
| 2025-05-15 | 13F/A | Orion Portfolio Solutions, LLC | 62,116 | -3.91 | 2,012 | -5.68 | ||||
| 2025-07-17 | 13F | Greenleaf Trust | 37,951 | 1,205 | ||||||
| 2025-07-16 | 13F | Signaturefd, Llc | 1 | 0.00 | 0 | |||||
| 2025-08-14 | 13F | Transamerica Financial Advisors, Inc. | 198 | 0.00 | 6 | |||||
| 2025-05-14 | 13F | First Trust Advisors Lp | 0 | -100.00 | 0 | |||||
| 2025-08-06 | 13F | AE Wealth Management LLC | 615 | 20 | ||||||
| 2025-08-05 | 13F | Atlas Private Wealth Advisors | 369,431 | -1.86 | 11,733 | -3.76 | ||||
| 2025-07-17 | 13F | Vermillion Wealth Management, Inc. | 492 | 1.44 | 16 | 0.00 | ||||
| 2025-08-14 | 13F/A | Rockefeller Capital Management L.P. | 17,789 | 22.08 | 565 | 19.75 | ||||
| 2025-08-04 | 13F | JDM Financial Group LLC | 1,350 | 0.00 | 43 | -2.33 | ||||
| 2025-08-07 | 13F | Allworth Financial LP | 125,398 | -19.67 | 3,983 | -20.10 | ||||
| 2025-04-24 | 13F | Falcon Wealth Planning | 0 | -100.00 | 0 | |||||
| 2025-08-14 | 13F | Financial Network Wealth Advisors LLC | 57 | 0.00 | 2 | 0.00 | ||||
| 2025-04-28 | 13F | Strategic Financial Concepts, LLC | 0 | -100.00 | 0 | -100.00 | ||||
| 2025-08-14 | 13F | Hrt Financial Lp | 14,747 | 0 | ||||||
| 2025-08-15 | 13F | WFA of San Diego, LLC | 2,649 | -15.07 | 84 | -24.32 | ||||
| 2025-08-12 | 13F | PSI Advisors, LLC | 0 | -100.00 | 0 | |||||
| 2025-08-14 | 13F | Qube Research & Technologies Ltd | 1,900 | 3.26 | 60 | 1.69 | ||||
| 2025-08-08 | 13F | Foundations Investment Advisors, LLC | 6,941 | 220 | ||||||
| 2025-07-23 | 13F | Nbt Bank N A /ny | 22,216 | 45.96 | 706 | 43.00 | ||||
| 2025-04-25 | 13F | WASHINGTON TRUST Co | 0 | -100.00 | 0 | |||||
| 2025-05-12 | 13F | Independent Advisor Alliance | 0 | -100.00 | 0 | |||||
| 2025-05-12 | 13F | BEAM Asset Management, LLC | 0 | -100.00 | 0 | -100.00 | ||||
| 2025-07-11 | 13F | Farther Finance Advisors, LLC | 4,442 | -13.28 | 141 | -14.02 | ||||
| 2025-07-24 | 13F | Costello Asset Management, INC | 79 | -22.55 | 3 | -33.33 | ||||
| 2025-08-14 | 13F | Mariner, LLC | 66,099 | -20.06 | 2,099 | -21.62 | ||||
| 2025-05-13 | 13F | Prudential Plc | 0 | -100.00 | 0 | |||||
| 2025-07-31 | 13F | Topsail Wealth Management, LLC | 1,158 | 0.00 | 37 | -2.70 | ||||
| 2025-09-04 | 13F/A | Advisor Group Holdings, Inc. | 54,067 | 54.41 | 1,718 | 51.41 | ||||
| 2025-07-15 | 13F | Garrett Investment Advisors LLC | 22,898 | 4.60 | 727 | 2.54 | ||||
| 2025-08-14 | 13F | Ameriprise Financial Inc | 84,149 | 8.32 | 2,673 | 6.20 | ||||
| 2025-05-09 | 13F | GeoWealth Management, LLC | 0 | -100.00 | 0 | |||||
| 2025-08-07 | 13F | Midwest Trust Co | 162,972 | 5,176 | ||||||
| 2025-08-12 | 13F | SRS Capital Advisors, Inc. | 83 | 0.00 | 3 | 0.00 | ||||
| 2025-07-14 | 13F | Park Avenue Securities Llc | 464,183 | -0.28 | 15 | -6.67 | ||||
| 2025-08-06 | 13F | Rialto Wealth Management, LLC | 1,087 | 0.00 | 35 | -2.86 | ||||
| 2025-07-14 | 13F | Matrix Trust Co | 23,275 | 1.20 | 1 | |||||
| 2025-04-09 | 13F | RFG Advisory, LLC | 0 | -100.00 | 0 | |||||
| 2025-07-08 | 13F | Parallel Advisors, LLC | 2,756 | 0.00 | 88 | -2.25 | ||||
| 2025-07-07 | 13F | Trust Co | 500 | 0.00 | 16 | -6.25 | ||||
| 2025-07-10 | 13F | SK Wealth Management, LLC | 0 | -100.00 | 0 | |||||
| 2025-08-11 | 13F | Aptus Capital Advisors, LLC | 100 | 0.00 | 3 | 0.00 | ||||
| 2025-08-12 | 13F | Franklin Resources Inc | 4,489 | 143 | ||||||
| 2025-08-08 | 13F | TD Capital Management LLC | 9,104 | 0.19 | 289 | -1.70 | ||||
| 2025-07-15 | 13F | McAdam, LLC | 20,111 | -8.57 | 639 | -10.39 | ||||
| 2025-04-22 | 13F | PFG Investments, LLC | 0 | -100.00 | 0 | |||||
| 2025-08-06 | 13F | Sage Advisory Services, Ltd.Co. | 331,489 | 20.34 | 10,528 | 18.00 | ||||
| 2025-08-08 | 13F | Tanglewood Legacy Advisors, LLC | 0 | -100.00 | 0 | |||||
| 2025-08-12 | 13F | Inscription Capital, LLC | 13,073 | 0.00 | 415 | -8.79 | ||||
| 2025-08-04 | 13F | Mayflower Financial Advisors, LLC | 7,875 | 0.00 | 250 | -1.96 | ||||
| 2025-08-01 | 13F | Shilanski & Associates, Inc. | 146,118 | 4.45 | 4,641 | 2.41 | ||||
| 2025-07-23 | 13F/A | Euro Pacific Asset Management, LLC | 15,965 | 0.00 | 1 | |||||
| 2025-04-23 | 13F | Creative Financial Designs Inc /adv | 0 | -100.00 | 0 | |||||
| 2025-08-14 | 13F | Boston Private Wealth Llc | 0 | -100.00 | 0 | |||||
| 2025-08-14 | 13F | Destination Wealth Management | 8,507 | 11.63 | 270 | 9.76 | ||||
| 2025-08-12 | 13F | AlphaCore Capital LLC | 1,966 | 0.00 | 62 | -1.59 | ||||
| 2025-04-29 | 13F | Pensionmark Financial Group, Llc | 0 | -100.00 | 0 | |||||
| 2025-08-12 | 13F | Charles Schwab Investment Management Inc | 112,599 | -4.29 | 3,576 | -6.14 | ||||
| 2025-08-13 | 13F | Jones Financial Companies Lllp | 11,185 | -4.45 | 355 | -6.58 | ||||
| 2025-08-05 | 13F | Bank Of Montreal /can/ | 42,800 | 0.42 | 1,359 | -1.52 | ||||
| 2025-08-07 | 13F | FDx Advisors, Inc. | 61,523 | 0.11 | 2 | 0.00 | ||||
| 2025-08-06 | 13F | Long Run Wealth Advisors, LLC | 201,124 | 8.64 | 6,388 | 6.52 | ||||
| 2025-08-08 | 13F | Capital Investment Advisory Services, LLC | 853 | 132.43 | 27 | 145.45 | ||||
| 2025-08-14 | 13F | GWM Advisors LLC | 18,584 | -5.77 | 590 | -7.52 | ||||
| 2025-08-11 | 13F | Private Advisor Group, LLC | 45,259 | -24.84 | 1,437 | -26.31 | ||||
| 2025-07-22 | 13F | Rocky Mountain Advisers, Llc | 1,620 | 0.00 | 51 | -1.92 | ||||
| 2025-08-14 | 13F | Susquehanna International Group, Llp | 15,893 | 18.69 | 505 | 16.40 | ||||
| 2025-08-12 | 13F | Zacks Investment Management | 108,397 | 234.10 | 3,443 | 227.81 | ||||
| 2025-08-11 | 13F | Cornerstone Planning Group LLC | 1,007 | 1.72 | 33 | 3.23 | ||||
| 2025-08-11 | 13F | Citigroup Inc | 300 | 0.00 | 10 | 0.00 | ||||
| 2025-07-31 | 13F | GLOBALT Investments LLC / GA | 14,306 | -10.39 | 454 | -12.19 | ||||
| 2025-07-24 | 13F | Us Bancorp \de\ | 9,683 | 6.35 | 308 | 4.42 | ||||
| 2025-08-12 | 13F | NFP Retirement, Inc. | 41,436 | -13.46 | 1,316 | -15.10 | ||||
| 2025-08-14 | 13F | Wiley Bros.-aintree Capital, Llc | 116,753 | 31.59 | 3,723 | 29.06 | ||||
| 2025-08-05 | 13F | NewSquare Capital LLC | 485 | 0.00 | 15 | 0.00 | ||||
| 2025-08-14 | 13F | Wells Fargo & Company/mn | 1,742,070 | 81.86 | 55,328 | 78.33 | ||||
| 2025-08-05 | 13F | Crestwood Advisors Group LLC | 19,646 | -13.91 | 624 | -15.70 | ||||
| 2025-07-17 | 13F | Chatham Capital Group, Inc. | 0 | -100.00 | 0 | |||||
| 2025-08-13 | 13F | Northwestern Mutual Wealth Management Co | 10,838 | 30.85 | 344 | 28.36 | ||||
| 2025-08-13 | 13F | Lido Advisors, LLC | 280,403 | 32.24 | 8,906 | 29.68 | ||||
| 2025-07-17 | 13F | Sound Income Strategies, LLC | 161,023 | -1.21 | 5,114 | -3.13 | ||||
| 2025-07-29 | 13F | Tradewinds Capital Management, LLC | 6,693 | 0.00 | 213 | -1.85 | ||||
| 2025-08-14 | 13F | Synovus Financial Corp | 21,986 | 3.60 | 698 | 1.60 | ||||
| 2025-08-15 | 13F | Provenance Wealth Advisors, LLC | 31,535 | 0.00 | 1,002 | -1.96 | ||||
| 2025-07-17 | 13F | Eclectic Associates Inc /adv | 11,653 | 0.21 | 370 | -1.60 | ||||
| 2025-08-14 | 13F | Citadel Advisors Llc | 50,363 | 1,600 | ||||||
| 2025-04-28 | 13F | D.a. Davidson & Co. | 0 | -100.00 | 0 | |||||
| 2025-08-01 | 13F | Envestnet Asset Management Inc | 582,101 | 2.71 | 18,488 | 0.71 | ||||
| 2025-08-06 | 13F | Commonwealth Equity Services, Llc | 20,589 | -17.92 | 1 | |||||
| 2025-08-14 | 13F | Sequent Planning LLC | 17,639 | 35.08 | 560 | 32.70 | ||||
| 2025-08-14 | 13F | Citadel Advisors Llc | Call | 7,500 | 22.95 | 238 | 20.81 | |||
| 2025-07-08 | 13F | Nbc Securities, Inc. | 3,019 | 40.75 | 0 | |||||
| 2025-07-17 | 13F | Barry Investment Advisors, LLC | 104,355 | -47.30 | 3,314 | -48.32 | ||||
| 2025-07-31 | 13F | Sharper & Granite LLC | 18,075 | 12.79 | 579 | 11.37 | ||||
| 2025-08-13 | 13F | Vermillion & White Wealth Management Group, LLC | 1,414 | 0.00 | 45 | -2.22 | ||||
| 2025-08-14 | 13F | Aureus Asset Management, LLC | 0 | -100.00 | 0 | |||||
| 2025-07-28 | 13F | Rosenberg Matthew Hamilton | 59,989 | -2.97 | 1,905 | -4.85 | ||||
| 2025-08-08 | 13F | Wiser Advisor Group LLC | 0 | -100.00 | 0 | |||||
| 2025-08-13 | 13F/A | StoneX Group Inc. | 0 | -100.00 | 0 | -100.00 | ||||
| 2025-08-05 | 13F | Bank of New York Mellon Corp | 1,094,854 | -1.41 | 34,773 | -3.33 | ||||
| 2025-08-15 | 13F | Equitable Holdings, Inc. | 8,281 | -53.02 | 263 | -53.86 | ||||
| 2025-05-14 | 13F | Jane Street Group, Llc | 0 | -100.00 | 0 | |||||
| 2025-08-11 | 13F | HighTower Advisors, LLC | 6,968 | -1.37 | 221 | -3.07 | ||||
| 2025-08-14 | 13F | UBS Group AG | 284,976 | 3.04 | 9,051 | 1.04 | ||||
| 2025-07-16 | 13F | St Germain D J Co Inc | 187,190 | -30.24 | 5,945 | -31.59 | ||||
| 2025-08-08 | 13F | SBI Securities Co., Ltd. | 23 | -28.12 | 1 | -100.00 | ||||
| 2025-08-14 | 13F | CoreCap Advisors, LLC | 1,299 | -4.34 | 41 | -4.65 | ||||
| 2025-07-28 | 13F | Duncker Streett & Co Inc | 2,000 | 0.00 | 64 | -1.56 | ||||
| 2025-08-11 | 13F | Principal Securities, Inc. | 56 | 366.67 | 2 | |||||
| 2025-05-02 | 13F | Larson Financial Group LLC | 0 | -100.00 | 0 | |||||
| 2025-08-12 | 13F | Deutsche Bank Ag\ | 40,050 | 1,272 | ||||||
| 2025-08-12 | 13F | Proequities, Inc. | 0 | 0 | ||||||
| 2025-08-01 | 13F | Financial Counselors Inc | 0 | -100.00 | 0 | |||||
| 2025-08-18 | 13F/A | National Bank Of Canada /fi/ | 450 | 0.00 | 14 | 0.00 | ||||
| 2025-08-08 | 13F | Pnc Financial Services Group, Inc. | 110,432 | -5.22 | 3,507 | -7.05 | ||||
| 2025-05-13 | 13F | Elevation Capital Advisory, LLC | 0 | -100.00 | 0 | |||||
| 2025-07-18 | 13F | Pure Financial Advisors, Inc. | 24,323 | 64.92 | 772 | 61.84 | ||||
| 2025-08-12 | 13F | Global Retirement Partners, LLC | 0 | -100.00 | 0 | |||||
| 2025-05-02 | 13F | BlackRock, Inc. | 0 | -100.00 | 0 | -100.00 | ||||
| 2025-07-10 | 13F | HF Advisory Group, LLC | 7,372 | 1.36 | 234 | -0.43 | ||||
| 2025-07-14 | 13F | Sowell Financial Services LLC | 16,010 | 4.27 | 508 | 2.21 | ||||
| 2025-08-15 | 13F | Kestra Advisory Services, LLC | 11,650 | 24.07 | 370 | 21.71 | ||||
| 2025-07-17 | 13F | Fifth Third Securities, Inc. | 21,028 | 9.34 | 668 | 7.23 | ||||
| 2025-07-10 | 13F | Wealth Enhancement Advisory Services, Llc | 75,966 | -4.64 | 2,437 | -5.58 | ||||
| 2025-07-22 | 13F | Financial Insights, Inc. | 10,640 | -62.70 | 338 | -63.53 | ||||
| 2025-08-15 | 13F | Cornerstone Financial Group, LLC /NE/ | 18,194 | 1.93 | 578 | 2.30 | ||||
| 2025-08-08 | 13F | Cetera Investment Advisers | 98,114 | -3.64 | 3,116 | -5.49 | ||||
| 2025-08-12 | 13F | LPL Financial LLC | 496,300 | -11.50 | 15,762 | -13.22 | ||||
| 2025-07-07 | 13F | Thurston, Springer, Miller, Herd & Titak, Inc. | 11,185 | 14.69 | 355 | 12.70 | ||||
| 2025-08-14 | 13F | Gotham Asset Management, LLC | 7,273 | 231 | ||||||
| 2025-08-27 | 13F/A | Brinker Capital Investments, LLC | 58,405 | -5.97 | 1,855 | -7.81 | ||||
| 2025-07-22 | 13F | DAVENPORT & Co LLC | 8,171 | 19.79 | 260 | 17.73 | ||||
| 2025-04-16 | 13F | Caldwell Securities, Inc | 0 | -100.00 | 0 | -100.00 | ||||
| 2025-08-11 | 13F | Parr Mcknight Wealth Management Group, Llc | 10,000 | 0.00 | 318 | -1.86 | ||||
| 2025-08-13 | 13F | Townsquare Capital Llc | 8,429 | -13.65 | 268 | -15.51 | ||||
| 2025-08-14 | 13F | Bank Of America Corp /de/ | 212,346 | -1.15 | 6,744 | -3.08 | ||||
| 2025-08-14 | 13F | Comerica Bank | 9,455 | -5.13 | 300 | -6.83 | ||||
| 2025-08-12 | 13F | MAI Capital Management | 1,149 | 0.00 | 36 | -2.70 | ||||
| 2025-04-28 | 13F | Financial Advocates Investment Management | 0 | -100.00 | 0 | |||||
| 2025-07-15 | 13F | Shulman DeMeo Asset Management LLC | 111,752 | -0.60 | 3,549 | -2.53 | ||||
| 2025-07-07 | 13F | Investors Research Corp | 93,623 | -0.92 | 2,973 | -2.84 | ||||
| 2025-07-22 | 13F | Belpointe Asset Management LLC | 0 | -100.00 | 0 | |||||
| 2025-08-01 | 13F | Vision Financial Markets Llc | 145 | 2.11 | 5 | 0.00 | ||||
| 2025-08-14 | 13F | Mercer Global Advisors Inc /adv | 48,324 | -38.08 | 1,535 | -39.30 | ||||
| 2025-08-07 | 13F | Parkside Financial Bank & Trust | 693 | 0.00 | 22 | 0.00 | ||||
| 2025-07-17 | 13F | Mokosak Advisory Group, LLC | 7,657 | 1.71 | 243 | 0.00 | ||||
| 2025-07-25 | 13F | Cwm, Llc | 1,747 | 5.18 | 0 | |||||
| 2025-08-08 | 13F | CNO Financial Group, Inc. | 700,000 | 0.00 | 22,232 | -1.95 | ||||
| 2025-08-14 | 13F | Raymond James Financial Inc | 305,707 | 7.55 | 9,709 | 5.45 | ||||
| 2025-08-14 | 13F | MGB Wealth Management, LLC | 485 | 0.00 | 15 | 0.00 | ||||
| 2025-08-27 | NP | Mason Capital Fund Trust - Fundamentals First ETF | 1,424 | 0.00 | 45 | -2.17 | ||||
| 2025-07-22 | 13F | Diligent Investors, LLC | 23,449 | 0.01 | 745 | -1.98 | ||||
| 2025-08-14 | 13F | Royal Bank Of Canada | 932,939 | -5.44 | 29,630 | -7.28 | ||||
| 2025-07-08 | 13F | Lowe Wealth Advisors, LLC | 3,538 | 0.00 | 112 | -1.75 | ||||
| 2025-07-17 | 13F | XML Financial, LLC | 30,655 | -5.41 | 974 | -7.24 | ||||
| 2025-04-22 | 13F | Nilsine Partners, LLC | 0 | -100.00 | 0 | |||||
| 2025-07-14 | 13F | Armstrong Advisory Group, Inc | 0 | -100.00 | 0 | |||||
| 2025-07-29 | 13F | Stratos Wealth Partners, LTD. | 6,370 | -16.92 | 202 | -18.55 | ||||
| 2025-05-02 | 13F | Wealthfront Advisers Llc | 0 | -100.00 | 0 | -100.00 | ||||
| 2025-08-05 | 13F | Key FInancial Inc | 1,618 | -58.71 | 51 | -59.52 | ||||
| 2025-08-12 | 13F | Wayfinding Financial, LLC | 7,266 | 171.02 | 0 | |||||
| 2025-08-14 | 13F | Fmr Llc | 100 | 3 | ||||||
| 2025-08-14 | 13F | Hilton Capital Management, LLC | 0 | -100.00 | 0 | |||||
| 2025-08-14 | 13F | Harvest Investment Services, LLC | 6,746 | 0.69 | 214 | -1.38 | ||||
| 2025-04-17 | 13F | Monticello Wealth Management, Llc | 0 | -100.00 | 0 | |||||
| 2025-08-14 | 13F | Voya Financial Advisors, Inc. | 56,383 | 6.51 | 1,792 | 4.13 | ||||
| 2025-08-01 | 13F | Alexander Labrunerie & Co., Inc. | 26,274 | -4.03 | 834 | -5.87 | ||||
| 2025-07-29 | 13F | Private Trust Co Na | 12,701 | -28.26 | 403 | -29.67 | ||||
| 2025-08-08 | 13F | Hartland & Co., LLC | 773 | 12.03 | 25 | 9.09 | ||||
| 2025-08-14 | 13F | Citadel Advisors Llc | Put | 0 | -100.00 | 0 | ||||
| 2025-08-15 | 13F | Captrust Financial Advisors | 14,717 | 467 | ||||||
| 2025-08-13 | 13F | Capital Analysts, Inc. | 91 | 0.00 | 0 | |||||
| 2025-04-24 | 13F | Mirae Asset Global Investments Co., Ltd. | 0 | -100.00 | 0 | |||||
| 2025-08-14 | 13F | Mml Investors Services, Llc | 17,880 | -13.06 | 1 | |||||
| 2025-07-31 | 13F | Cambridge Investment Research Advisors, Inc. | 29,935 | 2.12 | 1 |