Mga Batayang Estadistika
| Pemilik Institusional | 113 total, 113 long only, 0 short only, 0 long/short - change of -5.00% MRQ |
| Alokasi Portofolio Rata-rata | 0.2576 % - change of 22.20% MRQ |
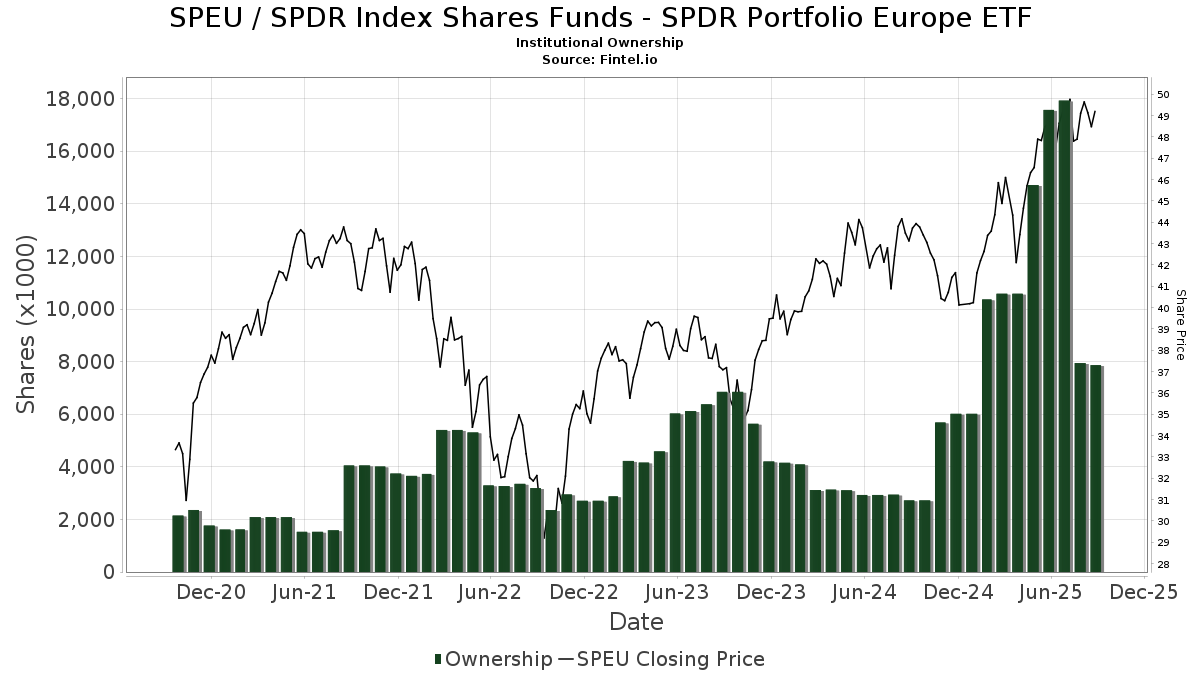
| Saham Institusional (Jangka Panjang) | 7,866,651 (ex 13D/G) - change of -9.70MM shares -55.23% MRQ |
| Nilai Institusional (Jangka Panjang) | $ 258,725 USD ($1000) |
Kepemilikan Institusional dan Pemegang Saham
SPDR Index Shares Funds - SPDR Portfolio Europe ETF (US:SPEU) memiliki 113 pemilik institusional dan pemegang saham yang telah mengajukan formulir 13D/G atau 13F kepada Komisi Bursa Efek (Securities Exchange Commission/SEC). Lembaga-lembaga ini memegang total 7,866,651 saham. Pemegang saham terbesar meliputi Cwm, Llc, Morgan Stanley, Jane Street Group, Llc, Advisor Group Holdings, Inc., INTL - Main International ETF, Main Management ETF Advisors, LLC, LPL Financial LLC, Bank Of America Corp /de/, Jacobi Capital Management LLC, and Charles Schwab Investment Management Inc .
Struktur kepemilikan institusional SPDR Index Shares Funds - SPDR Portfolio Europe ETF (ARCA:SPEU) menunjukkan posisi terkini di perusahaan oleh institusi dan dana, serta perubahan terbaru dalam ukuran posisi. Pemegang saham utama dapat mencakup investor individu, reksa dana, dana lindung nilai, atau institusi. Jadwal 13D menunjukkan bahwa investor memegang (atau pernah memegang) lebih dari 5% saham perusahaan dan bermaksud (atau pernah bermaksud) untuk secara aktif mengejar perubahan strategi bisnis. Jadwal 13G menunjukkan investasi pasif lebih dari 5%.
The share price as of September 5, 2025 is 49.04 / share. Previously, on September 9, 2024, the share price was 43.08 / share. This represents an increase of 13.82% over that period.
Skor Sentimen Dana
Skor Sentimen Dana (sebelumnya dikenal sebagai Skor Akumulasi Kepemilikan) menemukan saham-saham yang paling banyak dibeli oleh dana. Ini adalah hasil dari model kuantitatif multi-faktor yang canggih yang mengidentifikasi perusahaan dengan tingkat akumulasi institusional tertinggi. Model penilaian menggunakan kombinasi dari total peningkatan pemilik yang diungkapkan, perubahan dalam alokasi portofolio pada pemilik tersebut, dan metrik lainnya. Angka berkisar dari 0 hingga 100, dengan angka yang lebih tinggi menunjukkan tingkat akumulasi yang lebih tinggi dibandingkan dengan perusahaan sejenisnya, dan 50 adalah rata-ratanya.
Frekuensi Pembaruan: Setiap Hari
Lihat Ownership Explorer, yang menyediakan daftar perusahaan dengan peringkat tertinggi.
Rasio Put/Call Institusional
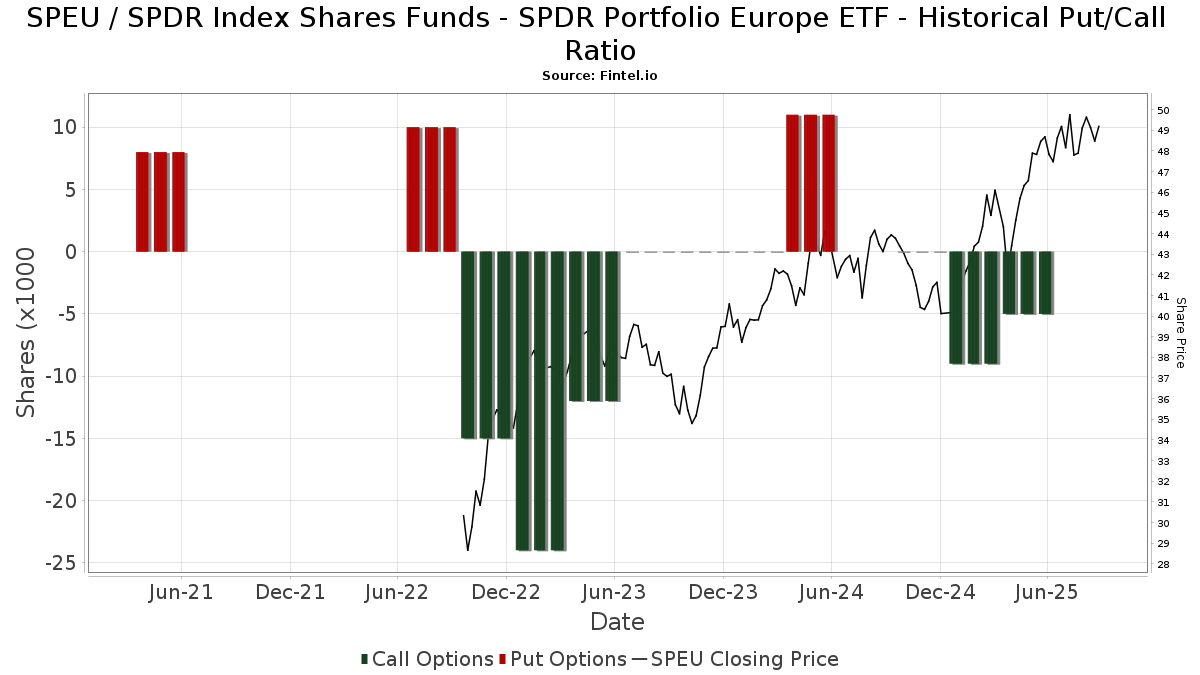
Selain melaporkan isu ekuitas dan utang standar, institusi dengan aset di bawah manajemen lebih dari 100 juta dolar AS juga harus mengungkapkan kepemilikan opsi put dan call mereka. Karena opsi put umumnya menunjukkan sentimen negatif, dan opsi call menunjukkan sentimen positif, kita dapat mengetahui sentimen institusional secara keseluruhan dengan memplot rasio put terhadap call. Grafik di sebelah kanan memplot rasio put/call historis untuk instrumen ini.
Menggunakan Rasio Put/Call sebagai indikator sentimen investor mengatasi salah satu kekurangan utama dari penggunaan total kepemilikan institusional, yaitu sejumlah besar aset yang dikelola diinvestasikan secara pasif untuk melacak indeks. Dana yang dikelola secara pasif biasanya tidak membeli opsi, sehingga indikator rasio put/call lebih akurat dalam melacak sentimen dana yang dikelola secara aktif.
Pengajuan 13F dan NPORT
Detail pada pengajuan 13F tersedia gratis. Detail pada pengajuan NP memerlukan keanggotaan premium. Baris berwarna hijau menunjukkan posisi baru. Baris berwarna merah menunjukkan posisi yang sudah ditutup. Klik tautan ini ikon untuk melihat riwayat transaksi selengkapnya.
Tingkatkan
untuk membuka data premium dan mengekspor ke Excel ![]() .
.
| Tanggal File | Sumber | Investor | Ketik | Presyo ng Avg (Silangan) |
Saham | Δ Saham (%) |
Dilaporkan Nilai ($1000) |
Nilai Δ (%) |
Alokasi Port (%) |
|
|---|---|---|---|---|---|---|---|---|---|---|
| 2025-08-11 | 13F | Perennial Investment Advisors, LLC | 7,508 | 24.08 | 364 | 36.47 | ||||
| 2025-08-12 | 13F | Jacobi Capital Management LLC | 239,484 | 11,605 | ||||||
| 2025-08-08 | 13F | Avantax Advisory Services, Inc. | 4,954 | 240 | ||||||
| 2025-07-24 | 13F | IFP Advisors, Inc | 300 | 0.00 | 15 | 7.69 | ||||
| 2025-08-11 | 13F | Outlook Wealth Advisors, LLC | 0 | -100.00 | 0 | |||||
| 2025-07-25 | 13F | Richardson Financial Services Inc. | 0 | -100.00 | 0 | |||||
| 2025-08-14 | 13F | Novus Advisors, Llc | 0 | -100.00 | 0 | |||||
| 2025-08-18 | 13F | N.E.W. Advisory Services LLC | 190 | 1.60 | 9 | 12.50 | ||||
| 2025-07-25 | 13F | Envestnet Portfolio Solutions, Inc. | 0 | -100.00 | 0 | |||||
| 2025-05-12 | 13F | Independent Advisor Alliance | 0 | -100.00 | 0 | |||||
| 2025-07-25 | 13F | Johnson Investment Counsel Inc | 36,334 | 320.58 | 1,761 | 363.16 | ||||
| 2025-07-21 | 13F | Crews Bank & Trust | 500 | 0.00 | 24 | 9.09 | ||||
| 2025-08-14 | 13F | Williams Jones Wealth Management, LLC. | 46,800 | 2,268 | ||||||
| 2025-07-28 | 13F | Harbour Investments, Inc. | 631 | -97.85 | 31 | -97.68 | ||||
| 2025-08-14 | 13F | Treasure Coast Financial Planning | 118,562 | 7.77 | 5,746 | 18.67 | ||||
| 2025-08-14 | 13F | Sargent Investment Group, LLC | 9,835 | 73.00 | 471 | 88.00 | ||||
| 2025-05-15 | 13F | Citadel Advisors Llc | Put | 0 | -100.00 | 0 | -100.00 | |||
| 2025-08-12 | 13F | SRS Capital Advisors, Inc. | 38 | 0.00 | 2 | 0.00 | ||||
| 2025-07-10 | 13F | Sharkey, Howes & Javer | 38,127 | 1,848 | ||||||
| 2025-08-12 | 13F | Main Management LLC | 2,024 | 0.00 | 0 | |||||
| 2025-08-12 | 13F | Global Retirement Partners, LLC | 676 | -22.30 | 33 | -5.88 | ||||
| 2025-08-11 | 13F | Strategic Wealth Partners, Ltd. | 69 | 3 | ||||||
| 2025-08-05 | 13F | Key FInancial Inc | 0 | -100.00 | 0 | |||||
| 2025-05-01 | 13F | Quest 10 Wealth Builders, Inc. | 5 | 0 | ||||||
| 2025-07-16 | 13F | Castleview Partners, Llc | 6,931 | -5.83 | 336 | 3.72 | ||||
| 2025-08-13 | 13F | Flow Traders U.s. Llc | 49,300 | -83.51 | 2 | -84.62 | ||||
| 2025-08-11 | 13F | Hexagon Capital Partners LLC | 0 | -100.00 | 0 | |||||
| 2025-08-14 | 13F | Raymond James Financial Inc | 37,358 | 0.77 | 1,810 | 10.97 | ||||
| 2025-05-28 | NP | GAL - SPDR SSGA Global Allocation ETF This fund is a listed as child fund of State Street Corp and if that institution has disclosed ownership in this security, then these positions will not be double counted when calculating total shares and total value | 216,497 | -43.71 | 9,528 | -35.67 | ||||
| 2025-07-22 | 13F | Aspire Private Capital, LLC | 0 | -100.00 | 0 | |||||
| 2025-07-29 | 13F | Tradewinds Capital Management, LLC | 1,459 | 1.81 | 71 | 11.11 | ||||
| 2025-08-12 | 13F | Steward Partners Investment Advisory, Llc | 150 | 0.00 | 7 | 16.67 | ||||
| 2025-08-05 | 13F | GPS Wealth Strategies Group, LLC | 917 | 45.79 | 44 | 62.96 | ||||
| 2025-08-14 | 13F | Arete Wealth Advisors, LLC | 5,866 | 0.00 | 0 | |||||
| 2025-08-13 | 13F | Keystone Financial Group | 6,400 | -3.03 | 310 | 6.90 | ||||
| 2025-08-14 | 13F | Mml Investors Services, Llc | 8,093 | -4.33 | 0 | |||||
| 2025-08-14 | 13F | Fmr Llc | 3,382 | 4.13 | 164 | 14.79 | ||||
| 2025-07-30 | 13F | Bogart Wealth, LLC | 15 | 0.00 | 1 | |||||
| 2025-08-13 | 13F | Continuum Advisory, LLC | 0 | -100.00 | 0 | -100.00 | ||||
| 2025-07-31 | 13F | Ssa Swiss Advisors Ag | 1,500 | 0.00 | 75 | 12.12 | ||||
| 2025-08-01 | 13F | Austin Private Wealth, LLC | 0 | -100.00 | 0 | |||||
| 2025-06-27 | NP | INTL - Main International ETF | 355,515 | 16,247 | ||||||
| 2025-08-14 | 13F | Smartleaf Asset Management LLC | 42 | -82.64 | 2 | -80.00 | ||||
| 2025-04-23 | 13F | Crewe Advisors LLC | 0 | -100.00 | 0 | |||||
| 2025-08-27 | 13F | Barnes Wealth Management Group, Inc | 5,970 | 289 | ||||||
| 2025-08-06 | 13F | SOUTH STATE Corp | 20 | 1 | ||||||
| 2025-07-17 | 13F | Worth Financial Advisory Group, LLC | 4,641 | 225 | ||||||
| 2025-07-31 | 13F | Cambridge Investment Research Advisors, Inc. | 0 | -100.00 | 0 | |||||
| 2025-07-14 | 13F | Iams Wealth Management, Llc | 0 | -100.00 | 0 | |||||
| 2025-07-14 | 13F | U.S. Capital Wealth Advisors, LLC | 4,861 | 1.84 | 236 | 11.90 | ||||
| 2025-08-14 | 13F | Jane Street Group, Llc | 831,260 | 389.50 | 40,283 | 439.03 | ||||
| 2025-08-12 | 13F | Eldridge Investment Advisors, Inc. | 33,888 | 20.26 | 1,642 | 32.42 | ||||
| 2025-08-14 | 13F | Royal Bank Of Canada | 38,862 | 629.80 | 1,883 | 704.70 | ||||
| 2025-08-04 | 13F | Assetmark, Inc | 5,358 | -98.46 | 260 | -98.30 | ||||
| 2025-07-21 | 13F | Pacific Financial Group Inc | 14,972 | -1.87 | 726 | 8.05 | ||||
| 2025-05-15 | 13F | IHT Wealth Management, LLC | 0 | -100.00 | 0 | |||||
| 2025-08-14 | 13F | Citadel Advisors Llc | 12,889 | 625 | ||||||
| 2025-08-14 | 13F | Susquehanna International Group, Llp | Call | 5,400 | -43.16 | 262 | -37.56 | |||
| 2025-08-12 | 13F | Jpmorgan Chase & Co | 231 | 131.00 | 11 | 175.00 | ||||
| 2025-08-14 | 13F | Susquehanna International Group, Llp | 102,006 | 537.50 | 4,943 | 602.13 | ||||
| 2025-08-14 | 13F | Qube Research & Technologies Ltd | 2,103 | -11.71 | 102 | -2.88 | ||||
| 2025-07-30 | 13F | Atlantic Edge Private Wealth Management, LLC | 203,124 | 0.99 | 9,843 | 11.21 | ||||
| 2025-04-29 | 13F | Lee Danner & Bass Inc | 0 | -100.00 | 0 | |||||
| 2025-08-14 | 13F | Wells Fargo & Company/mn | 146,681 | 15.07 | 7,108 | 26.72 | ||||
| 2025-08-15 | 13F | WealthCollab, LLC | 839 | 1.70 | 41 | 11.11 | ||||
| 2025-07-08 | 13F | Parallel Advisors, LLC | 0 | -100.00 | 0 | |||||
| 2025-07-14 | 13F | AdvisorNet Financial, Inc | 9 | 0.00 | 0 | |||||
| 2025-08-07 | 13F | Allworth Financial LP | 33 | 0.00 | 2 | 0.00 | ||||
| 2025-08-11 | 13F | Principal Securities, Inc. | 74 | 0.00 | 4 | 50.00 | ||||
| 2025-08-18 | 13F | Hollencrest Capital Management | 15 | 0.00 | 1 | |||||
| 2025-08-14 | 13F | CoreCap Advisors, LLC | 15 | 1 | ||||||
| 2025-08-14 | 13F | Paces Ferry Wealth Advisors, Llc | 16,518 | -3.53 | 800 | 6.24 | ||||
| 2025-07-10 | 13F | Global Financial Private Client, LLC | 0 | -100.00 | 0 | |||||
| 2025-07-30 | 13F | Whittier Trust Co | 334 | 0.00 | 16 | 14.29 | ||||
| 2025-07-21 | 13F | Ascent Group, LLC | 0 | -100.00 | 0 | |||||
| 2025-04-28 | 13F | American Capital Advisory, LLC | 0 | -100.00 | 0 | |||||
| 2025-08-12 | 13F | Change Path, LLC | 4,509 | -82.69 | 219 | -80.98 | ||||
| 2025-08-14 | 13F | Bank Of America Corp /de/ | 295,524 | -4.43 | 14,321 | 5.24 | ||||
| 2025-08-12 | 13F | Integrated Advisors Network LLC | 5,235 | -0.70 | 254 | 9.05 | ||||
| 2025-08-08 | 13F | Larson Financial Group LLC | 1,063 | 0.00 | 52 | 10.87 | ||||
| 2025-08-18 | 13F/A | National Bank Of Canada /fi/ | 1,100 | 0.00 | 53 | 12.77 | ||||
| 2025-08-14 | 13F | Ameriprise Financial Inc | 4,758 | 231 | ||||||
| 2025-08-05 | 13F | NewSquare Capital LLC | 2 | 0.00 | 0 | |||||
| 2025-05-02 | 13F | Capital A Wealth Management, LLC | 8 | 0 | ||||||
| 2025-07-11 | 13F | International Private Wealth Advisors LLC | 0 | -100.00 | 0 | |||||
| 2025-08-11 | 13F | Private Advisor Group, LLC | 58,098 | 713.24 | 2,815 | 796.50 | ||||
| 2025-08-14 | 13F | State Street Corp | 0 | -100.00 | 0 | |||||
| 2025-09-04 | 13F/A | Advisor Group Holdings, Inc. | 400,941 | 16.27 | 19,181 | 26.40 | ||||
| 2025-07-16 | 13F | Diversified Enterprises, LLC | 4,811 | -12.53 | 233 | -3.72 | ||||
| 2025-08-11 | 13F | HighTower Advisors, LLC | 0 | -100.00 | 0 | |||||
| 2025-07-29 | 13F | Balboa Wealth Partners | 0 | -100.00 | 0 | |||||
| 2025-08-07 | 13F | Zions Bancorporation, National Association /ut/ | 39 | 0.00 | 2 | 0.00 | ||||
| 2025-08-06 | 13F | AE Wealth Management LLC | 101 | -99.44 | 5 | -99.50 | ||||
| 2025-08-15 | 13F | Equitable Holdings, Inc. | 101,425 | 4,915 | ||||||
| 2025-08-11 | 13F | Covestor Ltd | 0 | -100.00 | 0 | |||||
| 2025-07-03 | 13F | Garde Capital, Inc. | 993 | 28.79 | 48 | 45.45 | ||||
| 2025-07-22 | 13F | Cedar Mountain Advisors, LLC | 181 | 0.00 | 9 | 14.29 | ||||
| 2025-08-08 | 13F | TD Capital Management LLC | 1,022 | 0.00 | 50 | 11.36 | ||||
| 2025-08-12 | 13F | Allen Capital Group, LLC | 22,474 | -0.77 | 1,089 | 9.34 | ||||
| 2025-08-14 | 13F | Goldman Sachs Group Inc | 22,759 | 1,103 | ||||||
| 2025-08-12 | 13F | Main Management ETF Advisors, LLC | 353,460 | -0.58 | 17 | 13.33 | ||||
| 2025-08-14 | 13F | Betterment LLC | 0 | -100.00 | 0 | |||||
| 2025-08-08 | 13F | Cetera Investment Advisers | 52,452 | -1.72 | 2,542 | 8.22 | ||||
| 2025-08-05 | 13F | Simplex Trading, Llc | 166 | 245.83 | 0 | |||||
| 2025-08-12 | 13F | LPL Financial LLC | 346,640 | -58.74 | 16,798 | -54.56 | ||||
| 2025-08-14 | 13F | Family Management Corp | 16,188 | 0.00 | 784 | 10.11 | ||||
| 2025-08-14 | 13F | UBS Group AG | 49,373 | -35.82 | 2,393 | -29.34 | ||||
| 2025-07-11 | 13F | Farther Finance Advisors, LLC | 340 | -48.25 | 16 | -44.83 | ||||
| 2025-08-13 | 13F | Scotia Capital Inc. | 79,598 | -16.01 | 3,857 | -7.51 | ||||
| 2025-08-14 | 13F | Federation des caisses Desjardins du Quebec | 568 | 0.00 | 28 | 12.50 | ||||
| 2025-08-14 | 13F | MGB Wealth Management, LLC | 3,872 | 80.85 | 188 | 98.94 | ||||
| 2025-07-29 | 13F | Kraft, Davis & Associates, LLC | 0 | -100.00 | 0 | |||||
| 2025-08-19 | 13F | Cape Investment Advisory, Inc. | 297 | 1.71 | 14 | 16.67 | ||||
| 2025-07-25 | 13F | Lodestar Private Asset Management Llc | 13,586 | 114.70 | 658 | 136.69 | ||||
| 2025-08-13 | 13F | Transce3nd, LLC | 151 | -54.52 | 7 | -50.00 | ||||
| 2025-07-11 | 13F | Grove Bank & Trust | 3,000 | 0.00 | 145 | 9.85 | ||||
| 2025-07-14 | 13F | Park Avenue Securities Llc | 0 | -100.00 | 0 | |||||
| 2025-08-05 | 13F | Landmark Wealth Management, Inc. | 0 | -100.00 | 0 | |||||
| 2025-07-10 | 13F | Worth Asset Management, LLC | 20,536 | 995 | ||||||
| 2025-07-18 | 13F | Lockerman Financial Group, Inc. | 0 | -100.00 | 0 | |||||
| 2025-08-15 | 13F | Morgan Stanley | 896,565 | -4.40 | 43,448 | 5.26 | ||||
| 2025-08-12 | 13F | Richard W. Paul & Associates, LLC | 128 | -94.97 | 6 | -94.64 | ||||
| 2025-08-13 | 13F | Jones Financial Companies Lllp | 4,139 | -21.85 | 200 | -15.25 | ||||
| 2025-07-15 | 13F | Armis Advisers, LLC | 70,717 | 1.26 | 3,435 | 7.62 | ||||
| 2025-08-04 | 13F | Spire Wealth Management | 419 | 20 | ||||||
| 2025-07-28 | 13F | Axxcess Wealth Management, Llc | 0 | -100.00 | 0 | |||||
| 2025-07-15 | 13F | Mather Group, Llc. | 192,661 | -98.10 | 9,336 | -97.91 | ||||
| 2025-08-04 | 13F | Creative Financial Designs Inc /adv | 110 | 0.92 | 5 | 25.00 | ||||
| 2025-08-06 | 13F | Commonwealth Equity Services, Llc | 4,903 | 1.55 | 0 | |||||
| 2025-07-28 | 13F | Frazier Financial Advisors, LLC | 175 | 1.74 | 8 | 14.29 | ||||
| 2025-08-12 | 13F | Virtu Financial LLC | 32,732 | 2 | ||||||
| 2025-08-14 | 13F | Comerica Bank | 7,177 | -2.07 | 348 | 7.76 | ||||
| 2025-08-13 | 13F | GeoWealth Management, LLC | 0 | -100.00 | 0 | |||||
| 2025-08-12 | 13F | Proequities, Inc. | 0 | 0 | ||||||
| 2025-08-15 | 13F | Captrust Financial Advisors | 7,076 | 343 | ||||||
| 2025-08-01 | 13F | Envestnet Asset Management Inc | 36,739 | -90.94 | 1,780 | -90.03 | ||||
| 2025-08-06 | 13F | Csenge Advisory Group | 8,434 | -5.17 | 405 | 4.11 | ||||
| 2025-07-17 | 13F | Raleigh Capital Management Inc. | 0 | -100.00 | 0 | -100.00 | ||||
| 2025-08-14 | 13F | Mariner, LLC | 5,441 | 264 | ||||||
| 2025-07-29 | 13F | Private Trust Co Na | 5,005 | 925.61 | 243 | 1,052.38 | ||||
| 2025-07-25 | 13F | Cwm, Llc | 2,047,116 | 150.68 | 99 | 182.86 | ||||
| 2025-08-08 | 13F | Good Life Advisors, LLC | 6,585 | 319 | ||||||
| 2025-07-24 | 13F | Blair William & Co/il | 167 | 94.19 | 8 | 166.67 | ||||
| 2025-08-15 | 13F | Kestra Advisory Services, LLC | 10,395 | -41.49 | 504 | -11.29 | ||||
| 2025-08-12 | 13F | Charles Schwab Investment Management Inc | 228,076 | 11,053 | ||||||
| 2025-08-14 | 13F | Hrt Financial Lp | 0 | -100.00 | 0 | |||||
| 2025-07-22 | 13F | Merit Financial Group, LLC | 6,413 | 311 | ||||||
| 2025-07-17 | 13F | K2 Financial Inc. | 15,022 | 7.28 | 722 | 18.36 | ||||
| 2025-08-14 | 13F | GWM Advisors LLC | 7,518 | -89.38 | 364 | -88.31 |
Other Listings
| MX:SPEU |