Mga Batayang Estadistika
| Pemilik Institusional | 113 total, 113 long only, 0 short only, 0 long/short - change of 6.60% MRQ |
| Alokasi Portofolio Rata-rata | 0.2311 % - change of 1.09% MRQ |
| Saham Institusional (Jangka Panjang) | 12,858,226 (ex 13D/G) - change of 1.12MM shares 9.53% MRQ |
| Nilai Institusional (Jangka Panjang) | $ 449,684 USD ($1000) |
Kepemilikan Institusional dan Pemegang Saham
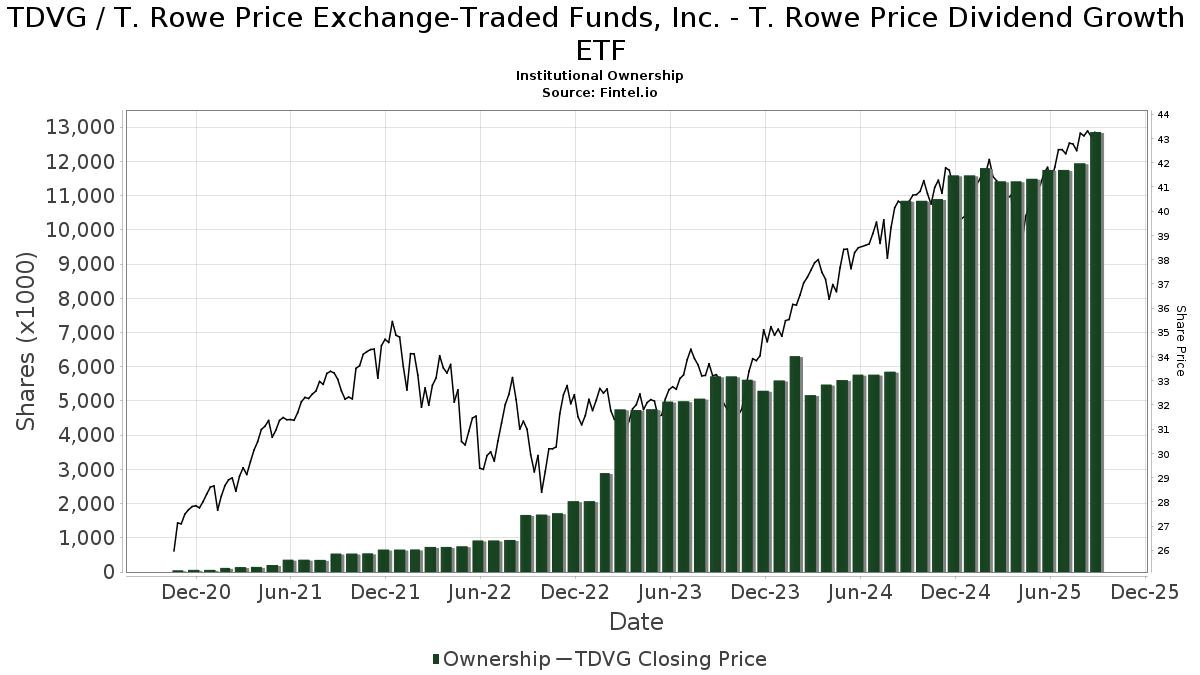
T. Rowe Price Exchange-Traded Funds, Inc. - T. Rowe Price Dividend Growth ETF (US:TDVG) memiliki 113 pemilik institusional dan pemegang saham yang telah mengajukan formulir 13D/G atau 13F kepada Komisi Bursa Efek (Securities Exchange Commission/SEC). Lembaga-lembaga ini memegang total 12,858,226 saham. Pemegang saham terbesar meliputi National Pension Service, Bank Of America Corp /de/, PRSGX - Spectrum Growth Fund, Price T Rowe Associates Inc /md/, Northwestern Mutual Wealth Management Co, Commonwealth Equity Services, Llc, Rockefeller Capital Management L.P., Sequoia Financial Advisors, LLC, Fmr Llc, and Yarger Wealth Strategies, Llc .
Struktur kepemilikan institusional T. Rowe Price Exchange-Traded Funds, Inc. - T. Rowe Price Dividend Growth ETF (ARCA:TDVG) menunjukkan posisi terkini di perusahaan oleh institusi dan dana, serta perubahan terbaru dalam ukuran posisi. Pemegang saham utama dapat mencakup investor individu, reksa dana, dana lindung nilai, atau institusi. Jadwal 13D menunjukkan bahwa investor memegang (atau pernah memegang) lebih dari 5% saham perusahaan dan bermaksud (atau pernah bermaksud) untuk secara aktif mengejar perubahan strategi bisnis. Jadwal 13G menunjukkan investasi pasif lebih dari 5%.
The share price as of September 3, 2025 is 43.08 / share. Previously, on September 4, 2024, the share price was 40.31 / share. This represents an increase of 6.87% over that period.
Skor Sentimen Dana
Skor Sentimen Dana (sebelumnya dikenal sebagai Skor Akumulasi Kepemilikan) menemukan saham-saham yang paling banyak dibeli oleh dana. Ini adalah hasil dari model kuantitatif multi-faktor yang canggih yang mengidentifikasi perusahaan dengan tingkat akumulasi institusional tertinggi. Model penilaian menggunakan kombinasi dari total peningkatan pemilik yang diungkapkan, perubahan dalam alokasi portofolio pada pemilik tersebut, dan metrik lainnya. Angka berkisar dari 0 hingga 100, dengan angka yang lebih tinggi menunjukkan tingkat akumulasi yang lebih tinggi dibandingkan dengan perusahaan sejenisnya, dan 50 adalah rata-ratanya.
Frekuensi Pembaruan: Setiap Hari
Lihat Ownership Explorer, yang menyediakan daftar perusahaan dengan peringkat tertinggi.
Rasio Put/Call Institusional
Selain melaporkan isu ekuitas dan utang standar, institusi dengan aset di bawah manajemen lebih dari 100 juta dolar AS juga harus mengungkapkan kepemilikan opsi put dan call mereka. Karena opsi put umumnya menunjukkan sentimen negatif, dan opsi call menunjukkan sentimen positif, kita dapat mengetahui sentimen institusional secara keseluruhan dengan memplot rasio put terhadap call. Grafik di sebelah kanan memplot rasio put/call historis untuk instrumen ini.
Menggunakan Rasio Put/Call sebagai indikator sentimen investor mengatasi salah satu kekurangan utama dari penggunaan total kepemilikan institusional, yaitu sejumlah besar aset yang dikelola diinvestasikan secara pasif untuk melacak indeks. Dana yang dikelola secara pasif biasanya tidak membeli opsi, sehingga indikator rasio put/call lebih akurat dalam melacak sentimen dana yang dikelola secara aktif.
Pengajuan 13F dan NPORT
Detail pada pengajuan 13F tersedia gratis. Detail pada pengajuan NP memerlukan keanggotaan premium. Baris berwarna hijau menunjukkan posisi baru. Baris berwarna merah menunjukkan posisi yang sudah ditutup. Klik tautan ini ikon untuk melihat riwayat transaksi selengkapnya.
Tingkatkan
untuk membuka data premium dan mengekspor ke Excel ![]() .
.
| Tanggal File | Sumber | Investor | Ketik | Presyo ng Avg (Silangan) |
Saham | Δ Saham (%) |
Dilaporkan Nilai ($1000) |
Nilai Δ (%) |
Alokasi Port (%) |
|
|---|---|---|---|---|---|---|---|---|---|---|
| 2025-07-25 | 13F | Bill Few Associates, Inc. | 24,547 | 125.57 | 1,040 | 136.90 | ||||
| 2025-07-17 | 13F | Janney Montgomery Scott LLC | 20,059 | 18.59 | 1 | |||||
| 2025-08-08 | 13F | Thoroughbred Financial Services, Llc | 31,103 | -5.45 | 1 | 0.00 | ||||
| 2025-07-29 | 13F | Stratos Wealth Advisors, LLC | 11,890 | -77.22 | 504 | -76.14 | ||||
| 2025-08-14 | 13F | Fmr Llc | 319,626 | 57.50 | 13,546 | 65.22 | ||||
| 2025-08-08 | 13F | Cetera Investment Advisers | 154,336 | 14.30 | 6,541 | 19.89 | ||||
| 2025-07-24 | 13F | Financial Connections Group, Inc. | 42,616 | -10.12 | 2 | 0.00 | ||||
| 2025-08-14 | 13F | Raymond James Financial Inc | 4,670 | -8.91 | 198 | -4.83 | ||||
| 2025-08-14 | 13F | GWM Advisors LLC | 1,451 | 0.00 | 61 | 5.17 | ||||
| 2025-07-22 | 13F | MBL Wealth, LLC | 144,787 | 6,136 | ||||||
| 2025-08-12 | 13F | Argent Trust Co | 6,709 | 0.00 | 284 | 4.80 | ||||
| 2025-07-28 | 13F | Evernest Financial Advisors, LLC | 8,659 | -0.13 | 367 | 4.57 | ||||
| 2025-08-12 | 13F | MAI Capital Management | 145 | 6 | ||||||
| 2025-07-16 | 13F | John W. Brooker & Co., CPAs | 0 | -100.00 | 0 | |||||
| 2025-07-18 | 13F | Bartlett & Co. Wealth Management Llc | 890 | 0.00 | 38 | 5.71 | ||||
| 2025-08-14 | 13F | UBS Group AG | 169 | -54.20 | 7 | -50.00 | ||||
| 2025-07-30 | 13F | Schaper Benz & Wise Investment Counsel Inc/wi | 14,610 | 8.83 | 619 | 14.21 | ||||
| 2025-08-07 | 13F | Kestra Private Wealth Services, Llc | 93,815 | -12.90 | 3,976 | -8.64 | ||||
| 2025-08-08 | 13F | Capital Investment Advisory Services, LLC | 21,002 | 142.71 | 890 | 155.01 | ||||
| 2025-08-06 | 13F | Csenge Advisory Group | 11,226 | 0.00 | 464 | 7.93 | ||||
| 2025-08-26 | NP | PRSGX - Spectrum Growth Fund This fund is a listed as child fund of Price T Rowe Associates Inc /md/ and if that institution has disclosed ownership in this security, then these positions will not be double counted when calculating total shares and total value | 1,525,001 | 0.00 | 64,630 | 4.90 | ||||
| 2025-07-29 | 13F | Fundamentun, Llc | 111,410 | 54.41 | 4,722 | 62.01 | ||||
| 2025-08-13 | 13F | Colonial Trust Co / SC | 300 | 0.00 | 13 | 0.00 | ||||
| 2025-08-01 | 13F | Equita Financial Network, Inc. | 15,643 | 1.19 | 663 | 6.09 | ||||
| 2025-08-15 | 13F | Morgan Stanley | 4,403 | 358.17 | 187 | 389.47 | ||||
| 2025-08-13 | 13F | Continuum Advisory, LLC | 51,670 | 45.19 | 2,190 | 52.33 | ||||
| 2025-08-14 | 13F | Garden State Investment Advisory Services LLC | 16,756 | 4.73 | 711 | 9.91 | ||||
| 2025-07-11 | 13F | Adirondack Trust Co | 5,783 | -5.07 | 245 | -0.41 | ||||
| 2025-08-05 | 13F | Sigma Planning Corp | 13,576 | 13.71 | 575 | 19.29 | ||||
| 2025-08-14 | 13F | Stifel Financial Corp | 30,951 | -41.74 | 1,312 | -38.91 | ||||
| 2025-07-24 | 13F | Blair William & Co/il | 9,194 | 1.76 | 390 | 6.58 | ||||
| 2025-07-24 | 13F | Capital Advisors, Ltd. LLC | 26,647 | 0.99 | 1 | 0.00 | ||||
| 2025-07-10 | 13F | Wealth Enhancement Advisory Services, Llc | 72,276 | 30.99 | 3,094 | 38.81 | ||||
| 2025-08-11 | 13F | Western Wealth Management, LLC | 5,289 | 0.00 | 224 | 5.16 | ||||
| 2025-07-16 | 13F | Swisher Financial Concepts, Inc. | 6,506 | -9.07 | 276 | -4.84 | ||||
| 2025-07-29 | 13F | Mb, Levis & Associates, Llc | 10,925 | 25.36 | 463 | 31.53 | ||||
| 2025-08-18 | 13F | N.E.W. Advisory Services LLC | 2,454 | 104 | ||||||
| 2025-07-11 | 13F | Farther Finance Advisors, LLC | 950 | 0.21 | 40 | 5.26 | ||||
| 2025-07-25 | 13F | Atria Wealth Solutions, Inc. | 0 | -100.00 | 0 | -100.00 | ||||
| 2025-08-12 | 13F | Jpmorgan Chase & Co | 12,010 | -12.32 | 509 | -8.14 | ||||
| 2025-05-13 | 13F | Nations Financial Group Inc, /ia/ /adv | 0 | -100.00 | 0 | |||||
| 2025-07-14 | 13F | Lighthouse Wealth Management Inc. | 20,974 | 264.13 | 889 | 282.76 | ||||
| 2025-08-08 | 13F | Comprehensive Financial Planning, Inc./PA | 3,058 | -7.16 | 130 | -3.01 | ||||
| 2025-08-12 | 13F | LPL Financial LLC | 182,338 | 27.24 | 7,727 | 33.48 | ||||
| 2025-08-14 | 13F | Royal Bank Of Canada | 4,003 | 20.46 | 169 | 26.12 | ||||
| 2025-07-30 | 13F | Cornerstone Advisory, LLC | 10,444 | 0.05 | 443 | 6.25 | ||||
| 2025-07-25 | 13F | Sequoia Financial Advisors, LLC | 332,120 | -5.17 | 14,075 | -0.52 | ||||
| 2025-07-28 | 13F | Harbour Investments, Inc. | 13,938 | 28.45 | 591 | 34.70 | ||||
| 2025-07-24 | 13F | NavPoint Financial, Inc. | 21,565 | 1.54 | 914 | 6.41 | ||||
| 2025-07-30 | 13F | Studio Investment Management Llc | 25,851 | -0.20 | 1,096 | 4.68 | ||||
| 2025-08-13 | 13F | Capital Analysts, Inc. | 9,649 | -8.39 | 0 | |||||
| 2025-08-14 | 13F | Mariner, LLC | 107,586 | 5.35 | 4,559 | 10.52 | ||||
| 2025-08-06 | 13F | Adviser Investments LLC | 49,297 | -13.36 | 2,089 | -9.09 | ||||
| 2025-08-14 | 13F | Wells Fargo & Company/mn | 1 | -99.99 | 0 | -100.00 | ||||
| 2025-07-09 | 13F | Sandy Cove Advisors, LLC | 5,195 | 220 | ||||||
| 2025-07-28 | 13F | Axxcess Wealth Management, Llc | 79,675 | 35.27 | 3,377 | 41.91 | ||||
| 2025-04-28 | 13F | Strategic Financial Concepts, LLC | 0 | -100.00 | 0 | -100.00 | ||||
| 2025-08-14 | 13F | Comerica Bank | 157 | 0.00 | 7 | 0.00 | ||||
| 2025-08-14 | 13F | Goldman Sachs Group Inc | 16,906 | 28.55 | 716 | 34.84 | ||||
| 2025-07-24 | 13F | IFP Advisors, Inc | 6,290 | 0.00 | 267 | 4.72 | ||||
| 2025-08-08 | 13F | National Pension Service | 2,762,617 | 0.00 | 117,080 | 4.90 | ||||
| 2025-07-16 | 13F | Strategic Investment Solutions, Inc. /IL | 1,660 | 0.00 | 70 | 4.48 | ||||
| 2025-07-30 | 13F | Strategic Blueprint, LLC | 14,531 | -5.42 | 616 | -0.81 | ||||
| 2025-08-06 | 13F | AE Wealth Management LLC | 0 | -100.00 | 0 | |||||
| 2025-04-21 | 13F | Envestnet Portfolio Solutions, Inc. | 0 | -100.00 | 0 | |||||
| 2025-08-15 | 13F | Kestra Advisory Services, LLC | 5,077 | -4.46 | 215 | 0.47 | ||||
| 2025-08-14 | 13F | Marquette Associates, Inc. | 14,526 | 0.00 | 616 | 4.95 | ||||
| 2025-08-19 | 13F | Advisory Services Network, LLC | 19,483 | -10.97 | 827 | -6.45 | ||||
| 2025-08-14 | 13F | Jane Street Group, Llc | 16,193 | 686 | ||||||
| 2025-08-01 | 13F | Rossby Financial, LCC | 640 | 0.00 | 27 | 8.00 | ||||
| 2025-08-11 | 13F | Principal Securities, Inc. | 3,116 | -55.27 | 132 | -52.00 | ||||
| 2025-08-11 | 13F | United Advisor Group, LLC | 185,118 | -4.99 | 7,845 | -0.33 | ||||
| 2025-08-12 | 13F/A | Cozad Asset Management Inc | 23,847 | 0.00 | 1,011 | 4.88 | ||||
| 2025-08-12 | 13F | Frontier Asset Management, LLC | 209,150 | -1.09 | 8,864 | 3.76 | ||||
| 2025-08-13 | 13F | Northwestern Mutual Wealth Management Co | 1,363,925 | 18.93 | 57,803 | 24.76 | ||||
| 2025-07-09 | 13F | VisionPoint Advisory Group, LLC | 8,113 | 344 | ||||||
| 2025-07-22 | 13F | DAVENPORT & Co LLC | 5,250 | 222 | ||||||
| 2025-08-01 | 13F | Centerpoint Advisors, LLC | 1,100 | 0.00 | 0 | |||||
| 2025-08-14 | 13F | Two Sigma Investments, Lp | 39,400 | 1,670 | ||||||
| 2025-08-14 | 13F | Benjamin Edwards Inc | 0 | -100.00 | 0 | |||||
| 2025-08-05 | 13F | BEAM Asset Management, LLC | 0 | -100.00 | 0 | |||||
| 2025-09-04 | 13F/A | Advisor Group Holdings, Inc. | 6,219 | -22.38 | 264 | -18.83 | ||||
| 2025-08-12 | 13F | SRS Capital Advisors, Inc. | 2,490 | 455.80 | 106 | 483.33 | ||||
| 2025-07-21 | 13F | Ameritas Advisory Services, LLC | 791 | 34 | ||||||
| 2025-07-21 | 13F | Future Financial Wealth Managment LLC | 6,836 | 0.00 | 290 | 4.71 | ||||
| 2025-08-01 | 13F | Envestnet Asset Management Inc | 264,123 | 0.93 | 11,194 | 5.87 | ||||
| 2025-07-14 | 13F | AdvisorNet Financial, Inc | 1,376 | -51.38 | 58 | -49.12 | ||||
| 2025-08-04 | 13F | Grant Street Asset Management, Inc. | 99,969 | -0.15 | 4,237 | 4.75 | ||||
| 2025-08-14 | 13F | Bank Of America Corp /de/ | 1,612,279 | 20.28 | 68,328 | 26.17 | ||||
| 2025-08-14 | 13F | Mml Investors Services, Llc | 6,673 | 0.21 | 0 | |||||
| 2025-08-06 | 13F | Commonwealth Equity Services, Llc | 503,948 | 1.94 | 21 | 10.53 | ||||
| 2025-07-16 | 13F | Essex Financial Services, Inc. | 5,128 | 0.49 | 217 | 5.34 | ||||
| 2025-08-14 | 13F | Susquehanna International Group, Llp | 7,710 | 327 | ||||||
| 2025-07-18 | 13F | TPG Advisors LLC | 92,611 | 0.27 | 3,925 | 5.17 | ||||
| 2025-08-14 | 13F/A | Rockefeller Capital Management L.P. | 354,726 | 4.43 | 15,033 | 9.55 | ||||
| 2025-07-16 | 13F | Perigon Wealth Management, LLC | 19,064 | -0.85 | 808 | 3.99 | ||||
| 2025-08-14 | 13F | Glen Eagle Advisors, LLC | 225 | 0.00 | 10 | 0.00 | ||||
| 2025-07-16 | 13F | Beaumont Financial Advisors, LLC | 43,934 | 0.00 | 1,862 | 4.90 | ||||
| 2025-07-22 | 13F | Wealthcare Capital Partners, LLC | 9,202 | 44.05 | 390 | 50.78 | ||||
| 2025-07-25 | 13F | Cwm, Llc | 9,386 | 224.21 | 0 | |||||
| 2025-08-14 | 13F | Wiley Bros.-aintree Capital, Llc | 23,433 | 7.81 | 993 | 14.40 | ||||
| 2025-08-04 | 13F | Assetmark, Inc | 984 | 0.00 | 42 | 5.13 | ||||
| 2025-08-14 | 13F | Colony Group, LLC | 205,583 | 22.27 | 8,713 | 28.27 | ||||
| 2025-08-07 | 13F | Allworth Financial LP | 265,635 | 1.74 | 11,258 | 9.94 | ||||
| 2025-08-04 | 13F | WNY Asset Management, LLC | 6,535 | -12.92 | 277 | -8.91 | ||||
| 2025-08-11 | 13F | Aptus Capital Advisors, LLC | 16,111 | 0.99 | 683 | 5.90 | ||||
| 2025-08-14 | 13F | CoreCap Advisors, LLC | 526 | -0.19 | 22 | 4.76 | ||||
| 2025-08-12 | 13F | Proequities, Inc. | 0 | 0 | ||||||
| 2025-08-13 | 13F | Jones Financial Companies Lllp | 274,504 | 36.88 | 11,562 | 44.25 | ||||
| 2025-07-29 | 13F | Signature Estate & Investment Advisors Llc | 19,813 | -0.14 | 840 | 4.74 | ||||
| 2025-08-14 | 13F | Price T Rowe Associates Inc /md/ | 1,525,001 | 0.00 | 65 | 4.92 | ||||
| 2025-08-14 | 13F | Arete Wealth Advisors, LLC | 10,274 | -4.28 | 0 | |||||
| 2025-07-16 | 13F | Formidable Asset Management, LLC | 75,250 | 0.00 | 3,040 | 0.00 | ||||
| 2025-08-14 | 13F | Synovus Financial Corp | 36,545 | 337.98 | 1,549 | 359.64 | ||||
| 2025-07-25 | 13F | Yarger Wealth Strategies, Llc | 318,328 | -1.07 | 13,491 | 3.77 | ||||
| 2025-05-14 | 13F | Luminist Capital LLC | 0 | -100.00 | 0 | |||||
| 2025-07-18 | 13F | Truist Financial Corp | 8,890 | 0.00 | 377 | 4.74 | ||||
| 2025-05-16 | 13F | Coppell Advisory Solutions LLC | 0 | -100.00 | 0 | |||||
| 2025-08-07 | 13F | Summit Asset Management, LLC | 5,250 | 222 | ||||||
| 2025-08-15 | 13F | First Heartland Consultants, Inc. | 11,448 | 66.15 | 485 | 74.46 | ||||
| 2025-08-14 | 13F | Moneta Group Investment Advisors Llc | 8,282 | 7.47 | 351 | 12.54 | ||||
| 2025-07-31 | 13F | Cambridge Investment Research Advisors, Inc. | 57,224 | 12.93 | 2 | 0.00 | ||||
| 2025-08-18 | 13F | Geneos Wealth Management Inc. | 8,590 | -0.69 | 364 | 4.30 | ||||
| 2025-08-26 | 13F | Nautilus Advisors LLC | 61,484 | -0.44 | 2,606 | 4.45 |