AREC - American Resources Corporation Saham - Harga Saham, Kepemilikan Institusional, Pemegang Saham (NasdaqCM)

American Resources Corporation
US ˙ NasdaqCM ˙ US02927U2087

Mga Batayang Estadistika
Pemilik Institusional 50 total, 49 long only, 0 short only, 1 long/short - change of 31.58% MRQ
Alokasi Portofolio Rata-rata 0.0018 % - change of 67.43% MRQ
Jumlah Saham Beredar shares (source: Capital IQ)
Saham Institusional (Jangka Panjang) 8,786,880 - 10.39% (ex 13D/G) - change of 2.96MM shares 50.92% MRQ
Nilai Institusional (Jangka Panjang) $ 6,975 USD ($1000)
Kepemilikan Institusional dan Pemegang Saham

American Resources Corporation (US:AREC) memiliki 50 pemilik institusional dan pemegang saham yang telah mengajukan formulir 13D/G atau 13F kepada Komisi Bursa Efek (Securities Exchange Commission/SEC). Lembaga-lembaga ini memegang total 8,786,880 saham. Pemegang saham terbesar meliputi Vanguard Group Inc, VTSMX - Vanguard Total Stock Market Index Fund Investor Shares, Verition Fund Management LLC, VEXMX - Vanguard Extended Market Index Fund Investor Shares, BlackRock, Inc., Peak6 Llc, Geode Capital Management, Llc, UBS Group AG, Susquehanna International Group, Llp, and FSMAX - Fidelity Extended Market Index Fund .

Struktur kepemilikan institusional American Resources Corporation (NasdaqCM:AREC) menunjukkan posisi terkini di perusahaan oleh institusi dan dana, serta perubahan terbaru dalam ukuran posisi. Pemegang saham utama dapat mencakup investor individu, reksa dana, dana lindung nilai, atau institusi. Jadwal 13D menunjukkan bahwa investor memegang (atau pernah memegang) lebih dari 5% saham perusahaan dan bermaksud (atau pernah bermaksud) untuk secara aktif mengejar perubahan strategi bisnis. Jadwal 13G menunjukkan investasi pasif lebih dari 5%.

The share price as of September 5, 2025 is 1.87 / share. Previously, on September 6, 2024, the share price was 0.46 / share. This represents an increase of 305.11% over that period.

AREC / American Resources Corporation Institutional Ownership
Skor Sentimen Dana

Skor Sentimen Dana (sebelumnya dikenal sebagai Skor Akumulasi Kepemilikan) menemukan saham-saham yang paling banyak dibeli oleh dana. Ini adalah hasil dari model kuantitatif multi-faktor yang canggih yang mengidentifikasi perusahaan dengan tingkat akumulasi institusional tertinggi. Model penilaian menggunakan kombinasi dari total peningkatan pemilik yang diungkapkan, perubahan dalam alokasi portofolio pada pemilik tersebut, dan metrik lainnya. Angka berkisar dari 0 hingga 100, dengan angka yang lebih tinggi menunjukkan tingkat akumulasi yang lebih tinggi dibandingkan dengan perusahaan sejenisnya, dan 50 adalah rata-ratanya.

Frekuensi Pembaruan: Setiap Hari

Lihat Ownership Explorer, yang menyediakan daftar perusahaan dengan peringkat tertinggi.

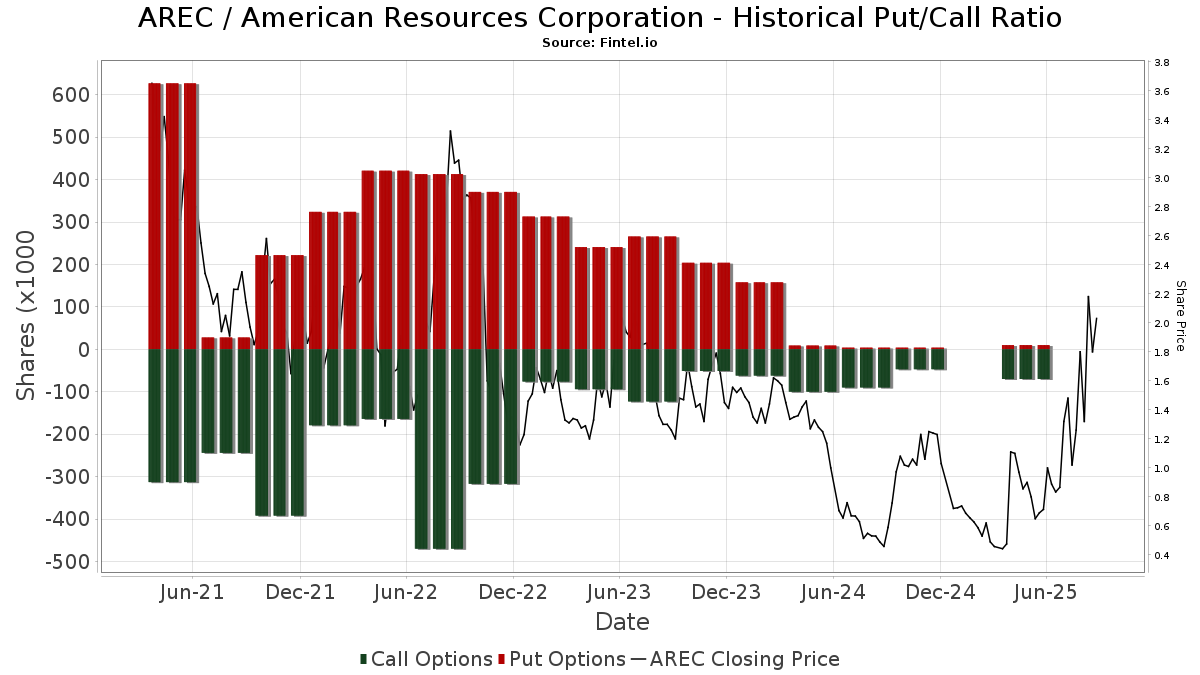
Rasio Put/Call Institusional

Selain melaporkan isu ekuitas dan utang standar, institusi dengan aset di bawah manajemen lebih dari 100 juta dolar AS juga harus mengungkapkan kepemilikan opsi put dan call mereka. Karena opsi put umumnya menunjukkan sentimen negatif, dan opsi call menunjukkan sentimen positif, kita dapat mengetahui sentimen institusional secara keseluruhan dengan memplot rasio put terhadap call. Grafik di sebelah kanan memplot rasio put/call historis untuk instrumen ini.

Menggunakan Rasio Put/Call sebagai indikator sentimen investor mengatasi salah satu kekurangan utama dari penggunaan total kepemilikan institusional, yaitu sejumlah besar aset yang dikelola diinvestasikan secara pasif untuk melacak indeks. Dana yang dikelola secara pasif biasanya tidak membeli opsi, sehingga indikator rasio put/call lebih akurat dalam melacak sentimen dana yang dikelola secara aktif.

AREC / American Resources Corporation Historical Put/Call Ratio
Pengajuan 13F dan NPORT

Detail pada pengajuan 13F tersedia gratis. Detail pada pengajuan NP memerlukan keanggotaan premium. Baris berwarna hijau menunjukkan posisi baru. Baris berwarna merah menunjukkan posisi yang sudah ditutup. Klik tautan ini ikon untuk melihat riwayat transaksi selengkapnya.

Tingkatkan untuk membuka data premium dan mengekspor ke Excel .

Tanggal File Sumber Investor Ketik Presyo ng Avg
(Silangan)
Saham Δ Saham
(%)
Dilaporkan
Nilai
($1000)
Nilai Δ
(%)
Alokasi Port
(%)
2025-05-29 NP JAFEX - Total Stock Market Index Trust NAV 0 -100.00 0 -100.00
2025-08-14 13F Jane Street Group, Llc 167,865 139
2025-07-15 13F Fortitude Family Office, LLC 1,377 1
2025-08-06 13F Ethos Financial Group, LLC 26,464 0.00 22 75.00
2025-07-09 13F Goelzer Investment Management, Inc. 13,522 11
2025-08-08 13F Gts Securities Llc 10,017 0.17 8 100.00
2025-08-11 13F Vanguard Group Inc 3,004,908 1.47 2,488 80.03
2025-08-14 13F Hrt Financial Lp 36,229 183.13 0
2025-05-15 13F Citadel Advisors Llc 0 -100.00 0 -100.00
2025-08-08 13F SG Americas Securities, LLC 72,773 0
2025-08-14 13F UBS Group AG 403,353 544,971.62 334
2025-08-14 13F Verition Fund Management LLC 1,117,569 926
2025-08-12 13F J.w. Cole Advisors, Inc. 12,000 20.00 10 125.00
2025-08-27 NP VBINX - Vanguard Balanced Index Fund Investor Shares This fund is a listed as child fund of Vanguard Group Inc and if that institution has disclosed ownership in this security, then these positions will not be double counted when calculating total shares and total value 26,300 0.00 22 75.00
2025-08-08 13F Geode Capital Management, Llc 628,606 -1.07 521 75.68
2025-08-12 13F Jpmorgan Chase & Co 122,856 86,418.31 102
2025-08-07 13F Parkside Financial Bank & Trust 1 0
2025-08-07 13F Allworth Financial LP 0 -100.00 0
2025-03-26 NP SWTSX - Schwab Total Stock Market Index Fund This fund is a listed as child fund of Charles Schwab Investment Management Inc and if that institution has disclosed ownership in this security, then these positions will not be double counted when calculating total shares and total value 38,760 0.00 25 -37.50
2025-08-14 13F Bank Of America Corp /de/ 518 16.40 0
2025-08-18 13F Wolverine Trading, Llc Put 10,900 9
2025-08-14 13F Royal Bank Of Canada 16,000 13
2025-08-14 13F State Street Corp 221,585 0.00 184 77.67
2025-07-25 13F JustInvest LLC 20,845 17
2025-08-18 13F Wolverine Trading, Llc Call 10,500 9
2025-07-08 13F Chemistry Wealth Management LLC 10,000 0.00 8 100.00
2025-08-12 13F BlackRock, Inc. 757,217 -11.91 627 56.36
2025-07-24 NP FSKAX - Fidelity Total Market Index Fund This fund is a listed as child fund of Fmr Llc and if that institution has disclosed ownership in this security, then these positions will not be double counted when calculating total shares and total value 92,737 0.00 59 0.00
2025-08-14 13F Citadel Advisors Llc Call 35,900 30
2025-08-14 13F Peak6 Llc 700,844 581
2025-08-15 13F Morgan Stanley 42,885 1.92 36 84.21
2025-08-13 13F Worth Venture Partners, LLC 25,000 21
2025-06-06 13F/A Advisor Group Holdings, Inc. 0 -100.00 0
2025-08-12 13F XTX Topco Ltd 40,076 33
2025-08-27 NP VTSMX - Vanguard Total Stock Market Index Fund Investor Shares This fund is a listed as child fund of Vanguard Group Inc and if that institution has disclosed ownership in this security, then these positions will not be double counted when calculating total shares and total value 2,090,623 0.00 1,732 77.36
2025-05-07 13F Spectrum Wealth Counsel, LLC 2,000 0.00 1 -100.00
2025-08-12 13F Virtu Financial LLC 14,918 -85.36 0
2025-07-24 NP FNCMX - Fidelity Nasdaq Composite Index Fund This fund is a listed as child fund of Fmr Llc and if that institution has disclosed ownership in this security, then these positions will not be double counted when calculating total shares and total value 86,855 0.00 55 0.00
2025-08-08 13F Creative Planning 37,892 65.53 31 210.00
2025-04-29 13F Brookstone Capital Management 0 -100.00 0
2025-08-12 13F Indie Asset Partners, LLC 25,000 0.00 21 81.82
2025-07-24 NP FSMAX - Fidelity Extended Market Index Fund This fund is a listed as child fund of Fmr Llc and if that institution has disclosed ownership in this security, then these positions will not be double counted when calculating total shares and total value 282,042 -1.44 180 -1.64
2025-08-14 13F Raymond James Financial Inc 10,438 9
2025-08-26 NP EQ ADVISORS TRUST - 1290 VT Micro Cap Portfolio Class IB 0 -100.00 0 -100.00
2025-08-15 13F CI Private Wealth, LLC 19,493 0.00 16 77.78
2025-07-31 13F Ground Swell Capital, LLC 0 -100.00 0 -100.00
2025-08-12 13F Proequities, Inc. 0 0
2025-05-09 13F Charles Schwab Investment Management Inc 0 -100.00 0 -100.00
2025-08-14 13F Susquehanna International Group, Llp 343,339 2,429.01 284 4,633.33
2025-08-14 13F Susquehanna International Group, Llp Call 24,500 20
2025-08-13 13F Northern Trust Corp 113,699 0.00 94 77.36
2025-04-17 13F Janney Montgomery Scott LLC 0 -100.00 0
2025-05-15 13F Citadel Advisors Llc Put 0 -100.00 0 -100.00
2025-08-05 13F Simplex Trading, Llc 57,029 762.64 0
2025-07-24 13F Thompson Investment Management, Inc. 38,467 0.00 32 82.35
2025-05-27 NP IWC - iShares Micro-Cap ETF This fund is a listed as child fund of BlackRock Inc. and if that institution has disclosed ownership in this security, then these positions will not be double counted when calculating total shares and total value 93,200 -2.04 44 -55.21
2025-07-28 13F Cypress Wealth Services, LLC 13,467 0.00 11 83.33
2025-08-11 13F Citigroup Inc 0 -100.00 0
2025-07-24 NP FCFMX - Fidelity Series Total Market Index Fund This fund is a listed as child fund of Fmr Llc and if that institution has disclosed ownership in this security, then these positions will not be double counted when calculating total shares and total value 70,285 1.61 45 0.00
2025-08-12 13F LPL Financial LLC 22,300 -4.29 18 80.00
2025-08-27 NP VITNX - Vanguard Institutional Total Stock Market Index Fund Institutional Shares This fund is a listed as child fund of Vanguard Group Inc and if that institution has disclosed ownership in this security, then these positions will not be double counted when calculating total shares and total value 43,481 63.01 36 -2.70
2025-05-15 13F Two Sigma Securities, Llc 0 -100.00 0 -100.00
2025-08-27 NP VEXMX - Vanguard Extended Market Index Fund Investor Shares This fund is a listed as child fund of Vanguard Group Inc and if that institution has disclosed ownership in this security, then these positions will not be double counted when calculating total shares and total value 824,157 0.00 683 77.14
2025-07-14 13F UMA Financial Services, Inc. 2,529 2
2025-08-15 13F Tower Research Capital LLC (TRC) 8,680 207.69 7 600.00
Fintel data has been cited in the following publications:
Daily Mail Fox Business Business Insider Wall Street Journal The Washington Post Bloomberg Financial Times Globe and Mail
NASDAQ.com Reuters The Guardian Associated Press FactCheck.org Snopes Politifact
Federal Register The Intercept Forbes Fortune Magazine TheStreet Time Magazine Canadian Broadcasting Corporation International Business Times
Cambridge University Press Investopedia MarketWatch NY Daily News Entrepreneur Newsweek Barron's El Economista