Mga Batayang Estadistika
| Pemilik Institusional | 114 total, 114 long only, 0 short only, 0 long/short - change of 8.57% MRQ |
| Alokasi Portofolio Rata-rata | 0.1651 % - change of -28.39% MRQ |
| Saham Institusional (Jangka Panjang) | 40,217,603 (ex 13D/G) - change of 0.77MM shares 1.96% MRQ |
| Nilai Institusional (Jangka Panjang) | $ 540,147 USD ($1000) |
Kepemilikan Institusional dan Pemegang Saham
Compañía Cervecerías Unidas S.A. - Depositary Receipt (Common Stock) (US:CCU) memiliki 114 pemilik institusional dan pemegang saham yang telah mengajukan formulir 13D/G atau 13F kepada Komisi Bursa Efek (Securities Exchange Commission/SEC). Lembaga-lembaga ini memegang total 40,217,603 saham. Pemegang saham terbesar meliputi First Eagle Investment Management, LLC, SGOVX - First Eagle Overseas Fund Class A, Discerene Group LP, Wellington Management Group Llp, HILAX - The Hartford International Value Fund Class A, FEBAX - First Eagle Global Income Builder Fund Class A, Bennbridge Ltd, Macquarie Group Ltd, Acadian Asset Management Llc, and BlackRock, Inc. .
Struktur kepemilikan institusional Compañía Cervecerías Unidas S.A. - Depositary Receipt (Common Stock) (NYSE:CCU) menunjukkan posisi terkini di perusahaan oleh institusi dan dana, serta perubahan terbaru dalam ukuran posisi. Pemegang saham utama dapat mencakup investor individu, reksa dana, dana lindung nilai, atau institusi. Jadwal 13D menunjukkan bahwa investor memegang (atau pernah memegang) lebih dari 5% saham perusahaan dan bermaksud (atau pernah bermaksud) untuk secara aktif mengejar perubahan strategi bisnis. Jadwal 13G menunjukkan investasi pasif lebih dari 5%.
The share price as of September 5, 2025 is 12.38 / share. Previously, on September 9, 2024, the share price was 10.34 / share. This represents an increase of 19.73% over that period.

Skor Sentimen Dana
Skor Sentimen Dana (sebelumnya dikenal sebagai Skor Akumulasi Kepemilikan) menemukan saham-saham yang paling banyak dibeli oleh dana. Ini adalah hasil dari model kuantitatif multi-faktor yang canggih yang mengidentifikasi perusahaan dengan tingkat akumulasi institusional tertinggi. Model penilaian menggunakan kombinasi dari total peningkatan pemilik yang diungkapkan, perubahan dalam alokasi portofolio pada pemilik tersebut, dan metrik lainnya. Angka berkisar dari 0 hingga 100, dengan angka yang lebih tinggi menunjukkan tingkat akumulasi yang lebih tinggi dibandingkan dengan perusahaan sejenisnya, dan 50 adalah rata-ratanya.
Frekuensi Pembaruan: Setiap Hari
Lihat Ownership Explorer, yang menyediakan daftar perusahaan dengan peringkat tertinggi.
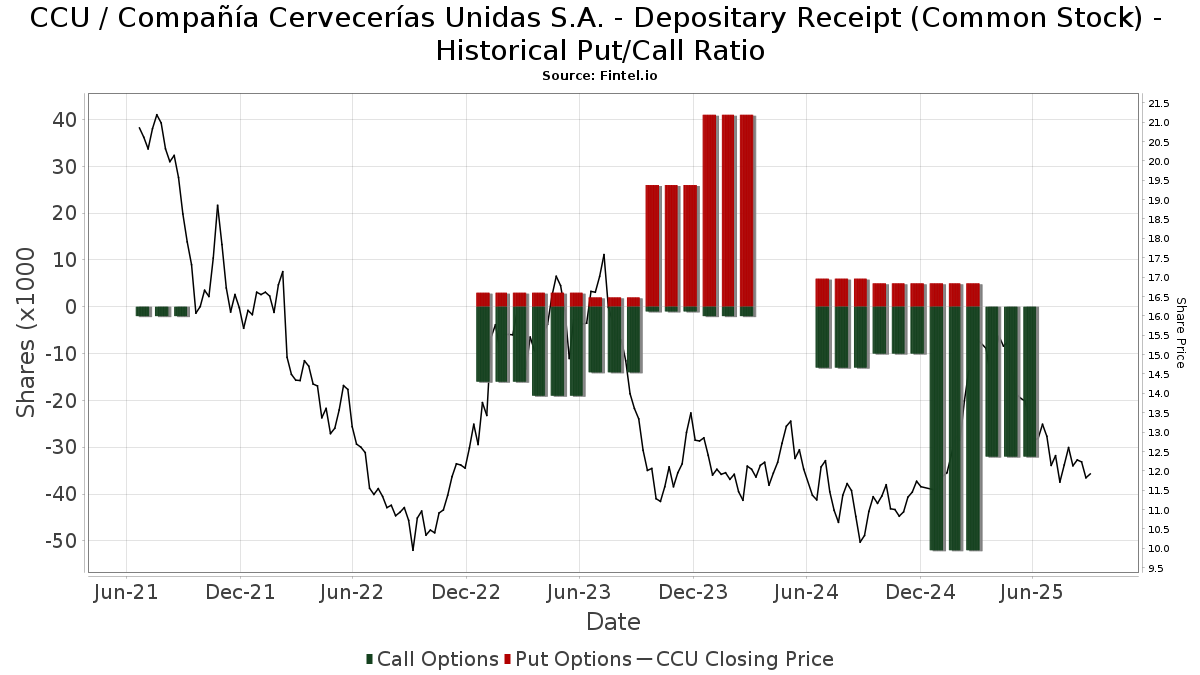
Rasio Put/Call Institusional
Selain melaporkan isu ekuitas dan utang standar, institusi dengan aset di bawah manajemen lebih dari 100 juta dolar AS juga harus mengungkapkan kepemilikan opsi put dan call mereka. Karena opsi put umumnya menunjukkan sentimen negatif, dan opsi call menunjukkan sentimen positif, kita dapat mengetahui sentimen institusional secara keseluruhan dengan memplot rasio put terhadap call. Grafik di sebelah kanan memplot rasio put/call historis untuk instrumen ini.
Menggunakan Rasio Put/Call sebagai indikator sentimen investor mengatasi salah satu kekurangan utama dari penggunaan total kepemilikan institusional, yaitu sejumlah besar aset yang dikelola diinvestasikan secara pasif untuk melacak indeks. Dana yang dikelola secara pasif biasanya tidak membeli opsi, sehingga indikator rasio put/call lebih akurat dalam melacak sentimen dana yang dikelola secara aktif.
Pengajuan 13F dan NPORT
Detail pada pengajuan 13F tersedia gratis. Detail pada pengajuan NP memerlukan keanggotaan premium. Baris berwarna hijau menunjukkan posisi baru. Baris berwarna merah menunjukkan posisi yang sudah ditutup. Klik tautan ini ikon untuk melihat riwayat transaksi selengkapnya.
Tingkatkan
untuk membuka data premium dan mengekspor ke Excel ![]() .
.
| Tanggal File | Sumber | Investor | Ketik | Presyo ng Avg (Silangan) |
Saham | Δ Saham (%) |
Dilaporkan Nilai ($1000) |
Nilai Δ (%) |
Alokasi Port (%) |
|
|---|---|---|---|---|---|---|---|---|---|---|
| 2025-07-31 | 13F | MQS Management LLC | 17,266 | 223 | ||||||
| 2025-06-26 | NP | DFSE - Dimensional Emerging Markets Sustainability Core 1 ETF | 5,206 | 253.43 | 79 | 364.71 | ||||
| 2025-07-28 | NP | AVEM - Avantis Emerging Markets Equity ETF This fund is a listed as child fund of American Century Companies Inc and if that institution has disclosed ownership in this security, then these positions will not be double counted when calculating total shares and total value | 157,260 | 173.52 | 2,143 | 167.21 | ||||
| 2025-04-25 | 13F | Ameritas Advisory Services, LLC | 0 | -100.00 | 0 | |||||
| 2025-08-14 | 13F | Goldman Sachs Group Inc | 13,405 | -64.83 | 173 | -70.12 | ||||
| 2025-06-26 | NP | DEXC - Dimensional Emerging Markets ex China Core Equity ETF | 3,422 | 134.87 | 52 | 205.88 | ||||
| 2025-06-26 | NP | DFA INVESTMENT DIMENSIONS GROUP INC - World ex U.S. Core Equity Portfolio Institutional Class Shares | 5,319 | 0.00 | 81 | 25.00 | ||||
| 2025-06-26 | NP | DFAX - Dimensional World ex U.S. Core Equity 2 ETF | 19,543 | 0.00 | 297 | 25.32 | ||||
| 2025-08-14 | 13F | Fmr Llc | 138 | 0.00 | 2 | -50.00 | ||||
| 2025-08-14 | 13F | Federation des caisses Desjardins du Quebec | 19,108 | 0.00 | 247 | -14.83 | ||||
| 2025-07-08 | 13F | Parallel Advisors, LLC | 1,472 | -16.08 | 19 | -26.92 | ||||
| 2025-08-14 | 13F | Smartleaf Asset Management LLC | 0 | -100.00 | 0 | |||||
| 2025-08-12 | 13F | Rhumbline Advisers | 6,455 | -1.53 | 83 | -16.16 | ||||
| 2025-08-13 | 13F | Quadrant Capital Group Llc | 16,715 | -37.47 | 216 | -47.04 | ||||
| 2025-08-07 | 13F | Allworth Financial LP | 168 | 13.51 | 2 | 0.00 | ||||
| 2025-08-06 | 13F | Savant Capital, LLC | 12,778 | 165 | ||||||
| 2025-08-05 | 13F | Simplex Trading, Llc | 2,022 | 0 | ||||||
| 2025-06-27 | NP | FEBAX - First Eagle Global Income Builder Fund Class A | 1,327,830 | 0.00 | 20,210 | 25.37 | ||||
| 2025-07-25 | NP | DEMAX - Delaware Emerging Markets Fund Class A | 410,528 | 0.00 | 5,595 | -2.29 | ||||
| 2025-08-04 | 13F | Assetmark, Inc | 65 | 96.97 | 1 | |||||
| 2025-07-22 | 13F | Gsa Capital Partners Llp | 0 | -100.00 | 0 | |||||
| 2025-08-12 | 13F | Trexquant Investment LP | 0 | -100.00 | 0 | |||||
| 2025-07-29 | NP | WEUSX - Siit World Equity Ex-us Fund - Class A | 76,859 | 1,048 | ||||||
| 2025-08-13 | 13F | Jump Financial, LLC | 23,177 | -35.67 | 299 | -45.34 | ||||
| 2025-07-29 | NP | RBB FUND, INC. - Aquarius International Fund | 4,167 | 0.00 | 57 | -3.45 | ||||
| 2025-08-28 | NP | FEOVX - First Eagle Overseas Variable Fund | 165,749 | 0.00 | 2,141 | -15.01 | ||||
| 2025-08-14 | 13F | Bank Of America Corp /de/ | 282,777 | 8.67 | 3,653 | -7.64 | ||||
| 2025-08-19 | 13F | Advisory Services Network, LLC | 0 | -100.00 | 0 | |||||
| 2025-08-13 | 13F | Employees Retirement System of Texas | 5,694 | 0.00 | 0 | |||||
| 2025-08-12 | 13F | BlackRock, Inc. | 450,421 | -5.76 | 5,819 | -19.89 | ||||
| 2025-05-08 | 13F | XTX Topco Ltd | 0 | -100.00 | 0 | |||||
| 2025-07-07 | 13F | Investors Research Corp | 36,275 | 0.00 | 469 | -15.06 | ||||
| 2025-08-08 | 13F | SBI Securities Co., Ltd. | 19 | 0.00 | 0 | |||||
| 2025-06-26 | NP | DFCEX - Emerging Markets Core Equity Portfolio - Institutional Class This fund is a listed as child fund of Dimensional Fund Advisors Lp and if that institution has disclosed ownership in this security, then these positions will not be double counted when calculating total shares and total value | 75,722 | 0.00 | 1,152 | 25.35 | ||||
| 2025-07-18 | 13F | Ninety One UK Ltd | 312,746 | 0.00 | 4,041 | -15.00 | ||||
| 2025-08-29 | NP | PEIFX - PIMCO RAE Emerging Markets Fund Institutional Class | 47,816 | -50.19 | 311 | -43.53 | ||||
| 2025-08-14 | 13F | Jane Street Group, Llc | 25,796 | 101.59 | 333 | 71.65 | ||||
| 2025-07-29 | 13F | Stephens Inc /ar/ | 21,750 | 0.93 | 281 | -14.07 | ||||
| 2025-07-22 | 13F | Sage Investment Counsel LLC | 0 | -100.00 | 0 | |||||
| 2025-07-24 | 13F | Jfs Wealth Advisors, Llc | 45 | 0.00 | 1 | |||||
| 2025-09-04 | 13F/A | Advisor Group Holdings, Inc. | 840 | 1,687.23 | 11 | |||||
| 2025-07-14 | 13F | UMA Financial Services, Inc. | 82 | 22.39 | 1 | 0.00 | ||||
| 2025-07-31 | 13F | Fielder Capital Group LLC | 12,636 | 0.00 | 163 | -15.10 | ||||
| 2025-08-14 | 13F | Citadel Advisors Llc | Put | 0 | -100.00 | 0 | ||||
| 2025-08-14 | 13F | UBS Group AG | 70,654 | 54.23 | 913 | 31.03 | ||||
| 2025-08-14 | 13F | Vident Advisory, LLC | 43,220 | -3.31 | 558 | -17.82 | ||||
| 2025-08-14 | 13F | D. E. Shaw & Co., Inc. | 86,721 | -18.98 | 1,120 | -31.12 | ||||
| 2025-07-16 | 13F | Signaturefd, Llc | 1,631 | -19.30 | 21 | -30.00 | ||||
| 2025-06-26 | NP | DFEM - Dimensional Emerging Markets Core Equity 2 ETF | 18,761 | 48.37 | 286 | 86.27 | ||||
| 2025-08-14 | 13F | Point72 Asset Management, L.P. | 65,200 | 842 | ||||||
| 2025-08-14 | 13F | Susquehanna International Group, Llp | Call | 13,600 | -38.46 | 176 | -47.76 | |||
| 2025-08-27 | NP | OAIEX - Optimum International Fund Class A | 18,470 | 91.32 | 239 | 96.69 | ||||
| 2025-07-11 | 13F | Diversified Trust Co | 12,007 | 155 | ||||||
| 2025-08-15 | 13F | Tower Research Capital LLC (TRC) | 31 | -32.61 | 0 | |||||
| 2025-08-26 | NP | SBHEX - Segall Bryant & Hamill Emerging Markets Fund Retail Class | 2,600 | 34 | ||||||
| 2025-08-14 | 13F | Citadel Advisors Llc | Call | 19,000 | -37.91 | 245 | -47.31 | |||
| 2025-07-11 | 13F | Farther Finance Advisors, LLC | 50 | 0.00 | 1 | |||||
| 2025-05-01 | 13F | Genesis Investment Management, LLP | 0 | -100.00 | 0 | |||||
| 2025-08-12 | 13F | Jpmorgan Chase & Co | 296 | 122.56 | 4 | 50.00 | ||||
| 2025-05-14 | 13F | Catalyst Funds Management Pty Ltd | 0 | -100.00 | 0 | |||||
| 2025-08-29 | NP | SA FUNDS INVESTMENT TRUST - SA Emerging Markets Value Fund | 788 | 10 | ||||||
| 2025-08-06 | 13F | First Eagle Investment Management, LLC | 15,891,620 | -0.00 | 205,320 | -15.00 | ||||
| 2025-05-14 | 13F | Guggenheim Capital Llc | 0 | -100.00 | 0 | |||||
| 2025-08-13 | 13F | BLI - Banque de Luxembourg Investments | 435,000 | -13.86 | 5,606 | -27.42 | ||||
| 2025-07-10 | 13F | Banque de Luxembourg S.A. | 6,623 | 0.00 | 101 | 0.00 | ||||
| 2025-08-14 | 13F | Barometer Capital Management Inc. | 9,543 | 0.00 | 123 | -13.99 | ||||
| 2025-08-14 | 13F | Parvin Asset Management, LLC | 3,875 | 0.00 | 50 | -13.79 | ||||
| 2025-08-12 | 13F | Virtu Financial LLC | 13,034 | -18.58 | 0 | |||||
| 2025-05-15 | 13F | Two Sigma Advisers, Lp | 0 | -100.00 | 0 | |||||
| 2025-07-07 | 13F | Northwest & Ethical Investments L.P. | 0 | -100.00 | 0 | -100.00 | ||||
| 2025-08-14 | 13F | Bennbridge Ltd | 917,510 | -20.42 | 11,854 | -32.36 | ||||
| 2025-08-13 | 13F | Marshall Wace, Llp | 255,380 | 83.78 | 3,300 | 56.20 | ||||
| 2025-06-26 | NP | DAADX - Emerging Markets ex China Core Equity Portfolio Institutional Class | 5,028 | 0.00 | 77 | 24.59 | ||||
| 2025-08-13 | 13F | Arrowstreet Capital, Limited Partnership | 166,244 | 386.65 | 2,148 | 313.68 | ||||
| 2025-08-08 | 13F | Pnc Financial Services Group, Inc. | 78 | 44.44 | 1 | |||||
| 2025-08-29 | NP | MFEM - PIMCO RAFI Dynamic Multi-Factor Emerging Markets Equity ETF | 10,550 | 0.00 | 69 | -13.92 | ||||
| 2025-08-14 | 13F | State Street Corp | 162,060 | 44.62 | 2,094 | 22.90 | ||||
| 2025-08-14 | 13F | Cubist Systematic Strategies, LLC | 132,197 | 429.57 | 1,708 | 350.40 | ||||
| 2025-08-15 | 13F | Morgan Stanley | 126,667 | 3.86 | 1,637 | -11.71 | ||||
| 2025-07-25 | 13F | Cwm, Llc | 138 | 0 | ||||||
| 2025-08-12 | 13F | Dimensional Fund Advisors Lp | 171,396 | 11.07 | 2,214 | -5.59 | ||||
| 2025-08-13 | 13F | Renaissance Technologies Llc | 391,065 | -4.52 | 5,053 | -18.84 | ||||
| 2025-08-14 | 13F | Ieq Capital, Llc | 15,271 | 197 | ||||||
| 2025-08-12 | 13F | SRS Capital Advisors, Inc. | 90 | 1 | ||||||
| 2025-08-14 | 13F | Mariner, LLC | 66,408 | 8.11 | 858 | -8.15 | ||||
| 2025-06-26 | NP | HILAX - The Hartford International Value Fund Class A | 1,355,255 | 0.00 | 20,627 | 25.37 | ||||
| 2025-08-13 | 13F | Northern Trust Corp | 98,115 | -13.52 | 1,268 | -26.51 | ||||
| 2025-08-14 | 13F | BTG Pactual Asset Management US LLC | 14,656 | 189 | ||||||
| 2025-07-30 | 13F | Ethic Inc. | 12,255 | -2.61 | 158 | -18.65 | ||||
| 2025-08-12 | 13F | Proequities, Inc. | 0 | 0 | ||||||
| 2025-07-24 | 13F | Us Bancorp \de\ | 947 | 0.00 | 12 | -14.29 | ||||
| 2025-07-31 | 13F | R Squared Ltd | 29,605 | 49.45 | 382 | 26.91 | ||||
| 2025-08-11 | 13F | Principal Securities, Inc. | 85 | 214.81 | 1 | |||||
| 2025-08-14 | 13F | Royal Bank Of Canada | 124,778 | 237.85 | 1,612 | 187.34 | ||||
| 2025-08-14 | 13F | Raymond James Financial Inc | 1,212 | 16 | ||||||
| 2025-08-15 | 13F | WealthCollab, LLC | 202 | 0.00 | 3 | -33.33 | ||||
| 2025-08-14 | 13F | Two Sigma Investments, Lp | 66,555 | 29.78 | 860 | 10.27 | ||||
| 2025-08-07 | 13F | Acadian Asset Management Llc | 487,149 | 130.10 | 6 | 100.00 | ||||
| 2025-08-13 | 13F | Channing Global Advisors, Llc | 9,058 | -39.94 | 117 | -48.91 | ||||
| 2025-08-12 | 13F | O'shaughnessy Asset Management, Llc | 18,159 | 235 | ||||||
| 2025-08-13 | 13F | Natixis Advisors, L.p. | 15,549 | 0 | ||||||
| 2025-07-24 | 13F | Ronald Blue Trust, Inc. | 25,295 | 4.30 | 327 | -11.41 | ||||
| 2025-07-15 | 13F | Ballentine Partners, LLC | 13,372 | -1.19 | 173 | -16.10 | ||||
| 2025-08-21 | NP | MEMSX - Mercer Emerging Markets Equity Fund Class I | 86,587 | -2.70 | 1,119 | -17.31 | ||||
| 2025-08-06 | 13F | Stokes Family Office, LLC | 25,000 | 0.00 | 323 | -15.00 | ||||
| 2025-05-28 | NP | QCSTRX - Stock Account Class R1 | 105,958 | 20.03 | 803 | 57.76 | ||||
| 2025-06-27 | NP | SGOVX - First Eagle Overseas Fund Class A | 9,392,572 | 0.00 | 142,955 | 25.37 | ||||
| 2025-08-29 | NP | FRDM - Freedom 100 Emerging Markets ETF | 442,501 | 16.75 | 5,717 | -0.76 | ||||
| 2025-08-11 | 13F | Nomura Asset Management Co Ltd | 1,500 | 0.00 | 19 | -13.64 | ||||
| 2025-08-14 | 13F | Wellington Management Group Llp | 1,934,547 | -0.52 | 24,994 | -15.44 | ||||
| 2025-07-28 | NP | AVSE - Avantis Responsible Emerging Markets Equity ETF | 4,253 | 153.31 | 58 | 147.83 | ||||
| 2025-07-30 | NP | APIE - ActivePassive International Equity ETF | 46,854 | 1.04 | 639 | -1.24 | ||||
| 2025-08-25 | NP | EITEX - Parametric Tax-Managed Emerging Markets Fund Institutional Class | 23,700 | 0.00 | 306 | -15.00 | ||||
| 2025-05-05 | 13F | Lindbrook Capital, Llc | 1,014 | -3.43 | 15 | 36.36 | ||||
| 2025-07-21 | 13F | Qrg Capital Management, Inc. | 11,251 | 3.59 | 145 | -12.12 | ||||
| 2025-08-14 | 13F | Citadel Advisors Llc | 0 | -100.00 | 0 | |||||
| 2025-07-28 | NP | AVXC - Avantis Emerging Markets ex-China Equity ETF | 3,569 | 37.43 | 49 | 33.33 | ||||
| 2025-08-12 | 13F | Coldstream Capital Management Inc | 0 | -100.00 | 0 | |||||
| 2025-08-12 | 13F | American Century Companies Inc | 173,672 | 172.19 | 2,244 | 131.48 | ||||
| 2025-08-12 | 13F | MAI Capital Management | 1,336 | 17 | ||||||
| 2025-08-01 | 13F | Envestnet Asset Management Inc | 78,043 | 6.87 | 1,008 | -9.11 | ||||
| 2025-07-18 | 13F | Naples Global Advisors, Llc | 31,200 | 0.00 | 403 | -14.98 | ||||
| 2025-06-26 | NP | Dfa Investment Trust Co - The Emerging Markets Small Cap Series This fund is a listed as child fund of Dimensional Fund Advisors Lp and if that institution has disclosed ownership in this security, then these positions will not be double counted when calculating total shares and total value | 17,960 | 0.00 | 273 | 25.23 | ||||
| 2025-04-25 | 13F | KBC Group NV | 0 | -100.00 | 0 | |||||
| 2025-08-13 | 13F | Russell Investments Group, Ltd. | 12,703 | 164 | ||||||
| 2025-07-14 | 13F | GAMMA Investing LLC | 2,616 | 0.62 | 34 | -15.38 | ||||
| 2025-05-14 | 13F | Huntington National Bank | 0 | -100.00 | 0 | |||||
| 2025-08-14 | 13F | Wells Fargo & Company/mn | 34,688 | 41.90 | 448 | 20.75 | ||||
| 2025-08-14 | 13F | Aquatic Capital Management LLC | 28,837 | 161.54 | 373 | 122.75 | ||||
| 2025-08-14 | 13F | Macquarie Group Ltd | 559,389 | 3.41 | 7,227 | -12.10 | ||||
| 2025-08-13 | 13F | EverSource Wealth Advisors, LLC | 3,233 | 1,252.72 | 42 | 1,266.67 | ||||
| 2025-08-14 | 13F | Prelude Capital Management, Llc | 0 | -100.00 | 0 | |||||
| 2025-08-12 | 13F | Discerene Group LP | 2,517,157 | 0.00 | 32,522 | -15.00 |
Other Listings
| DE:CVU | € 10.70 |