Mga Batayang Estadistika
| Pemilik Institusional | 255 total, 255 long only, 0 short only, 0 long/short - change of 6.69% MRQ |
| Alokasi Portofolio Rata-rata | 0.4636 % - change of -6.78% MRQ |
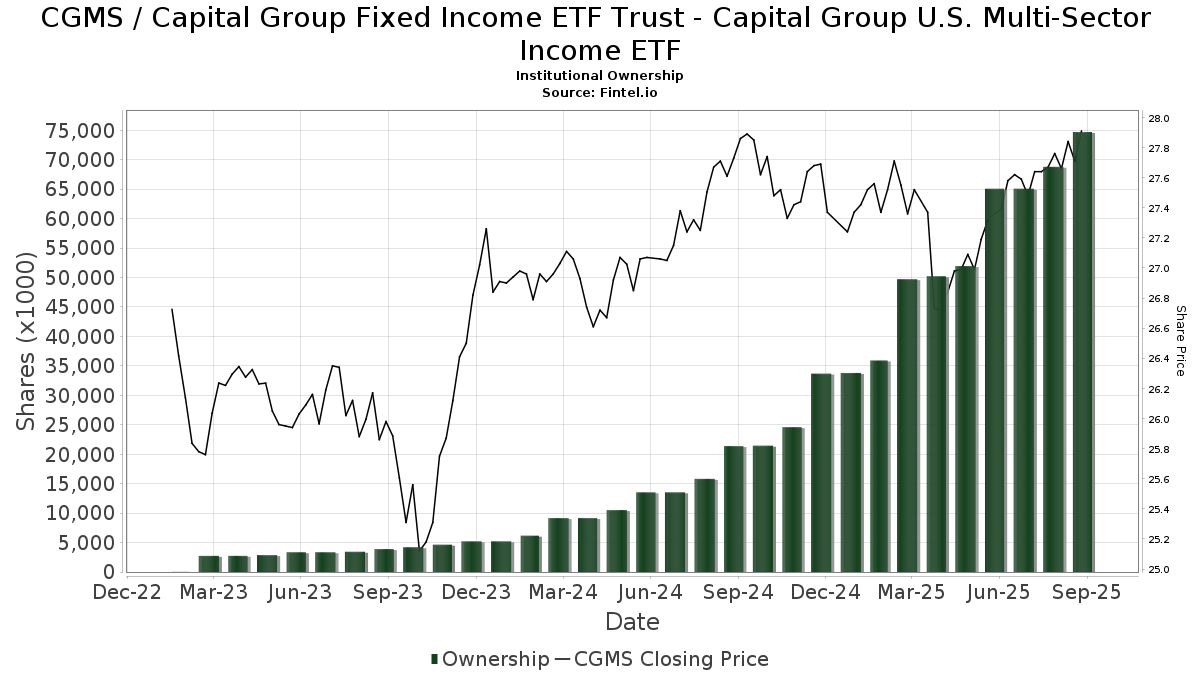
| Saham Institusional (Jangka Panjang) | 74,717,276 (ex 13D/G) - change of 8.81MM shares 13.53% MRQ |
| Nilai Institusional (Jangka Panjang) | $ 1,885,672 USD ($1000) |
Kepemilikan Institusional dan Pemegang Saham
Capital Group Fixed Income ETF Trust - Capital Group U.S. Multi-Sector Income ETF (US:CGMS) memiliki 255 pemilik institusional dan pemegang saham yang telah mengajukan formulir 13D/G atau 13F kepada Komisi Bursa Efek (Securities Exchange Commission/SEC). Lembaga-lembaga ini memegang total 74,717,276 saham. Pemegang saham terbesar meliputi LPL Financial LLC, Morgan Stanley, Envestnet Asset Management Inc, Raymond James Financial Inc, Wells Fargo & Company/mn, Cetera Investment Advisers, Commonwealth Equity Services, Llc, UBS Group AG, Great Valley Advisor Group, Inc., and Capital Advantage, Inc. .
Struktur kepemilikan institusional Capital Group Fixed Income ETF Trust - Capital Group U.S. Multi-Sector Income ETF (ARCA:CGMS) menunjukkan posisi terkini di perusahaan oleh institusi dan dana, serta perubahan terbaru dalam ukuran posisi. Pemegang saham utama dapat mencakup investor individu, reksa dana, dana lindung nilai, atau institusi. Jadwal 13D menunjukkan bahwa investor memegang (atau pernah memegang) lebih dari 5% saham perusahaan dan bermaksud (atau pernah bermaksud) untuk secara aktif mengejar perubahan strategi bisnis. Jadwal 13G menunjukkan investasi pasif lebih dari 5%.
The share price as of September 3, 2025 is 27.71 / share. Previously, on September 4, 2024, the share price was 27.61 / share. This represents an increase of 0.36% over that period.
Skor Sentimen Dana
Skor Sentimen Dana (sebelumnya dikenal sebagai Skor Akumulasi Kepemilikan) menemukan saham-saham yang paling banyak dibeli oleh dana. Ini adalah hasil dari model kuantitatif multi-faktor yang canggih yang mengidentifikasi perusahaan dengan tingkat akumulasi institusional tertinggi. Model penilaian menggunakan kombinasi dari total peningkatan pemilik yang diungkapkan, perubahan dalam alokasi portofolio pada pemilik tersebut, dan metrik lainnya. Angka berkisar dari 0 hingga 100, dengan angka yang lebih tinggi menunjukkan tingkat akumulasi yang lebih tinggi dibandingkan dengan perusahaan sejenisnya, dan 50 adalah rata-ratanya.
Frekuensi Pembaruan: Setiap Hari
Lihat Ownership Explorer, yang menyediakan daftar perusahaan dengan peringkat tertinggi.
Rasio Put/Call Institusional
Selain melaporkan isu ekuitas dan utang standar, institusi dengan aset di bawah manajemen lebih dari 100 juta dolar AS juga harus mengungkapkan kepemilikan opsi put dan call mereka. Karena opsi put umumnya menunjukkan sentimen negatif, dan opsi call menunjukkan sentimen positif, kita dapat mengetahui sentimen institusional secara keseluruhan dengan memplot rasio put terhadap call. Grafik di sebelah kanan memplot rasio put/call historis untuk instrumen ini.
Menggunakan Rasio Put/Call sebagai indikator sentimen investor mengatasi salah satu kekurangan utama dari penggunaan total kepemilikan institusional, yaitu sejumlah besar aset yang dikelola diinvestasikan secara pasif untuk melacak indeks. Dana yang dikelola secara pasif biasanya tidak membeli opsi, sehingga indikator rasio put/call lebih akurat dalam melacak sentimen dana yang dikelola secara aktif.
Pengajuan 13F dan NPORT
Detail pada pengajuan 13F tersedia gratis. Detail pada pengajuan NP memerlukan keanggotaan premium. Baris berwarna hijau menunjukkan posisi baru. Baris berwarna merah menunjukkan posisi yang sudah ditutup. Klik tautan ini ikon untuk melihat riwayat transaksi selengkapnya.
Tingkatkan
untuk membuka data premium dan mengekspor ke Excel ![]() .
.
| Tanggal File | Sumber | Investor | Ketik | Presyo ng Avg (Silangan) |
Saham | Δ Saham (%) |
Dilaporkan Nilai ($1000) |
Nilai Δ (%) |
Alokasi Port (%) |
|
|---|---|---|---|---|---|---|---|---|---|---|
| 2025-08-12 | 13F | Financial Advocates Investment Management | 16,977 | -4.79 | 469 | -3.70 | ||||
| 2025-07-10 | 13F | Redhawk Wealth Advisors, Inc. | 576,569 | -0.89 | 15,925 | 0.27 | ||||
| 2025-08-12 | 13F | Global Retirement Partners, LLC | 85,299 | 306.42 | 2,356 | 311.71 | ||||
| 2025-07-11 | 13F | Bouvel Investment Partners, LLC | 219,457 | 1.42 | 6,061 | 0.63 | ||||
| 2025-07-14 | 13F | McGlone Suttner Wealth Management, Inc. | 16,579 | -5.66 | 458 | -4.59 | ||||
| 2025-08-11 | 13F | Rothschild Investment Llc | 96,350 | 10.94 | 2,661 | 12.23 | ||||
| 2025-07-16 | 13F | Novem Group | 114,748 | 2.79 | 3,169 | 4.00 | ||||
| 2025-08-05 | 13F | Fullcircle Wealth Llc | 130,658 | 3.73 | 3,609 | 5.37 | ||||
| 2025-07-29 | 13F | Signature Estate & Investment Advisors Llc | 28,749 | 794 | ||||||
| 2025-07-02 | 13F | Crumly & Associates Inc. | 203,641 | 9.28 | 5,625 | 10.56 | ||||
| 2025-07-18 | 13F | Cooper Financial Group | 12,894 | 1.41 | 356 | 2.59 | ||||
| 2025-08-11 | 13F | Private Advisor Group, LLC | 486,797 | -6.24 | 13,445 | -5.14 | ||||
| 2025-05-12 | 13F | Fmr Llc | 0 | -100.00 | 0 | |||||
| 2025-08-11 | 13F | Hexagon Capital Partners LLC | 0 | -100.00 | 0 | |||||
| 2025-08-14 | 13F | UBS Group AG | 2,362,552 | 11.62 | 65,254 | 12.92 | ||||
| 2025-07-23 | 13F | Cannon Wealth Management Services, LLC | 35,257 | -3.01 | 974 | -0.82 | ||||
| 2025-07-11 | 13F | Bond & Devick Financial Network, Inc. | 237,164 | 3.14 | 6,550 | 4.35 | ||||
| 2025-07-22 | 13F | Wealthcare Advisory Partners LLC | 22,884 | 4.46 | 632 | 5.69 | ||||
| 2025-07-29 | 13F | Koshinski Asset Management, Inc. | 40,026 | 4.52 | 1,106 | 5.74 | ||||
| 2025-08-11 | 13F | Principal Securities, Inc. | 23,623 | 59.25 | 652 | 61.39 | ||||
| 2025-07-25 | 13F | Envestnet Portfolio Solutions, Inc. | 49,223 | -67.98 | 1,360 | -67.61 | ||||
| 2025-08-12 | 13F | Jpmorgan Chase & Co | 90,195 | 0.02 | 2,491 | 1.22 | ||||
| 2025-07-23 | 13F | WESPAC Advisors, LLC | 32,239 | 15.51 | 890 | 16.95 | ||||
| 2025-07-16 | 13F | Strategic Investment Solutions, Inc. /IL | 6,472 | 0.00 | 179 | 1.14 | ||||
| 2025-07-29 | 13F | Burford Brothers, Inc. | 33,930 | -3.38 | 937 | -2.19 | ||||
| 2025-08-15 | 13F | Morgan Stanley | 5,604,101 | -5.85 | 154,785 | -4.74 | ||||
| 2025-07-22 | 13F | Merit Financial Group, LLC | 148,581 | 197.78 | 4,104 | 201.25 | ||||
| 2025-04-25 | 13F | Avidian Wealth Solutions, LLC | 0 | -100.00 | 0 | |||||
| 2025-08-12 | 13F | Lodestone Wealth Management LLC | 75,951 | 0.81 | 2,098 | 1.99 | ||||
| 2025-08-13 | 13F | Beacon Pointe Advisors, LLC | 428,134 | 11,825 | ||||||
| 2025-08-11 | 13F | Advisor Resource Council | 0 | -100.00 | 0 | |||||
| 2025-07-11 | 13F | Capital Advantage, Inc. | 2,108,316 | 58,232 | ||||||
| 2025-07-28 | 13F | Sagespring Wealth Partners, Llc | 7,400 | 204 | ||||||
| 2025-08-11 | 13F | Perennial Investment Advisors, LLC | 82,144 | 58.25 | 2,269 | 60.06 | ||||
| 2025-07-29 | 13F | Balboa Wealth Partners | 12,024 | 22.05 | 332 | 23.88 | ||||
| 2025-08-04 | 13F | Arkadios Wealth Advisors | 13,052 | 8.01 | 360 | 9.42 | ||||
| 2025-08-14 | 13F | GWM Advisors LLC | 148,965 | 85.09 | 4,114 | 87.26 | ||||
| 2025-07-22 | 13F | DAVENPORT & Co LLC | 114,237 | 7.55 | 3,155 | 8.83 | ||||
| 2025-08-12 | 13F | NWF Advisory Services Inc. | 178,762 | 4,880 | ||||||
| 2025-07-17 | 13F | KWB Wealth | 100,577 | -40.62 | 2,746 | -40.58 | ||||
| 2025-07-21 | 13F | Capital Planning LLC | 0 | -100.00 | 0 | |||||
| 2025-08-12 | 13F | AlphaCore Capital LLC | 40,380 | -0.22 | 1,115 | 1.00 | ||||
| 2025-08-14 | 13F | Clg Llc | 47,423 | 7.38 | 1,310 | 8.63 | ||||
| 2025-08-14 | 13F | Royal Bank Of Canada | 871,108 | 13.94 | 24,060 | 15.28 | ||||
| 2025-05-08 | 13F | HHM Wealth Advisors, LLC | 0 | -100.00 | 0 | |||||
| 2025-08-14 | 13F | Gotham Asset Management, LLC | 29,430 | 813 | ||||||
| 2025-08-14 | 13F | Wiley Bros.-aintree Capital, Llc | 200,142 | 56.53 | 5,543 | 58.46 | ||||
| 2025-07-10 | 13F | Kmg Fiduciary Partners, Llc | 355,666 | 11.76 | 9,824 | 13.06 | ||||
| 2025-08-08 | 13F | Kingsview Wealth Management, LLC | 251,692 | 19.90 | 6,952 | 21.31 | ||||
| 2025-04-21 | 13F | Ronald Blue Trust, Inc. | 0 | -100.00 | 0 | -100.00 | ||||
| 2025-07-14 | 13F | Main Line Retirement Advisors, LLC | 312,403 | 4.52 | 8,629 | 5.75 | ||||
| 2025-07-25 | 13F | Atria Wealth Solutions, Inc. | 354,998 | -33.64 | 9,806 | -33.14 | ||||
| 2025-07-30 | 13F | TFB Advisors LLC | 7,502 | 207 | ||||||
| 2025-07-31 | 13F | Trademark Financial Management, LLC | 8,419 | -48.34 | 233 | -47.75 | ||||
| 2025-08-18 | 13F/A | Kestra Investment Management, LLC | 59,114 | 20.92 | 1,633 | 22.34 | ||||
| 2025-08-11 | 13F | Aptus Capital Advisors, LLC | 3,223 | 1.42 | 89 | 3.49 | ||||
| 2025-07-31 | 13F | CAP Partners, LLC | 22,091 | 2.24 | 610 | 3.57 | ||||
| 2025-08-14 | 13F | Great Valley Advisor Group, Inc. | 2,150,804 | 4.87 | 59,406 | 6.10 | ||||
| 2025-08-27 | 13F/A | Brinker Capital Investments, LLC | 34,432 | 53.17 | 951 | 55.14 | ||||
| 2025-08-04 | 13F | Bridgewealth Advisory Group, LLC | 17,007 | 470 | ||||||
| 2025-07-21 | 13F | Patriot Financial Group Insurance Agency, LLC | 107,461 | 1.97 | 2,968 | 3.16 | ||||
| 2025-07-21 | 13F | Investment Planning Advisors, Inc. | 17,838 | -34.91 | 493 | -34.22 | ||||
| 2025-08-14 | 13F | Goldman Sachs Group Inc | 331,757 | 9,163 | ||||||
| 2025-04-21 | 13F | Bay Colony Advisory Group, Inc d/b/a Bay Colony Advisors | 0 | -100.00 | 0 | -100.00 | ||||
| 2025-07-16 | 13F | Midwest Heritage Bank, FSB | 10,871 | 34.16 | 300 | 35.75 | ||||
| 2025-08-11 | 13F | Synergy Investment Management, LLC | 0 | -100.00 | 0 | |||||
| 2025-08-11 | 13F | Western Wealth Management, LLC | 7,628 | -0.27 | 211 | 0.96 | ||||
| 2025-08-12 | 13F | Wayfinding Financial, LLC | 105,248 | -1.52 | 3 | 0.00 | ||||
| 2025-08-13 | 13F | Baird Financial Group, Inc. | 689,032 | 1.50 | 19,031 | 2.69 | ||||
| 2025-07-07 | 13F | Thurston, Springer, Miller, Herd & Titak, Inc. | 5,005 | 88.65 | 138 | 91.67 | ||||
| 2025-08-14 | 13F | Benjamin Edwards Inc | 398,486 | 4.55 | 11,006 | 5.78 | ||||
| 2025-08-06 | 13F | Golden State Wealth Management, LLC | 0 | -100.00 | 0 | -100.00 | ||||
| 2025-08-12 | 13F | Steward Partners Investment Advisory, Llc | 20,444 | 7.76 | 565 | 9.09 | ||||
| 2025-07-23 | 13F | Clear Creek Financial Management, LLC | 13,122 | -0.76 | 362 | 0.56 | ||||
| 2025-07-24 | 13F | IFP Advisors, Inc | 4,091 | 38.26 | 113 | 41.25 | ||||
| 2025-08-14 | 13F | Raymond James Financial Inc | 3,978,724 | -0.66 | 109,892 | 0.50 | ||||
| 2025-08-14 | 13F | Sunbelt Securities, Inc. | 237,062 | -9.91 | 6,467 | -9.97 | ||||
| 2025-08-12 | 13F | Marshall & Sterling Wealth Advisors Inc. | 584 | 12.09 | 16 | 14.29 | ||||
| 2025-08-05 | 13F | Mission Wealth Management, Lp | 70,190 | 28.90 | 1,939 | 30.42 | ||||
| 2025-08-14 | 13F | Jane Street Group, Llc | 118,193 | -80.05 | 3,264 | -79.82 | ||||
| 2025-07-16 | 13F | St Germain D J Co Inc | 347,002 | 0.77 | 9,584 | 1.95 | ||||
| 2025-07-24 | 13F | MSH Capital Advisors LLC | 17,791 | 35.46 | 491 | 37.15 | ||||
| 2025-08-14 | 13F | Mariner, LLC | 741,908 | 2.65 | 20,491 | 3.86 | ||||
| 2025-08-08 | 13F | Cetera Investment Advisers | 2,690,563 | 18.97 | 74,313 | 20.37 | ||||
| 2025-08-12 | 13F | J.w. Cole Advisors, Inc. | 36,137 | 8.00 | 998 | 9.31 | ||||
| 2025-08-08 | 13F | Security Financial Services, INC. | 7,471 | 206 | ||||||
| 2025-07-10 | 13F | Wealth Enhancement Advisory Services, Llc | 1,825,546 | 0.40 | 50,403 | 1.54 | ||||
| 2025-07-18 | 13F | Trilogy Capital Inc. | 58,706 | 3.04 | 1,621 | 4.24 | ||||
| 2025-07-16 | 13F | Freestate Advisors LLC | 10,068 | 278 | ||||||
| 2025-08-14 | 13F | Susquehanna International Group, Llp | 56,107 | 1,550 | ||||||
| 2025-08-13 | 13F | Continuum Advisory, LLC | 16,348 | 9.17 | 452 | 10.54 | ||||
| 2025-08-06 | 13F | Prospera Financial Services Inc | 525,656 | -0.67 | 14,519 | 0.50 | ||||
| 2025-08-14 | 13F | Bank Of America Corp /de/ | 0 | -100.00 | 0 | |||||
| 2025-05-09 | 13F | GeoWealth Management, LLC | 0 | -100.00 | 0 | |||||
| 2025-08-13 | 13F | Milestone Investment Advisors LLC | 22,976 | -11.13 | 635 | -10.07 | ||||
| 2025-07-11 | 13F | Farther Finance Advisors, LLC | 8,244 | 174.80 | 228 | 180.25 | ||||
| 2025-08-13 | 13F | Level Four Advisory Services, Llc | 147,583 | 24.98 | 4,076 | 26.47 | ||||
| 2025-07-17 | 13F | Janney Montgomery Scott LLC | 145,898 | 19.74 | 4 | 33.33 | ||||
| 2025-08-05 | 13F | Bank of New York Mellon Corp | 8,032 | 222 | ||||||
| 2025-08-12 | 13F | Calton & Associates, Inc. | 26,589 | 22.07 | 734 | 23.57 | ||||
| 2025-07-23 | 13F | Element Wealth, LLC | 50,022 | 18.45 | 1,382 | 19.88 | ||||
| 2025-08-14 | 13F | Old Mission Capital Llc | 37,367 | -77.84 | 1,032 | -77.58 | ||||
| 2025-08-05 | 13F | Aurdan Capital Management, LLC | 17,571 | 4.75 | 485 | 6.13 | ||||
| 2025-07-21 | 13F | Ameritas Advisory Services, LLC | 42,157 | -7.93 | 1,164 | -6.81 | ||||
| 2025-07-28 | 13F | Rosenberg Matthew Hamilton | 825 | 1,061.97 | 23 | 2,100.00 | ||||
| 2025-08-18 | 13F | Wellington Capital Management, Inc. | 74,041 | 1 | ||||||
| 2025-07-31 | 13F | Cambridge Investment Research Advisors, Inc. | 1,332,030 | 14.62 | 37 | 16.13 | ||||
| 2025-05-12 | 13F | Founders Financial Securities Llc | 0 | -100.00 | 0 | |||||
| 2025-08-15 | 13F | Equitable Holdings, Inc. | 113,391 | 37.70 | 3,132 | 39.28 | ||||
| 2025-08-13 | 13F | Capital Group Private Client Services, Inc. | 407,629 | 391.42 | 11,259 | 397.26 | ||||
| 2025-07-14 | 13F | AdvisorNet Financial, Inc | 4,551 | 67.62 | 126 | 68.92 | ||||
| 2025-07-24 | 13F | Von Berge Wealth Management Group, LLC | 63,478 | 44.27 | 1,756 | 47.48 | ||||
| 2025-08-08 | 13F | Larson Financial Group LLC | 5,727 | 118.50 | 158 | 122.54 | ||||
| 2025-08-13 | 13F | Capital Analysts, Inc. | 1,835 | 0 | ||||||
| 2025-07-16 | 13F | Swisher Financial Concepts, Inc. | 220,873 | -2.59 | 6,101 | -1.45 | ||||
| 2025-04-23 | 13F | VisionPoint Advisory Group, LLC | 0 | -100.00 | 0 | |||||
| 2025-08-14 | 13F | Wells Fargo & Company/mn | 2,779,290 | 13.13 | 76,764 | 14.46 | ||||
| 2025-08-04 | 13F | Creekmur Asset Management LLC | 266,691 | 7,366 | ||||||
| 2025-08-14 | 13F | IHT Wealth Management, LLC | 8,332 | 230 | ||||||
| 2025-07-17 | 13F | LifeGoal Wealth Advisors | 36,160 | -74.56 | 999 | -74.28 | ||||
| 2025-05-02 | 13F | Capital A Wealth Management, LLC | 834 | -7.44 | 23 | -8.33 | ||||
| 2025-08-05 | 13F | 5T Wealth, LLC | 75,557 | -1.14 | 2,087 | 0.00 | ||||
| 2025-07-09 | 13F | Pines Wealth Management, LLC | 28,921 | 20.73 | 799 | 26.47 | ||||
| 2025-07-28 | 13F | Eq Wealth Advisors, Llc | 483,678 | 13.86 | 13,359 | 15.20 | ||||
| 2025-08-12 | 13F | LPL Financial LLC | 9,943,155 | 21.63 | 274,630 | 23.05 | ||||
| 2025-07-10 | 13F | Sharkey, Howes & Javer | 60,723 | -25.12 | 1,677 | -24.22 | ||||
| 2025-08-06 | 13F | Blue Investment Partners LLC | 0 | -100.00 | 0 | |||||
| 2025-08-14 | 13F | Integrated Wealth Concepts LLC | 204,377 | 8.93 | 5,645 | 10.19 | ||||
| 2025-07-31 | 13F | Turning Point Benefit Group, Inc. | 107,849 | -19.00 | 2,979 | -15.83 | ||||
| 2025-08-04 | 13F | IFG Advisory, LLC | 15,213 | 84.29 | 420 | 86.67 | ||||
| 2025-07-07 | 13F | TruWealth Advisors, LLC | 697,947 | 14.22 | 19,277 | 15.56 | ||||
| 2025-07-25 | 13F | Concurrent Investment Advisors, LLC | 188,553 | 21.57 | 5,208 | 22.98 | ||||
| 2025-08-04 | 13F | Creative Financial Designs Inc /adv | 239,126 | -28.67 | 6,605 | -27.84 | ||||
| 2025-08-14 | 13F | Gerber Kawasaki Wealth & Investment Management | 10,494 | -22.35 | 290 | -21.47 | ||||
| 2025-08-14 | 13F | Federation des caisses Desjardins du Quebec | 700 | -72.00 | 19 | -72.06 | ||||
| 2025-08-13 | 13F | Flow Traders U.s. Llc | 0 | -100.00 | 0 | |||||
| 2025-08-04 | 13F | Impact Partnership Wealth, LLC | 18,676 | 516 | ||||||
| 2025-07-16 | 13F | ORG Partners LLC | 7,610 | 409.37 | 210 | 425.00 | ||||
| 2025-07-29 | 13F | Stephens Inc /ar/ | 643,841 | 8.66 | 17,783 | 9.94 | ||||
| 2025-08-14 | 13F | Modern Wealth Management, LLC | 13,250 | 14.64 | 366 | 15.87 | ||||
| 2025-08-12 | 13F | Proequities, Inc. | 0 | 0 | ||||||
| 2025-07-30 | 13F | Financial Perspectives, Inc | 1,853 | 59.60 | 51 | 64.52 | ||||
| 2025-09-04 | 13F/A | Advisor Group Holdings, Inc. | 1,768,762 | 30.24 | 48,855 | 31.77 | ||||
| 2025-07-17 | 13F | Venture Visionary Partners LLC | 12,612 | 348 | ||||||
| 2025-07-21 | 13F | DHJJ Financial Advisors, Ltd. | 70 | 0.00 | 2 | 0.00 | ||||
| 2025-07-09 | 13F | WealthCare Investment Partners, LLC | 20,287 | -2.77 | 560 | 0.72 | ||||
| 2025-07-23 | 13F | Seamount Financial Group Inc | 58,366 | 4.03 | 1,612 | 5.29 | ||||
| 2025-07-11 | 13F | AA Financial Advisors, LLC | 9,906 | 0.00 | 274 | 1.11 | ||||
| 2025-07-31 | 13F | Moloney Securities Asset Management, LLC | 10,960 | -63.35 | 303 | -62.99 | ||||
| 2025-08-07 | 13F | Winch Advisory Services, LLC | 741,436 | 1.17 | 20,478 | 2.35 | ||||
| 2025-07-30 | 13F | Onyx Bridge Wealth Group LLC | 389,717 | 87.31 | 10,764 | 89.49 | ||||
| 2025-07-24 | 13F | Us Bancorp \de\ | 5,229 | 0.00 | 144 | 1.41 | ||||
| 2025-07-23 | 13F | Prime Capital Investment Advisors, LLC | 43,800 | -53.93 | 1,210 | -53.41 | ||||
| 2025-08-15 | 13F | Kestra Advisory Services, LLC | 360,665 | 20.05 | 9,962 | 21.46 | ||||
| 2025-08-14 | 13F | Colony Group, LLC | 36,019 | -6.20 | 995 | -5.15 | ||||
| 2025-07-24 | 13F | MFA Wealth Services | 69,744 | 4.63 | 1,926 | 5.88 | ||||
| 2025-08-14 | 13F | Citadel Advisors Llc | 66,928 | -72.54 | 1,849 | -72.23 | ||||
| 2025-08-01 | 13F | Rossby Financial, LCC | 478 | 13 | ||||||
| 2025-08-04 | 13F | Atria Investments Llc | 418,117 | -10.40 | 11,548 | -9.35 | ||||
| 2025-08-11 | 13F | Inspire Advisors, LLC | 57,332 | 1.96 | 1,584 | 3.13 | ||||
| 2025-07-22 | 13F | Oak Hill Wealth Advisors, Llc | 51,123 | 1,406 | ||||||
| 2025-07-17 | 13F | Tempus Wealth Planning, LLC | 24,845 | 1.76 | 686 | 3.00 | ||||
| 2025-07-11 | 13F | LongView Wealth Management | 84,352 | 26.45 | 2,330 | 27.90 | ||||
| 2025-05-15 | 13F | MAI Capital Management | 0 | -100.00 | 0 | |||||
| 2025-07-14 | 13F | Armstrong Advisory Group, Inc | 0 | -100.00 | 0 | |||||
| 2025-08-15 | 13F | Lantern Wealth Advisors, LLC | 10,059 | 278 | ||||||
| 2025-07-30 | 13F | Eqis Capital Management, Inc. | 0 | -100.00 | 0 | |||||
| 2025-08-13 | 13F | RPg Family Wealth Advisory, LLC | 140,717 | 3,887 | ||||||
| 2025-08-18 | 13F | Geneos Wealth Management Inc. | 22,070 | 43.08 | 610 | 44.66 | ||||
| 2025-08-12 | 13F | Barnes Pettey Financial Advisors, Llc | 16,250 | 16.05 | 449 | 17.28 | ||||
| 2025-07-30 | 13F | Klingman & Associates, LLC | 12,381 | 0.00 | 342 | 0.89 | ||||
| 2025-08-12 | 13F | Wealth Advisors of Iowa, LLC | 16,918 | -16.47 | 467 | -15.40 | ||||
| 2025-08-14 | 13F | Mercer Global Advisors Inc /adv | 14,646 | -69.58 | 405 | -69.25 | ||||
| 2025-08-12 | 13F | BlueStem Wealth Partners, LLC | 747,841 | 6.05 | 20,655 | 7.30 | ||||
| 2025-07-09 | 13F | Dynamic Advisor Solutions LLC | 141,617 | 12.10 | 3,911 | 13.43 | ||||
| 2025-07-29 | 13F | Carmel Capital Partners, LLC | 215,493 | 8.74 | 5,952 | 10.02 | ||||
| 2025-07-25 | 13F | Apollon Wealth Management, LLC | 55,424 | -6.50 | 1,531 | -5.44 | ||||
| 2025-08-08 | 13F | Thoroughbred Financial Services, Llc | 38,744 | -19.17 | 1 | 0.00 | ||||
| 2025-08-15 | 13F | Captrust Financial Advisors | 52,367 | 0.51 | 1,446 | 1.69 | ||||
| 2025-07-15 | 13F | Hartmann Taylor Wealth Management, LLC | 89,293 | -35.08 | 2,466 | -34.31 | ||||
| 2025-08-13 | 13F | Renaissance Technologies Llc | 177,100 | 56.25 | 4,892 | 58.08 | ||||
| 2025-08-04 | 13F | Spire Wealth Management | 13,870 | 0.27 | 383 | 1.59 | ||||
| 2025-07-15 | 13F | Regatta Capital Group, Llc | 10,245 | 283 | ||||||
| 2025-08-07 | 13F | Kestra Private Wealth Services, Llc | 18,169 | -16.00 | 502 | -15.08 | ||||
| 2025-07-22 | 13F | Beacon Financial Advisory LLC | 11,150 | 0.70 | 308 | 1.66 | ||||
| 2025-07-03 | 13F | TrueWealth Advisors, LLC | 779,709 | 6.32 | 21,536 | 7.57 | ||||
| 2025-08-07 | 13F | PFG Advisors | 30,400 | 1.64 | 840 | 2.82 | ||||
| 2025-08-12 | 13F | Tradition Wealth Management, LLC | 11,400 | -0.87 | 315 | 0.32 | ||||
| 2025-08-14 | 13F/A | Rockefeller Capital Management L.P. | 288,712 | 7,974 | ||||||
| 2025-08-11 | 13F | HighTower Advisors, LLC | 17,001 | 52.01 | 470 | 53.77 | ||||
| 2025-08-13 | 13F | Strategic Family Wealth Counselors, L.L.C. | 183,258 | 17.43 | 5,062 | 18.80 | ||||
| 2025-08-06 | 13F | Souders Financial Advisors | 332,556 | 6.79 | 9,185 | 8.05 | ||||
| 2025-07-11 | 13F | SILVER OAK SECURITIES, Inc | 177,141 | 4.95 | 4,893 | 6.16 | ||||
| 2025-08-01 | 13F | Brookwood Investment Group LLC | 14,070 | 1.04 | 389 | 2.11 | ||||
| 2025-04-22 | 13F | RFP Financial Group LLC | 0 | -100.00 | 0 | |||||
| 2025-07-29 | 13F | DeDora Capital, Inc. | 43,161 | -90.54 | 1,192 | -90.43 | ||||
| 2025-07-28 | 13F | RFG Advisory, LLC | 10,106 | -71.09 | 279 | -70.75 | ||||
| 2025-07-28 | 13F | Harbour Investments, Inc. | 271,768 | 4.41 | 7,506 | 5.63 | ||||
| 2025-07-22 | 13F | Olistico Wealth, LLC | 1,947 | 18.86 | 54 | 20.45 | ||||
| 2025-07-30 | 13F | Cullen/frost Bankers, Inc. | 121,889 | 28.84 | 3,367 | 30.36 | ||||
| 2025-08-11 | 13F | Nations Financial Group Inc, /ia/ /adv | 33,465 | 7.83 | 924 | 9.09 | ||||
| 2025-07-25 | 13F | Transcendent Capital Group LLC | 69,788 | 3.25 | 1,928 | 4.44 | ||||
| 2025-07-14 | 13F | Opal Wealth Advisors, LLC | 7,336 | 0.81 | 203 | 2.02 | ||||
| 2025-08-04 | 13F | Pensionmark Financial Group, Llc | 18,189 | 17.05 | 502 | 18.40 | ||||
| 2025-08-13 | 13F | Capital International Investors | 122,892 | 33.73 | 3,394 | 35.33 | ||||
| 2025-08-14 | 13F | CoreCap Advisors, LLC | 6,779 | -87.27 | 187 | -87.13 | ||||
| 2025-05-12 | 13F | Independent Advisor Alliance | 0 | -100.00 | 0 | |||||
| 2025-08-05 | 13F | GPS Wealth Strategies Group, LLC | 14,990 | -1.64 | 414 | -0.48 | ||||
| 2025-08-12 | 13F | OneAscent Financial Services LLC | 104,656 | -22.38 | 3 | -33.33 | ||||
| 2025-08-04 | 13F | Integrity Alliance, Llc. | 0 | -100.00 | 0 | |||||
| 2025-08-13 | 13F | Argyle Capital Partners, LLC | 28,240 | 29.00 | 780 | 30.49 | ||||
| 2025-08-14 | 13F | Comerica Bank | 15,348 | 23.36 | 424 | 24.78 | ||||
| 2025-08-14 | 13F | Smartleaf Asset Management LLC | 424,123 | 7.88 | 11,663 | 8.66 | ||||
| 2025-07-23 | 13F | Valmark Advisers, Inc. | 514,219 | 13.85 | 14,203 | 15.19 | ||||
| 2025-08-14 | 13F | Keystone Financial Services, LLC | 113,482 | 4.40 | 3,134 | 5.63 | ||||
| 2025-07-30 | 13F | Bleakley Financial Group, LLC | 10,325 | -15.18 | 285 | -14.16 | ||||
| 2025-08-05 | 13F | Bank Of Montreal /can/ | 9,300 | 18.47 | 257 | 19.63 | ||||
| 2025-07-08 | 13F | Nbc Securities, Inc. | 1,230 | 0.00 | 0 | |||||
| 2025-08-04 | 13F | Assetmark, Inc | 256,056 | 5,070.76 | 7,072 | 5,138.52 | ||||
| 2025-07-14 | 13F | Oliver Luxxe Assets LLC | 0 | -100.00 | 0 | |||||
| 2025-08-04 | 13F | Waterfront Wealth Inc. | 26,632 | -0.07 | 736 | 1.10 | ||||
| 2025-08-06 | 13F | Commonwealth Equity Services, Llc | 2,400,798 | 13.21 | 66 | 15.79 | ||||
| 2025-08-06 | 13F | Financial Advisory Corp /ut/ /adv | 52,720 | 5.94 | 1 | 0.00 | ||||
| 2025-08-14 | 13F | Betterment LLC | 320,413 | 1.06 | 9 | 0.00 | ||||
| 2025-08-01 | 13F | Schmidt P J Investment Management Inc | 29,217 | -0.28 | 807 | 0.88 | ||||
| 2025-07-16 | 13F | Owen LaRue, LLC | 33,775 | -1.42 | 933 | -0.32 | ||||
| 2025-08-14 | 13F | Mml Investors Services, Llc | 893,794 | 18.60 | 25 | 20.00 | ||||
| 2025-08-08 | 13F | Good Life Advisors, LLC | 21,898 | -27.21 | 605 | -26.43 | ||||
| 2025-08-19 | 13F | Cape Investment Advisory, Inc. | 503 | 14 | ||||||
| 2025-07-10 | 13F | Sovran Advisors, LLC | 35,353 | -30.58 | 972 | -28.63 | ||||
| 2025-07-31 | 13F | Richards, Merrill & Peterson, Inc. | 46,804 | 43.82 | 1,293 | 45.50 | ||||
| 2025-05-15 | 13F/A | Orion Portfolio Solutions, LLC | 22,480 | 63.42 | 614 | 63.47 | ||||
| 2025-07-11 | 13F | Skyline Advisors, Inc. | 481,421 | 1.77 | 13,297 | 2.96 | ||||
| 2025-07-29 | 13F | Uhlmann Price Securities, Llc | 22,637 | 93.48 | 625 | 95.92 | ||||
| 2025-08-13 | 13F | EverSource Wealth Advisors, LLC | 11,284 | 312 | ||||||
| 2025-08-14 | 13F | Herold Advisors, Inc. | 10,059 | 278 | ||||||
| 2025-05-16 | 13F | American Trust | 0 | -100.00 | 0 | -100.00 | ||||
| 2025-07-14 | 13F | Sowell Financial Services LLC | 112,270 | 140.56 | 3,101 | 143.33 | ||||
| 2025-08-06 | 13F | Wedbush Securities Inc | 32,957 | 13.96 | 1 | |||||
| 2025-07-07 | 13F | Peterson Wealth Advisors, LLC | 25,514 | -1.82 | 705 | 2.03 | ||||
| 2025-07-18 | 13F | Truist Financial Corp | 67,256 | 36.99 | 1,831 | 36.64 | ||||
| 2025-07-22 | 13F | Confluence Wealth Services, Inc. | 216,749 | 0.16 | 5,987 | 3.06 | ||||
| 2025-08-14 | 13F | Ausdal Financial Partners, Inc. | 49,114 | 0.62 | 1,357 | 1.80 | ||||
| 2025-07-25 | 13F | M.e. Allison & Co., Inc. | 25,880 | 71.93 | 715 | 74.15 | ||||
| 2025-08-13 | 13F | Jones Financial Companies Lllp | 840,932 | 18.62 | 23,126 | 19.48 | ||||
| 2025-07-17 | 13F | Centennial Wealth Advisory LLC | 146,061 | 145.86 | 4,030 | 148.55 | ||||
| 2025-07-25 | 13F | Cwm, Llc | 929,285 | 441.89 | 26 | 525.00 | ||||
| 2025-08-12 | 13F | Insigneo Advisory Services, Llc | 10,723 | 0.00 | 296 | 1.37 | ||||
| 2025-08-12 | 13F | Entruity Wealth, LLC | 184,650 | 11.43 | 5,100 | 12.76 | ||||
| 2025-08-14 | 13F | Stifel Financial Corp | 1,240,773 | 25.22 | 34,270 | 26.68 | ||||
| 2025-08-04 | 13F | Cottage Street Advisors LLC | 42,928 | 1.39 | 1,186 | 2.60 | ||||
| 2025-08-13 | 13F | VestGen Advisors, LLC | 302,078 | -0.19 | 8,343 | 0.98 | ||||
| 2025-07-30 | 13F | D.a. Davidson & Co. | 193,473 | 9.08 | 5,344 | 10.35 | ||||
| 2025-08-12 | 13F | SRS Capital Advisors, Inc. | 1,723 | 54.81 | 48 | 56.67 | ||||
| 2025-07-29 | 13F | Stratos Wealth Partners, LTD. | 42,904 | 1,185 | ||||||
| 2025-07-17 | 13F | LexAurum Advisors, LLC | 11,342 | 11.27 | 313 | 12.59 | ||||
| 2025-08-05 | 13F | Sigma Planning Corp | 19,002 | -1.92 | 525 | -0.76 | ||||
| 2025-07-17 | 13F | Johnson Bixby & Associates, LLC | 0 | -100.00 | 0 | |||||
| 2025-07-28 | 13F | Mutual Advisors, LLC | 11,590 | -55.10 | 321 | -54.35 | ||||
| 2025-07-29 | 13F | Private Trust Co Na | 42,543 | 0.00 | 1,175 | 1.21 | ||||
| 2025-05-15 | 13F | Advisory Services Network, LLC | 0 | -100.00 | 0 | |||||
| 2025-07-10 | 13F | SK Wealth Management, LLC | 44,929 | 14.85 | 1,240 | 18.79 | ||||
| 2025-08-04 | 13F | Daymark Wealth Partners, Llc | 28,267 | -2.04 | 781 | -0.89 | ||||
| 2025-08-13 | 13F | Gateway Wealth Partners, LLC | 22,482 | 52.47 | 621 | 54.23 | ||||
| 2025-07-09 | 13F | Fiduciary Alliance LLC | 117,756 | 3,252 | ||||||
| 2025-08-06 | 13F | Mascagni Wealth Management, Inc. | 74,162 | 14.05 | 2,048 | 15.38 | ||||
| 2025-08-13 | 13F | Vermillion & White Wealth Management Group, LLC | 3,329 | 6.46 | 92 | 7.06 | ||||
| 2025-07-24 | 13F | Endeavor Private Wealth, Inc. | 56,640 | 31.35 | 1,564 | 32.88 | ||||
| 2025-07-30 | 13F | Brookstone Capital Management | 16,533 | -5.63 | 457 | -4.60 | ||||
| 2025-08-08 | 13F | Avantax Advisory Services, Inc. | 79,125 | 41.60 | 2,185 | 43.28 | ||||
| 2025-08-12 | 13F | Jacobi Capital Management LLC | 78,638 | 1.51 | 2,172 | 2.70 | ||||
| 2025-08-13 | 13F | Forthright Family Wealth Advisory LLC | 114,201 | -1.44 | 3,154 | -0.28 | ||||
| 2025-07-18 | 13F | Vicus Capital | 259,927 | -12.82 | 7,179 | -11.80 | ||||
| 2025-07-25 | 13F | Total Clarity Wealth Management, Inc. | 105,399 | 9.63 | 2,911 | 11.02 | ||||
| 2025-08-08 | 13F | Pnc Financial Services Group, Inc. | 0 | -100.00 | 0 | |||||
| 2025-08-25 | 13F | Fulcrum Equity Management | 0 | -100.00 | 0 | |||||
| 2025-07-10 | 13F | Global Financial Private Client, LLC | 15,607 | 0.00 | 431 | 1.17 | ||||
| 2025-08-12 | 13F | Cornerstone Wealth Management, LLC | 11,329 | 10.35 | 313 | 11.43 | ||||
| 2025-08-13 | 13F | Northwestern Mutual Wealth Management Co | 654,276 | 111.55 | 18,071 | 114.04 | ||||
| 2025-08-08 | 13F | Capital Investment Advisory Services, LLC | 7,080 | 0.00 | 196 | 1.04 | ||||
| 2025-08-14 | 13F | Snowden Capital Advisors LLC | 18,955 | 6.29 | 524 | 7.61 | ||||
| 2025-08-01 | 13F | Envestnet Asset Management Inc | 4,244,651 | 16.71 | 117,237 | 18.08 | ||||
| 2025-07-17 | 13F | Beacon Capital Management, LLC | 94 | 1.08 | 3 | 0.00 | ||||
| 2025-07-01 | 13F | Kera Capital Partners, Inc. | 12,674 | 0.00 | 350 | 1.16 |