Mga Batayang Estadistika
| Pemilik Institusional | 122 total, 122 long only, 0 short only, 0 long/short - change of 4.24% MRQ |
| Alokasi Portofolio Rata-rata | 0.1326 % - change of -0.74% MRQ |
| Saham Institusional (Jangka Panjang) | 5,291,495 (ex 13D/G) - change of -0.05MM shares -1.00% MRQ |
| Nilai Institusional (Jangka Panjang) | $ 326,493 USD ($1000) |
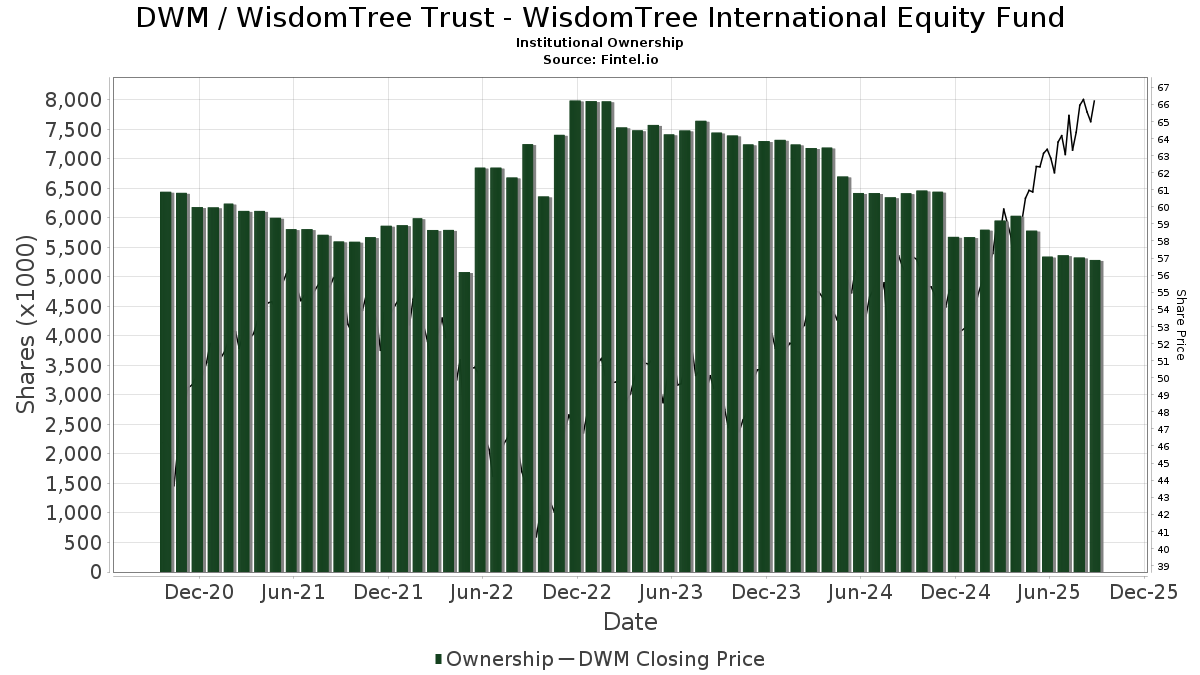
Kepemilikan Institusional dan Pemegang Saham
WisdomTree Trust - WisdomTree International Equity Fund (US:DWM) memiliki 122 pemilik institusional dan pemegang saham yang telah mengajukan formulir 13D/G atau 13F kepada Komisi Bursa Efek (Securities Exchange Commission/SEC). Lembaga-lembaga ini memegang total 5,291,495 saham. Pemegang saham terbesar meliputi Morgan Stanley, LPL Financial LLC, LRI Investments, LLC, Bank Of America Corp /de/, Wells Fargo & Company/mn, Wealth Enhancement Advisory Services, Llc, Valmark Advisers, Inc., UBS Group AG, Kestra Advisory Services, LLC, and Moller Financial Services .
Struktur kepemilikan institusional WisdomTree Trust - WisdomTree International Equity Fund (ARCA:DWM) menunjukkan posisi terkini di perusahaan oleh institusi dan dana, serta perubahan terbaru dalam ukuran posisi. Pemegang saham utama dapat mencakup investor individu, reksa dana, dana lindung nilai, atau institusi. Jadwal 13D menunjukkan bahwa investor memegang (atau pernah memegang) lebih dari 5% saham perusahaan dan bermaksud (atau pernah bermaksud) untuk secara aktif mengejar perubahan strategi bisnis. Jadwal 13G menunjukkan investasi pasif lebih dari 5%.
The share price as of September 2, 2025 is 64.91 / share. Previously, on September 3, 2024, the share price was 56.60 / share. This represents an increase of 14.68% over that period.
Skor Sentimen Dana
Skor Sentimen Dana (sebelumnya dikenal sebagai Skor Akumulasi Kepemilikan) menemukan saham-saham yang paling banyak dibeli oleh dana. Ini adalah hasil dari model kuantitatif multi-faktor yang canggih yang mengidentifikasi perusahaan dengan tingkat akumulasi institusional tertinggi. Model penilaian menggunakan kombinasi dari total peningkatan pemilik yang diungkapkan, perubahan dalam alokasi portofolio pada pemilik tersebut, dan metrik lainnya. Angka berkisar dari 0 hingga 100, dengan angka yang lebih tinggi menunjukkan tingkat akumulasi yang lebih tinggi dibandingkan dengan perusahaan sejenisnya, dan 50 adalah rata-ratanya.
Frekuensi Pembaruan: Setiap Hari
Lihat Ownership Explorer, yang menyediakan daftar perusahaan dengan peringkat tertinggi.
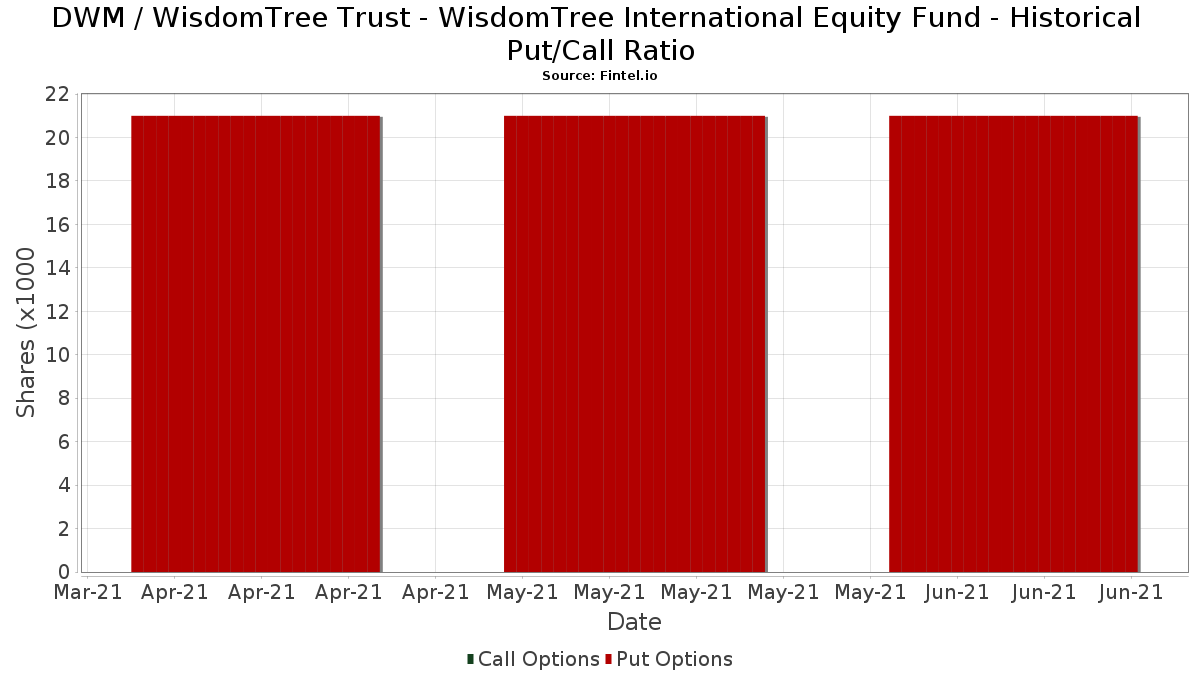
Rasio Put/Call Institusional
Selain melaporkan isu ekuitas dan utang standar, institusi dengan aset di bawah manajemen lebih dari 100 juta dolar AS juga harus mengungkapkan kepemilikan opsi put dan call mereka. Karena opsi put umumnya menunjukkan sentimen negatif, dan opsi call menunjukkan sentimen positif, kita dapat mengetahui sentimen institusional secara keseluruhan dengan memplot rasio put terhadap call. Grafik di sebelah kanan memplot rasio put/call historis untuk instrumen ini.
Menggunakan Rasio Put/Call sebagai indikator sentimen investor mengatasi salah satu kekurangan utama dari penggunaan total kepemilikan institusional, yaitu sejumlah besar aset yang dikelola diinvestasikan secara pasif untuk melacak indeks. Dana yang dikelola secara pasif biasanya tidak membeli opsi, sehingga indikator rasio put/call lebih akurat dalam melacak sentimen dana yang dikelola secara aktif.
Pengajuan 13F dan NPORT
Detail pada pengajuan 13F tersedia gratis. Detail pada pengajuan NP memerlukan keanggotaan premium. Baris berwarna hijau menunjukkan posisi baru. Baris berwarna merah menunjukkan posisi yang sudah ditutup. Klik tautan ini ikon untuk melihat riwayat transaksi selengkapnya.
Tingkatkan
untuk membuka data premium dan mengekspor ke Excel ![]() .
.
| Tanggal File | Sumber | Investor | Ketik | Presyo ng Avg (Silangan) |
Saham | Δ Saham (%) |
Dilaporkan Nilai ($1000) |
Nilai Δ (%) |
Alokasi Port (%) |
|
|---|---|---|---|---|---|---|---|---|---|---|
| 2025-07-25 | 13F | McNamara Financial Services, Inc. | 4,843 | -1.38 | 308 | 7.72 | ||||
| 2025-08-14 | 13F | UBS Group AG | 170,719 | -33.49 | 10,851 | -27.31 | ||||
| 2025-08-11 | 13F | Lowe Brockenbrough & Co Inc | 1 | 0 | ||||||
| 2025-08-04 | 13F | 4wealth Advisors, Inc. | 3,444 | 219 | ||||||
| 2025-08-14 | 13F | CIBC World Markets Inc. | 48,563 | 2.85 | 3,087 | 12.38 | ||||
| 2025-07-10 | 13F | Wealth Enhancement Advisory Services, Llc | 314,751 | -8.02 | 20,073 | 0.87 | ||||
| 2025-07-24 | 13F | Robertson Stephens Wealth Management, LLC | 16,260 | -28.67 | 1,034 | -22.04 | ||||
| 2025-07-28 | 13F | Courier Capital Llc | 26,652 | 1.51 | 1,694 | 11.01 | ||||
| 2025-08-19 | 13F | National Asset Management, Inc. | 17,593 | -9.76 | 1,118 | 8.86 | ||||
| 2025-07-23 | 13F | Viewpoint Capital Management LLC | 4,100 | 0.00 | 261 | 9.24 | ||||
| 2025-08-08 | 13F | ProVise Management Group, LLC | 14,768 | -4.48 | 939 | 4.34 | ||||
| 2025-08-12 | 13F | Steward Partners Investment Advisory, Llc | 9,305 | 0.00 | 591 | 9.24 | ||||
| 2025-08-13 | 13F | Flow Traders U.s. Llc | 53,345 | 219.14 | 3 | |||||
| 2025-07-21 | 13F | Ameritas Advisory Services, LLC | 90 | 6 | ||||||
| 2025-07-17 | 13F | New Perspectives, Inc | 4,175 | 0.00 | 265 | 9.50 | ||||
| 2025-08-12 | 13F/A | Brightwater Advisory LLC | 12,032 | -6.82 | 765 | 1.87 | ||||
| 2025-08-06 | 13F | Wedbush Securities Inc | 4,015 | -5.93 | 0 | |||||
| 2025-08-14 | 13F | Susquehanna International Group, Llp | 0 | -100.00 | 0 | |||||
| 2025-07-08 | 13F | Lowe Wealth Advisors, LLC | 320 | 0.00 | 20 | 11.11 | ||||
| 2025-07-29 | 13F | Kondo Wealth Advisors, Inc. | 17,304 | -4.77 | 1,100 | 4.17 | ||||
| 2025-07-28 | 13F | Arlington Financial Advisors, LLC | 4,887 | 0.00 | 311 | 9.15 | ||||
| 2025-07-08 | 13F | Nbc Securities, Inc. | 2,811 | -12.38 | 0 | |||||
| 2025-07-17 | 13F | Janney Montgomery Scott LLC | 30,354 | 0.85 | 2 | 0.00 | ||||
| 2025-08-08 | 13F | Financial Gravity Companies, Inc. | 246 | 0.00 | 16 | 25.00 | ||||
| 2025-07-22 | 13F | Merit Financial Group, LLC | 46,918 | 38.23 | 2,982 | 51.14 | ||||
| 2025-07-28 | 13F | Harbour Investments, Inc. | 0 | -100.00 | 0 | |||||
| 2025-08-14 | 13F | Colony Group, LLC | 4,874 | 0.00 | 310 | 9.19 | ||||
| 2025-08-08 | 13F | Creative Planning | 27,284 | 0.00 | 1,734 | 9.33 | ||||
| 2025-08-12 | 13F | MAI Capital Management | 1,571 | 0.00 | 100 | 8.79 | ||||
| 2025-08-11 | 13F | Pinnacle Financial Group, LLC / IL | 5,965 | 0.15 | 379 | 9.54 | ||||
| 2025-08-08 | 13F | Thrive Capital Management, LLC | 17,313 | 1,100 | ||||||
| 2025-08-08 | 13F | Cetera Investment Advisers | 63,652 | 30.32 | 4,046 | 42.43 | ||||
| 2025-07-22 | 13F | Plimoth Trust Co Llc | 23,622 | -3.04 | 1,501 | 6.00 | ||||
| 2025-04-29 | 13F | Bank of New York Mellon Corp | 0 | -100.00 | 0 | |||||
| 2025-07-25 | 13F | LRI Investments, LLC | 386,546 | -0.77 | 24,569 | 8.45 | ||||
| 2025-08-15 | 13F | Morgan Stanley | 1,025,785 | -1.90 | 65,199 | 7.22 | ||||
| 2025-07-17 | 13F | Independence Bank of Kentucky | 2,415 | 0.00 | 153 | 9.29 | ||||
| 2025-08-18 | 13F | Geneos Wealth Management Inc. | 26,598 | 0.01 | 1,691 | 9.31 | ||||
| 2025-08-11 | 13F | Pinnacle Wealth Planning Services, Inc. | 22,441 | 1.90 | 1,426 | 11.41 | ||||
| 2025-08-11 | 13F | Culbertson A N & Co Inc | 3,695 | 0.00 | 235 | 9.35 | ||||
| 2025-08-12 | 13F | Shakespeare Wealth Management, Inc. | 29,570 | -29.61 | 1,879 | -23.05 | ||||
| 2025-07-28 | 13F | Essex LLC | 4,300 | 0.00 | 273 | 9.20 | ||||
| 2025-07-24 | 13F | Blair William & Co/il | 2,063 | 1.38 | 131 | 11.02 | ||||
| 2025-08-06 | 13F | Commonwealth Equity Services, Llc | 14,916 | -1.60 | 1 | |||||
| 2025-07-21 | 13F | Cape Ann Savings Bank | 6,794 | 0.00 | 432 | 9.11 | ||||
| 2025-07-29 | 13F | Stratos Wealth Advisors, LLC | 21,312 | 4.78 | 1,355 | 14.55 | ||||
| 2025-08-01 | 13F | Oarsman Capital, Inc. | 13,157 | -12.49 | 836 | -4.35 | ||||
| 2025-08-14 | 13F | GWM Advisors LLC | 66 | 0.00 | 4 | 33.33 | ||||
| 2025-07-22 | 13F | DAVENPORT & Co LLC | 14,414 | -5.36 | 916 | 3.50 | ||||
| 2025-07-25 | 13F | Cwm, Llc | 4,406 | 0.80 | 0 | |||||
| 2025-07-10 | 13F | Kmg Fiduciary Partners, Llc | 12,567 | 10.45 | 799 | 20.73 | ||||
| 2025-08-29 | NP | DNL - WisdomTree Global ex-U.S. Quality Dividend Growth Fund N/A | 652 | -76.55 | 41 | -74.53 | ||||
| 2025-08-11 | 13F | CBIZ Investment Advisory Services, LLC | 0 | -100.00 | 0 | |||||
| 2025-08-14 | 13F | Harwood Advisory Group, LLC | 0 | -100.00 | 0 | -100.00 | ||||
| 2025-08-11 | 13F | WPG Advisers, LLC | 1,101 | -0.99 | 70 | 7.81 | ||||
| 2025-07-21 | 13F | Creative Capital Management Investments LLC | 539 | 0.00 | 34 | 9.68 | ||||
| 2025-08-15 | 13F | Kestra Advisory Services, LLC | 117,768 | 12.08 | 7,485 | 22.50 | ||||
| 2025-07-16 | 13F | Falcon Wealth Planning | 11,642 | 1.00 | 740 | 10.30 | ||||
| 2025-07-09 | 13F | Inspirion Wealth Advisors, Llc | 6,166 | 1.73 | 392 | 11.08 | ||||
| 2025-07-28 | 13F | Frazier Financial Advisors, LLC | 16,383 | 0.22 | 1,041 | 9.58 | ||||
| 2025-08-12 | 13F | Global Retirement Partners, LLC | 66 | 0.00 | 4 | 33.33 | ||||
| 2025-07-22 | 13F | Valley National Advisers Inc | 4,014 | 0.00 | 0 | |||||
| 2025-07-30 | 13F | Bogart Wealth, LLC | 133 | 0.00 | 8 | 14.29 | ||||
| 2025-05-15 | 13F | Citadel Advisors Llc | 0 | -100.00 | 0 | |||||
| 2025-08-11 | 13F | Principal Securities, Inc. | 115 | 0.00 | 7 | 16.67 | ||||
| 2025-08-07 | 13F | Allworth Financial LP | 793 | 50 | ||||||
| 2025-08-14 | 13F | Jane Street Group, Llc | 0 | -100.00 | 0 | |||||
| 2025-08-08 | 13F | Kingsview Wealth Management, LLC | 9,228 | -0.18 | 587 | 9.12 | ||||
| 2025-08-14 | 13F | Royal Bank Of Canada | 19,672 | -0.16 | 1,250 | 9.08 | ||||
| 2025-04-24 | 13F | Philip James Wealth Mangement, LLC | 0 | -100.00 | 0 | |||||
| 2025-07-24 | 13F | Jfs Wealth Advisors, Llc | 74,136 | -1.66 | 4,712 | 7.48 | ||||
| 2025-08-12 | 13F | Pathstone Holdings, LLC | 3,225 | 205 | ||||||
| 2025-08-11 | 13F | Howard Wealth Management, Llc | 5,615 | 0.00 | 357 | 9.20 | ||||
| 2025-07-10 | 13F | Moller Financial Services | 106,914 | -5.17 | 6,795 | 3.65 | ||||
| 2025-08-14 | 13F | Fmr Llc | 2,323 | -4.09 | 148 | 5.00 | ||||
| 2025-08-12 | 13F | Allen Capital Group, LLC | 6,868 | 0.00 | 437 | 9.27 | ||||
| 2025-04-30 | 13F | Sofos Investments, Inc. | 246 | -5.38 | 14 | 7.69 | ||||
| 2025-08-12 | 13F | Proequities, Inc. | 0 | 0 | ||||||
| 2025-08-05 | 13F | NewSquare Capital LLC | 66,324 | 4.53 | 4,216 | 14.26 | ||||
| 2025-08-15 | 13F | Tower Research Capital LLC (TRC) | 1 | 0.00 | 0 | |||||
| 2025-07-17 | 13F | Beacon Capital Management, LLC | 395 | 1.80 | 25 | 13.64 | ||||
| 2025-07-23 | 13F | Litman Gregory Asset Management LLC | 7,000 | 0.00 | 445 | 9.09 | ||||
| 2025-08-08 | 13F | Intrua Financial, LLC | 11,891 | 0.00 | 756 | 9.26 | ||||
| 2025-07-09 | 13F | Beacon Financial Group | 9,732 | -10.34 | 619 | -2.06 | ||||
| 2025-08-14 | 13F | Ameriprise Financial Inc | 3,742 | 238 | ||||||
| 2025-08-04 | 13F | Spire Wealth Management | 0 | -100.00 | 0 | |||||
| 2025-08-11 | 13F | Rothschild Investment Llc | 235 | 0.00 | 15 | 7.69 | ||||
| 2025-08-13 | 13F | Financial Freedom, LLC | 378 | 0.00 | 24 | 14.29 | ||||
| 2025-08-06 | 13F | AE Wealth Management LLC | 428 | 140.45 | 27 | 170.00 | ||||
| 2025-08-14 | 13F | Sei Investments Co | 43,286 | -3.53 | 2,751 | 5.44 | ||||
| 2025-08-12 | 13F | Jpmorgan Chase & Co | 14,142 | -5.80 | 899 | 2.86 | ||||
| 2025-08-14 | 13F | Bank Of America Corp /de/ | 367,152 | 0.51 | 23,336 | 9.86 | ||||
| 2025-08-11 | 13F | Aptus Capital Advisors, LLC | 1,650 | 0.00 | 105 | 9.47 | ||||
| 2025-07-29 | 13F | JTC Employer Solutions Trusteee Ltd | 4,226 | 0.00 | 0 | |||||
| 2025-08-14 | 13F | Ancora Advisors, LLC | 1,000 | 0.00 | 64 | 8.62 | ||||
| 2025-07-23 | 13F | Valmark Advisers, Inc. | 301,119 | -0.17 | 19,139 | 9.10 | ||||
| 2025-08-01 | 13F | Envestnet Asset Management Inc | 44,779 | -8.21 | 2,846 | 0.32 | ||||
| 2025-08-11 | 13F | HighTower Advisors, LLC | 12,139 | 3.14 | 772 | 12.72 | ||||
| 2025-07-16 | 13F | Signaturefd, Llc | 0 | -100.00 | 0 | |||||
| 2025-07-24 | 13F | IFP Advisors, Inc | 508 | 32 | ||||||
| 2025-08-13 | 13F | Twin Peaks Wealth Advisors, LLC | 2,180 | 143 | ||||||
| 2025-07-31 | 13F | Cambridge Investment Research Advisors, Inc. | 18,746 | 5.49 | 1 | 0.00 | ||||
| 2025-08-13 | 13F | Jones Financial Companies Lllp | 6,594 | 0.00 | 418 | 8.57 | ||||
| 2025-08-04 | 13F | HBK Sorce Advisory LLC | 54,765 | -6.94 | 3,481 | 1.69 | ||||
| 2025-08-14 | 13F | Stifel Financial Corp | 15,250 | -2.50 | 969 | 6.60 | ||||
| 2025-08-13 | 13F | EverSource Wealth Advisors, LLC | 325 | 0.00 | 21 | 11.11 | ||||
| 2025-08-06 | 13F | Modera Wealth Management, LLC | 11,879 | 0.00 | 755 | 9.42 | ||||
| 2025-08-12 | 13F | OneAscent Financial Services LLC | 7,531 | 1.21 | 0 | |||||
| 2025-08-12 | 13F | O'shaughnessy Asset Management, Llc | 822 | 0.00 | 52 | 10.64 | ||||
| 2025-08-05 | 13F | Mission Wealth Management, Lp | 58,867 | -3.78 | 3,742 | 5.17 | ||||
| 2025-08-14 | 13F | Raymond James Financial Inc | 84,593 | 1.28 | 5,377 | 10.69 | ||||
| 2025-07-11 | 13F | Trust Co Of Virginia /va | 5,783 | 0.00 | 368 | 9.23 | ||||
| 2025-08-11 | 13F | Tidemark, LLC | 783 | 0.00 | 50 | 8.89 | ||||
| 2025-08-06 | 13F | Regimen Wealth, Llc | 4,470 | 1.75 | 284 | 11.37 | ||||
| 2025-07-10 | 13F | Envision Financial LLC | 53,044 | 1.09 | 3,371 | 10.49 | ||||
| 2025-07-22 | 13F/A | Duncan Williams Asset Management, LLC | 3,274 | 208 | ||||||
| 2025-07-16 | 13F | Octavia Wealth Advisors, LLC | 14,994 | -8.02 | 953 | 0.53 | ||||
| 2025-08-05 | 13F | Huntington National Bank | 168 | 10.60 | ||||||
| 2025-08-14 | 13F | Wells Fargo & Company/mn | 326,088 | 1.11 | 20,726 | 10.51 | ||||
| 2025-08-14 | 13F | Wiley Bros.-aintree Capital, Llc | 24,342 | 0.05 | 1,547 | 8.94 | ||||
| 2025-08-12 | 13F | LPL Financial LLC | 526,732 | 4.16 | 33,479 | 13.85 | ||||
| 2025-08-13 | 13F | Northwestern Mutual Wealth Management Co | 2,041 | -32.82 | 130 | -26.70 | ||||
| 2025-08-14 | 13F | Comerica Bank | 22,381 | -3.15 | 1,423 | 5.88 | ||||
| 2025-08-07 | 13F | Kestra Private Wealth Services, Llc | 4,250 | 270 | ||||||
| 2025-08-05 | 13F | Westside Investment Management, Inc. | 816 | 0.00 | 52 | 8.51 | ||||
| 2025-08-13 | 13F | Tobias Financial Advisors, Inc. | 57,475 | -5.92 | 3,653 | 2.84 | ||||
| 2025-08-05 | 13F | Key FInancial Inc | 53,606 | -1.28 | 3,407 | 7.92 | ||||
| 2025-08-12 | 13F | Howe & Rusling Inc | 0 | -100.00 | 0 | |||||
| 2025-08-11 | 13F | Rockbridge Investment Management, LCC | 5,213 | -1.70 | 331 | 7.47 | ||||
| 2025-08-08 | 13F | Pnc Financial Services Group, Inc. | 6,450 | 0.00 | 410 | 9.07 | ||||
| 2025-07-29 | 13F | Private Trust Co Na | 383 | 0.00 | 24 | 9.09 | ||||
| 2025-08-12 | 13F | New World Advisors LLC | 5,654 | 14.20 | 359 | 25.09 | ||||
| 2025-03-28 | 13F/A | Berkeley, Inc | 0 | -100.00 | 0 | -100.00 | ||||
| 2025-05-14 | 13F | Legacy Financial Advisors, Inc. | 0 | -100.00 | 0 | |||||
| 2025-08-13 | 13F | Advisor Group Holdings, Inc. | 35,416 | 8.62 | 1,875 | -1.16 | ||||
| 2025-07-28 | 13F | Kiker Wealth Management, LLC | 63 | 0.00 | 4 | 33.33 | ||||
| 2025-04-25 | 13F | Smallwood Wealth Investment Management, LLC | 56,137 | 4.63 | 3,265 | 15.46 |