Mga Batayang Estadistika
| Pemilik Institusional | 143 total, 143 long only, 0 short only, 0 long/short - change of 8.96% MRQ |
| Alokasi Portofolio Rata-rata | 0.2414 % - change of -15.72% MRQ |
| Saham Institusional (Jangka Panjang) | 6,734,511 (ex 13D/G) - change of 0.68MM shares 11.18% MRQ |
| Nilai Institusional (Jangka Panjang) | $ 260,910 USD ($1000) |
Kepemilikan Institusional dan Pemegang Saham
SPDR Index Shares Funds - SPDR S&P International Dividend ETF (US:DWX) memiliki 143 pemilik institusional dan pemegang saham yang telah mengajukan formulir 13D/G atau 13F kepada Komisi Bursa Efek (Securities Exchange Commission/SEC). Lembaga-lembaga ini memegang total 6,734,511 saham. Pemegang saham terbesar meliputi Morgan Stanley, Bank Of America Corp /de/, Wells Fargo & Company/mn, UBS Group AG, Columbia River Financial Group, LLC, INKM - SPDR SSGA Income Allocation ETF, Concord Wealth Partners, Concord Asset Management, LLC/VA, Empirical Financial Services, LLC d.b.a. Empirical Wealth Management, and Baker Avenue Asset Management, LP .
Struktur kepemilikan institusional SPDR Index Shares Funds - SPDR S&P International Dividend ETF (ARCA:DWX) menunjukkan posisi terkini di perusahaan oleh institusi dan dana, serta perubahan terbaru dalam ukuran posisi. Pemegang saham utama dapat mencakup investor individu, reksa dana, dana lindung nilai, atau institusi. Jadwal 13D menunjukkan bahwa investor memegang (atau pernah memegang) lebih dari 5% saham perusahaan dan bermaksud (atau pernah bermaksud) untuk secara aktif mengejar perubahan strategi bisnis. Jadwal 13G menunjukkan investasi pasif lebih dari 5%.
The share price as of September 5, 2025 is 43.07 / share. Previously, on September 6, 2024, the share price was 38.51 / share. This represents an increase of 11.84% over that period.

Skor Sentimen Dana
Skor Sentimen Dana (sebelumnya dikenal sebagai Skor Akumulasi Kepemilikan) menemukan saham-saham yang paling banyak dibeli oleh dana. Ini adalah hasil dari model kuantitatif multi-faktor yang canggih yang mengidentifikasi perusahaan dengan tingkat akumulasi institusional tertinggi. Model penilaian menggunakan kombinasi dari total peningkatan pemilik yang diungkapkan, perubahan dalam alokasi portofolio pada pemilik tersebut, dan metrik lainnya. Angka berkisar dari 0 hingga 100, dengan angka yang lebih tinggi menunjukkan tingkat akumulasi yang lebih tinggi dibandingkan dengan perusahaan sejenisnya, dan 50 adalah rata-ratanya.
Frekuensi Pembaruan: Setiap Hari
Lihat Ownership Explorer, yang menyediakan daftar perusahaan dengan peringkat tertinggi.
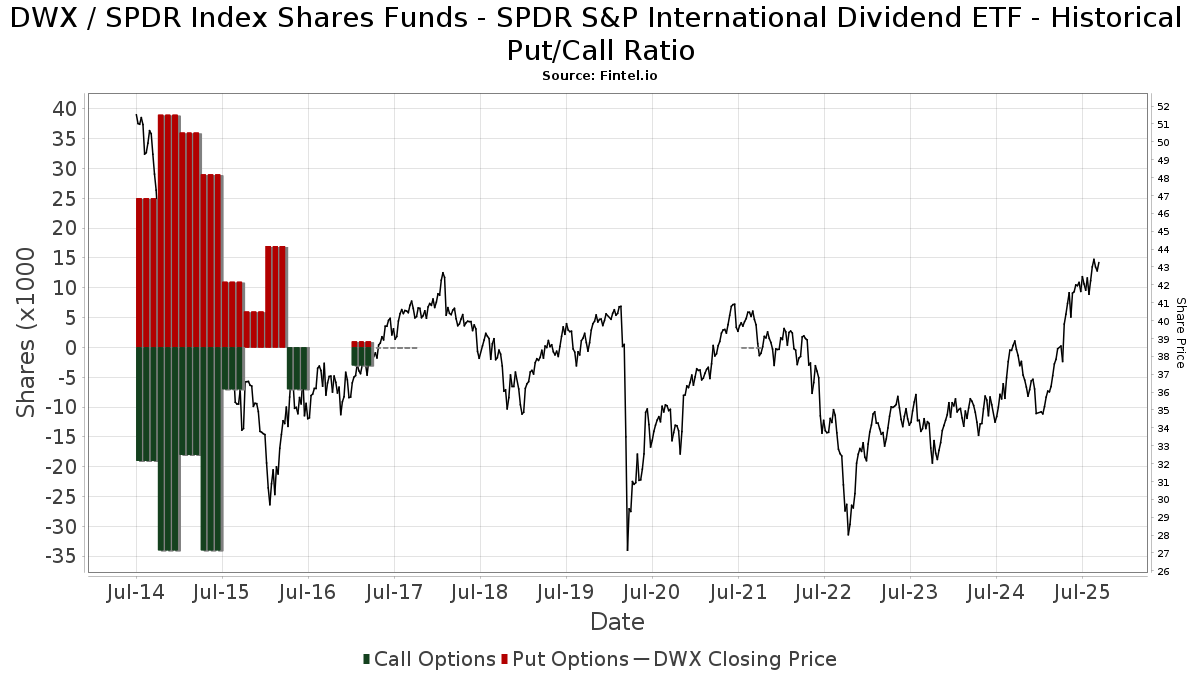
Rasio Put/Call Institusional
Selain melaporkan isu ekuitas dan utang standar, institusi dengan aset di bawah manajemen lebih dari 100 juta dolar AS juga harus mengungkapkan kepemilikan opsi put dan call mereka. Karena opsi put umumnya menunjukkan sentimen negatif, dan opsi call menunjukkan sentimen positif, kita dapat mengetahui sentimen institusional secara keseluruhan dengan memplot rasio put terhadap call. Grafik di sebelah kanan memplot rasio put/call historis untuk instrumen ini.
Menggunakan Rasio Put/Call sebagai indikator sentimen investor mengatasi salah satu kekurangan utama dari penggunaan total kepemilikan institusional, yaitu sejumlah besar aset yang dikelola diinvestasikan secara pasif untuk melacak indeks. Dana yang dikelola secara pasif biasanya tidak membeli opsi, sehingga indikator rasio put/call lebih akurat dalam melacak sentimen dana yang dikelola secara aktif.
Pengajuan 13F dan NPORT
Detail pada pengajuan 13F tersedia gratis. Detail pada pengajuan NP memerlukan keanggotaan premium. Baris berwarna hijau menunjukkan posisi baru. Baris berwarna merah menunjukkan posisi yang sudah ditutup. Klik tautan ini ikon untuk melihat riwayat transaksi selengkapnya.
Tingkatkan
untuk membuka data premium dan mengekspor ke Excel ![]() .
.
| Tanggal File | Sumber | Investor | Ketik | Presyo ng Avg (Silangan) |
Saham | Δ Saham (%) |
Dilaporkan Nilai ($1000) |
Nilai Δ (%) |
Alokasi Port (%) |
|
|---|---|---|---|---|---|---|---|---|---|---|
| 2025-08-14 | 13F | Financial Network Wealth Advisors LLC | 217 | 9 | ||||||
| 2025-07-14 | 13F | Southland Equity Partners LLC | 7,825 | -0.37 | 330 | 9.30 | ||||
| 2025-08-14 | 13F | Royal Bank Of Canada | 95,948 | -9.48 | 4,044 | -0.52 | ||||
| 2025-08-04 | 13F | HBK Sorce Advisory LLC | 18,122 | -9.86 | 764 | -1.04 | ||||
| 2025-05-30 | NP | GPMIX - GuidePath(R) Multi-Asset Income Allocation Fund Service Shares | 43,680 | 5.40 | 1,676 | 15.68 | ||||
| 2025-07-24 | 13F | Brandywine Oak Private Wealth Llc | 23,210 | 0.00 | 978 | 9.89 | ||||
| 2025-07-21 | 13F | Crews Bank & Trust | 2,735 | 0.00 | 115 | 10.58 | ||||
| 2025-07-28 | 13F | Axxcess Wealth Management, Llc | 10,850 | 20.56 | 457 | 32.46 | ||||
| 2025-08-12 | 13F | Founders Financial Alliance, LLC | 161 | 0.00 | 7 | 0.00 | ||||
| 2025-08-14 | 13F | Kovitz Investment Group Partners, LLC | 9,193 | 387 | ||||||
| 2025-08-14 | 13F | Citadel Advisors Llc | 7,060 | 298 | ||||||
| 2025-08-13 | 13F | Northwestern Mutual Wealth Management Co | 70,437 | 0.22 | 2,969 | 10.09 | ||||
| 2025-08-06 | 13F | Founders Financial Securities Llc | 0 | -100.00 | 0 | |||||
| 2025-08-11 | 13F | Citigroup Inc | 10,697 | -0.25 | 451 | 9.49 | ||||
| 2025-08-14 | 13F | Integrated Wealth Concepts LLC | 9,563 | 0.48 | 403 | 10.41 | ||||
| 2025-08-15 | 13F | Tower Research Capital LLC (TRC) | 8 | 60.00 | 0 | |||||
| 2025-07-01 | 13F | Harbor Investment Advisory, Llc | 830 | 0.00 | 35 | 9.68 | ||||
| 2025-07-24 | 13F | Us Bancorp \de\ | 349 | -35.37 | 15 | -30.00 | ||||
| 2025-08-19 | 13F | Asset Dedication, LLC | 555 | 0.00 | 23 | 9.52 | ||||
| 2025-07-28 | 13F | Harbour Investments, Inc. | 65 | 0.00 | 3 | 0.00 | ||||
| 2025-08-14 | 13F | Glen Eagle Advisors, LLC | 717 | -12.13 | 30 | -3.23 | ||||
| 2025-08-18 | 13F | Geneos Wealth Management Inc. | 1,406 | 2.33 | 59 | 13.46 | ||||
| 2025-08-12 | 13F | NFP Retirement, Inc. | 5,105 | 215 | ||||||
| 2025-08-01 | 13F | Winebrenner Capital Management Llc | 20,535 | 0.00 | 866 | 9.91 | ||||
| 2025-05-15 | 13F | Putnam Fl Investment Management Co | 0 | -100.00 | 0 | |||||
| 2025-07-18 | 13F | Truist Financial Corp | 23,159 | -3.07 | 976 | 6.55 | ||||
| 2025-08-08 | 13F | Emerald Investment Partners, Llc | 47,790 | -3.12 | 2,014 | 6.45 | ||||
| 2025-08-19 | 13F | Newbridge Financial Services Group, Inc. | 18,618 | 785 | ||||||
| 2025-07-14 | 13F | Legacy Capital Group California, Inc. | 5,390 | 227 | ||||||
| 2025-08-14 | 13F | Raymond James Financial Inc | 43,156 | -3.78 | 1,819 | 5.76 | ||||
| 2025-08-19 | 13F | National Asset Management, Inc. | 5,090 | 215 | ||||||
| 2025-07-17 | 13F | Janney Montgomery Scott LLC | 14,626 | 0.43 | 1 | |||||
| 2025-07-25 | 13F | Cwm, Llc | 697 | 0.00 | 0 | |||||
| 2025-08-14 | 13F | Stifel Financial Corp | 119,307 | -1.11 | 5,029 | 8.67 | ||||
| 2025-08-12 | 13F | Steward Partners Investment Advisory, Llc | 116 | 0.00 | 5 | 0.00 | ||||
| 2025-07-17 | 13F | Peoples Financial Services Corp. | 800 | 0.00 | 34 | 10.00 | ||||
| 2025-05-01 | 13F | Country Club Bank /gfn | 0 | -100.00 | 0 | |||||
| 2025-07-29 | 13F | Stratos Wealth Partners, LTD. | 0 | -100.00 | 0 | |||||
| 2025-08-11 | 13F | Blue Bell Private Wealth Management, Llc | 0 | 0 | ||||||
| 2025-08-14 | 13F | Mml Investors Services, Llc | 72,606 | 33.64 | 3 | 50.00 | ||||
| 2025-08-18 | 13F/A | National Bank Of Canada /fi/ | 3,750 | -1.83 | 158 | 8.22 | ||||
| 2025-08-14 | 13F | Fmr Llc | 2,724 | 8.70 | 115 | 18.75 | ||||
| 2025-08-01 | 13F | Austin Private Wealth, LLC | 5,977 | 3.05 | 252 | 13.06 | ||||
| 2025-08-11 | 13F | Beta Wealth Group, Inc. | 5,927 | 0.56 | 250 | 10.18 | ||||
| 2025-08-14 | 13F | Synovus Financial Corp | 6,255 | -3.08 | 264 | 6.48 | ||||
| 2025-07-24 | 13F | IFP Advisors, Inc | 882 | 1.61 | 37 | 12.12 | ||||
| 2025-08-14 | 13F | Sequent Planning LLC | 5,988 | 252 | ||||||
| 2025-07-15 | 13F | Bay Capital Advisors, LLC | 0 | -100.00 | 0 | |||||
| 2025-08-04 | 13F | Assetmark, Inc | 6,121 | -96.93 | 258 | -96.62 | ||||
| 2025-08-14 | 13F | UBS Group AG | 388,488 | 6.29 | 16,375 | 16.80 | ||||
| 2025-07-09 | 13F | Hardin Capital Partners, LLC | 4,866 | 207 | ||||||
| 2025-08-08 | 13F | Arcadia Investment Management Corp/mi | 1,400 | 0.00 | 59 | 11.32 | ||||
| 2025-08-12 | 13F | Wayfinding Financial, LLC | 0 | -100.00 | 0 | |||||
| 2025-07-30 | 13F | Rehmann Capital Advisory Group | 7,560 | 0.00 | 319 | 9.66 | ||||
| 2025-07-22 | 13F | Red Tortoise LLC | 47,508 | 2,002 | ||||||
| 2025-08-07 | 13F | Parkside Financial Bank & Trust | 278 | 1.46 | 12 | 10.00 | ||||
| 2025-08-14 | 13F | Mercer Global Advisors Inc /adv | 68,568 | -12.28 | 2,890 | -3.60 | ||||
| 2025-07-22 | 13F | Brown Miller Wealth Management, LLC | 10,850 | 457 | ||||||
| 2025-08-14 | 13F | CoreCap Advisors, LLC | 0 | -100.00 | 0 | |||||
| 2025-08-08 | 13F | Atlantic Trust, LLC | 3,000 | 0.00 | 126 | 9.57 | ||||
| 2025-07-18 | 13F | Benchmark Wealth Management, LLC | 6,211 | 0.00 | 262 | 9.66 | ||||
| 2025-08-04 | 13F | Balentine LLC | 10,107 | -0.41 | 426 | 9.51 | ||||
| 2025-08-14 | 13F | Financial Advisory Service, Inc. | 735 | 1.52 | 31 | 11.11 | ||||
| 2025-07-09 | 13F | Breakwater Investment Management | 170 | 0.00 | 7 | 16.67 | ||||
| 2025-04-24 | 13F | Decker Retirement Planning Inc. | 0 | 0 | ||||||
| 2025-07-08 | 13F | Nbc Securities, Inc. | 50 | 0.00 | 0 | |||||
| 2025-08-12 | 13F | Jpmorgan Chase & Co | 14,197 | -6.60 | 598 | 2.57 | ||||
| 2025-05-14 | 13F | Note Advisors, LLC | 0 | -100.00 | 0 | |||||
| 2025-07-25 | 13F | Concord Wealth Partners | 228,260 | 31.74 | 9,621 | 44.76 | ||||
| 2025-08-05 | 13F | Huntington National Bank | 0 | |||||||
| 2025-08-13 | 13F | Invesco Ltd. | 35,963 | -8.23 | 1,516 | 0.80 | ||||
| 2025-08-14 | 13F | Wiley Bros.-aintree Capital, Llc | 11,667 | 492 | ||||||
| 2025-08-14 | 13F | Harwood Advisory Group, LLC | 0 | -100.00 | 0 | |||||
| 2025-08-12 | 13F | Park Square Financial Group, LLC | 0 | -100.00 | 0 | |||||
| 2025-08-11 | 13F | Principal Securities, Inc. | 420 | 0.00 | 18 | 21.43 | ||||
| 2025-08-13 | 13F | Continuum Advisory, LLC | 0 | -100.00 | 0 | |||||
| 2025-08-05 | 13F | Counterweight Ventures, LLC | 6,675 | 0.00 | 281 | 9.77 | ||||
| 2025-08-11 | 13F | HighTower Advisors, LLC | 13,050 | 3.39 | 550 | 13.64 | ||||
| 2025-08-14 | 13F | Jane Street Group, Llc | 57,762 | 2,435 | ||||||
| 2025-08-14 | 13F | Qube Research & Technologies Ltd | 178 | 0.00 | 8 | 16.67 | ||||
| 2025-08-05 | 13F | Westside Investment Management, Inc. | 140 | 0.00 | 6 | 0.00 | ||||
| 2025-07-25 | 13F | Concord Asset Management, LLC/VA | 228,260 | 28.45 | 9,621 | 34.18 | ||||
| 2025-05-14 | 13F | Flow Traders U.s. Llc | 0 | -100.00 | 0 | |||||
| 2025-07-02 | 13F | HBW Advisory Services LLC | 0 | -100.00 | 0 | |||||
| 2025-07-29 | 13F | Beverly Hills Private Wealth, LLC | 11,389 | -2.10 | 480 | 7.62 | ||||
| 2025-07-22 | 13F | Partners Wealth Management, Llc | 21,601 | 0.00 | 832 | 0.36 | ||||
| 2025-08-13 | 13F | Stablepoint Partners, LLC | 7,342 | -1.44 | 309 | 8.42 | ||||
| 2025-08-14 | 13F | Sunbelt Securities, Inc. | 600 | 0.00 | 21 | -13.04 | ||||
| 2025-08-14 | 13F | Susquehanna International Group, Llp | 37,848 | 21.48 | 1,595 | 33.47 | ||||
| 2025-08-13 | 13F | Milestone Investment Advisors LLC | 1,249 | 0.00 | 53 | 10.64 | ||||
| 2025-08-08 | 13F | Avantax Advisory Services, Inc. | 13,253 | 1.75 | 559 | 11.82 | ||||
| 2025-08-07 | 13F | Allworth Financial LP | 525 | 0.00 | 22 | 4.76 | ||||
| 2025-08-14 | 13F | Wells Fargo & Company/mn | 636,241 | 111.18 | 26,818 | 132.06 | ||||
| 2025-08-11 | 13F | Dorsey Wright & Associates | 66,718 | 2,812 | ||||||
| 2025-08-14 | 13F | Gen-Wealth Partners Inc | 260 | 0.00 | 11 | 11.11 | ||||
| 2025-08-15 | 13F | Morgan Stanley | 852,932 | -4.15 | 35,951 | 5.33 | ||||
| 2025-07-31 | 13F | Glass Jacobson Investment Advisors llc | 0 | -100.00 | 0 | -100.00 | ||||
| 2025-08-11 | 13F | Private Advisor Group, LLC | 36,345 | 4.48 | 1,532 | 14.77 | ||||
| 2025-05-28 | NP | INKM - SPDR SSGA Income Allocation ETF This fund is a listed as child fund of State Street Corp and if that institution has disclosed ownership in this security, then these positions will not be double counted when calculating total shares and total value | 249,042 | 704.89 | 9,553 | 783.72 | ||||
| 2025-08-14 | 13F | Bank Of America Corp /de/ | 711,358 | -3.24 | 29,984 | 6.32 | ||||
| 2025-07-21 | 13F | Empirical Financial Services, LLC d.b.a. Empirical Wealth Management | 214,955 | -3.93 | 9,060 | 5.57 | ||||
| 2025-07-25 | 13F | NorthRock Partners, LLC | 41 | 0.00 | 2 | 0.00 | ||||
| 2025-08-07 | 13F | CENTRAL TRUST Co | 700 | -17.65 | 30 | -9.37 | ||||
| 2025-09-04 | 13F/A | Advisor Group Holdings, Inc. | 98,002 | 73.58 | 4,066 | 87.59 | ||||
| 2025-04-23 | 13F | Golden State Wealth Management, LLC | 0 | -100.00 | 0 | |||||
| 2025-08-14 | 13F | GWM Advisors LLC | 1,400 | 59 | ||||||
| 2025-07-08 | 13F | Heartwood Wealth Advisors LLC | 24,906 | 0.00 | 1,050 | 9.84 | ||||
| 2025-08-15 | 13F | Captrust Financial Advisors | 4,775 | 201 | ||||||
| 2025-08-12 | 13F | Wood Tarver Financial Group, LLC | 5,381 | -2.23 | 0 | -100.00 | ||||
| 2025-08-08 | 13F | Pnc Financial Services Group, Inc. | 2,133 | -5.28 | 90 | 3.49 | ||||
| 2025-08-12 | 13F | Global Retirement Partners, LLC | 5,200 | 0.00 | 219 | 20.99 | ||||
| 2025-04-24 | 13F | Mascoma Wealth Management LLC | 0 | -100.00 | 0 | |||||
| 2025-07-24 | 13F | Eastern Bank | 359 | 0.00 | 15 | 15.38 | ||||
| 2025-08-14 | 13F | Colony Group, LLC | 161,743 | 6,817 | ||||||
| 2025-08-15 | 13F | Equitable Holdings, Inc. | 38,266 | 1,613 | ||||||
| 2025-08-06 | 13F | Savant Capital, LLC | 6,437 | 2.63 | 271 | 12.92 | ||||
| 2025-08-06 | 13F | Columbia River Financial Group, LLC | 269,476 | -10.93 | 11 | 0.00 | ||||
| 2025-08-08 | 13F | Cetera Investment Advisers | 91,850 | 16.21 | 3,871 | 27.71 | ||||
| 2025-07-31 | 13F | Hanlon Investment Management, Inc. | 12,095 | 510 | ||||||
| 2025-08-11 | 13F | Mount Lucas Management LP | 61,944 | -12.66 | 2,611 | -4.04 | ||||
| 2025-07-15 | 13F | McAdam, LLC | 28,303 | -1.78 | 1,193 | 7.87 | ||||
| 2025-08-12 | 13F | LPL Financial LLC | 187,453 | 8.93 | 7,901 | 19.69 | ||||
| 2025-08-12 | 13F | Allen Capital Group, LLC | 143,129 | -2.36 | 6,033 | 7.27 | ||||
| 2025-07-22 | 13F | Wealthcare Advisory Partners LLC | 6,250 | 2.19 | 263 | 12.39 | ||||
| 2025-05-06 | 13F | AE Wealth Management LLC | 0 | -100.00 | 0 | |||||
| 2025-08-12 | 13F | MAI Capital Management | 5,900 | 0.00 | 249 | 9.73 | ||||
| 2025-05-05 | 13F | Conservest Capital Advisors, Inc. | 0 | -100.00 | 0 | |||||
| 2025-08-13 | 13F | Mount Yale Investment Advisors, LLC | 30,576 | -0.26 | 1,289 | 9.62 | ||||
| 2025-07-11 | 13F | Farther Finance Advisors, LLC | 50 | 2 | ||||||
| 2025-08-06 | 13F | Commonwealth Equity Services, Llc | 53,579 | -4.76 | 2 | 0.00 | ||||
| 2025-08-14 | 13F | Moneta Group Investment Advisors Llc | 9,764 | -6.82 | 412 | 2.49 | ||||
| 2025-08-12 | 13F | Proequities, Inc. | 0 | 0 | ||||||
| 2025-04-15 | 13F | Transform Wealth, LLC | 9,193 | 0.00 | 353 | 9.66 | ||||
| 2025-07-08 | 13F | Parallel Advisors, LLC | 32,834 | 0.31 | 1,384 | 10.20 | ||||
| 2025-07-29 | 13F | Creekside Partners | 6,641 | 0.33 | 280 | 10.28 | ||||
| 2025-07-18 | 13F | PFG Investments, LLC | 10,825 | 1.41 | 456 | 11.49 | ||||
| 2025-08-13 | 13F | Colonial Trust Co / SC | 756 | -12.70 | 32 | -6.06 | ||||
| 2025-08-13 | 13F | Gibbs Wealth Management | 5,742 | 242 | ||||||
| 2025-08-14 | 13F | Atomi Financial Group, Inc. | 18,918 | 797 | ||||||
| 2025-09-03 | 13F | Q3 Asset Management | 0 | -100.00 | 0 | |||||
| 2025-07-30 | 13F | Eqis Capital Management, Inc. | 19,077 | -3.16 | 804 | 6.49 | ||||
| 2025-08-14 | 13F | Mariner, LLC | 8,722 | -32.70 | 368 | -26.16 | ||||
| 2025-04-23 | 13F | Creative Financial Designs Inc /adv | 0 | -100.00 | 0 | -100.00 | ||||
| 2025-07-21 | 13F | Barrett & Company, Inc. | 47 | 0.00 | 2 | 0.00 | ||||
| 2025-08-11 | 13F | Novak & Powell Financial Services, Inc. | 19,422 | 1.45 | 819 | 11.44 | ||||
| 2025-08-08 | 13F | Cornerstone Advisors Asset Management, Inc | 4,966 | 209 | ||||||
| 2025-08-05 | 13F | NewSquare Capital LLC | 1 | 0.00 | 0 | |||||
| 2025-08-13 | 13F | Jones Financial Companies Lllp | 32,524 | -0.61 | 1,367 | 8.41 | ||||
| 2025-07-11 | 13F/A | Umb Bank N A/mo | 250 | 0.00 | 11 | 11.11 | ||||
| 2025-07-24 | 13F | Blair William & Co/il | 200 | 8 | ||||||
| 2025-07-17 | 13F | Fifth Third Securities, Inc. | 11,344 | 17.14 | 478 | 28.84 | ||||
| 2025-07-30 | 13F | D.a. Davidson & Co. | 13,383 | 0.00 | 564 | 9.94 | ||||
| 2025-07-31 | 13F | Cambridge Investment Research Advisors, Inc. | 48,403 | 194.92 | 2 | |||||
| 2025-08-14 | 13F | Comerica Bank | 7,925 | 2.59 | 334 | 12.84 | ||||
| 2025-08-13 | 13F | Capital Analysts, Inc. | 12,506 | 0.16 | 1 | |||||
| 2025-07-03 | 13F | Arvest Investments, Inc. | 3,790 | -8.87 | 160 | 0.00 | ||||
| 2025-08-08 | 13F | Capital Investment Advisory Services, LLC | 258 | 0.00 | 11 | 11.11 | ||||
| 2025-08-08 | 13F | Larson Financial Group LLC | 2,989 | 1.56 | 126 | 11.61 | ||||
| 2025-08-07 | 13F | FDx Advisors, Inc. | 34,982 | -1.83 | 1 | 0.00 | ||||
| 2025-08-28 | NP | SYMIX - AlphaCentric Symmetry Strategy Fund Class I | 8,836 | -14.94 | 372 | -6.53 | ||||
| 2025-05-14 | 13F | Oarsman Capital, Inc. | 0 | -100.00 | 0 | |||||
| 2025-08-14 | 13F/A | Barclays Plc | 300 | 0.00 | 0 | |||||
| 2025-08-15 | 13F | Kestra Advisory Services, LLC | 11,213 | -3.15 | 473 | 6.31 | ||||
| 2025-07-29 | 13F | Curbstone Financial Management Corp | 11,028 | 0.00 | 465 | 9.69 | ||||
| 2025-08-05 | 13F | Key FInancial Inc | 24,440 | -0.49 | 1,030 | 9.34 | ||||
| 2025-07-29 | 13F | Dumont & Blake Investment Advisors Llc | 22,507 | -1.47 | 949 | 8.22 | ||||
| 2025-04-23 | 13F | Bessemer Group Inc | 0 | -100.00 | 0 | |||||
| 2025-08-01 | 13F | Envestnet Asset Management Inc | 154,065 | 45.32 | 6,494 | 59.69 | ||||
| 2025-08-13 | 13F | Baker Avenue Asset Management, LP | 210,444 | 161.19 | 8,870 | 187.06 |