Mga Batayang Estadistika
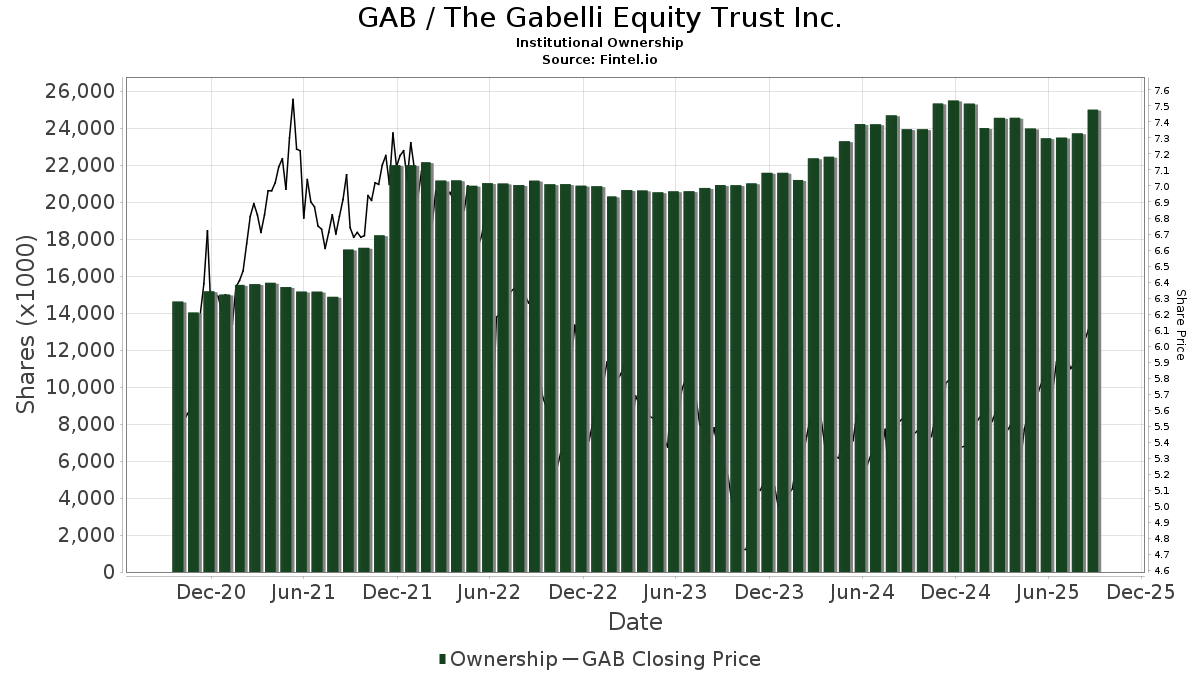
| Pemilik Institusional | 194 total, 194 long only, 0 short only, 0 long/short - change of 0.00% MRQ |
| Alokasi Portofolio Rata-rata | 0.0312 % - change of -4.71% MRQ |
| Saham Institusional (Jangka Panjang) | 24,967,498 (ex 13D/G) - change of 1.52MM shares 6.47% MRQ |
| Nilai Institusional (Jangka Panjang) | $ 121,248 USD ($1000) |
Kepemilikan Institusional dan Pemegang Saham
The Gabelli Equity Trust Inc. (US:GAB) memiliki 194 pemilik institusional dan pemegang saham yang telah mengajukan formulir 13D/G atau 13F kepada Komisi Bursa Efek (Securities Exchange Commission/SEC). Lembaga-lembaga ini memegang total 24,967,498 saham. Pemegang saham terbesar meliputi LPL Financial LLC, Morgan Stanley, Commonwealth Equity Services, Llc, J.w. Cole Advisors, Inc., Philadelphia Trust Co, Gamco Investors, Inc. Et Al, Cetera Investment Advisers, Raymond James Financial Inc, Bank Of America Corp /de/, and Royal Bank Of Canada .
Struktur kepemilikan institusional The Gabelli Equity Trust Inc. (NYSE:GAB) menunjukkan posisi terkini di perusahaan oleh institusi dan dana, serta perubahan terbaru dalam ukuran posisi. Pemegang saham utama dapat mencakup investor individu, reksa dana, dana lindung nilai, atau institusi. Jadwal 13D menunjukkan bahwa investor memegang (atau pernah memegang) lebih dari 5% saham perusahaan dan bermaksud (atau pernah bermaksud) untuk secara aktif mengejar perubahan strategi bisnis. Jadwal 13G menunjukkan investasi pasif lebih dari 5%.
The share price as of September 4, 2025 is 6.16 / share. Previously, on September 5, 2024, the share price was 5.54 / share. This represents an increase of 11.19% over that period.
Skor Sentimen Dana
Skor Sentimen Dana (sebelumnya dikenal sebagai Skor Akumulasi Kepemilikan) menemukan saham-saham yang paling banyak dibeli oleh dana. Ini adalah hasil dari model kuantitatif multi-faktor yang canggih yang mengidentifikasi perusahaan dengan tingkat akumulasi institusional tertinggi. Model penilaian menggunakan kombinasi dari total peningkatan pemilik yang diungkapkan, perubahan dalam alokasi portofolio pada pemilik tersebut, dan metrik lainnya. Angka berkisar dari 0 hingga 100, dengan angka yang lebih tinggi menunjukkan tingkat akumulasi yang lebih tinggi dibandingkan dengan perusahaan sejenisnya, dan 50 adalah rata-ratanya.
Frekuensi Pembaruan: Setiap Hari
Lihat Ownership Explorer, yang menyediakan daftar perusahaan dengan peringkat tertinggi.
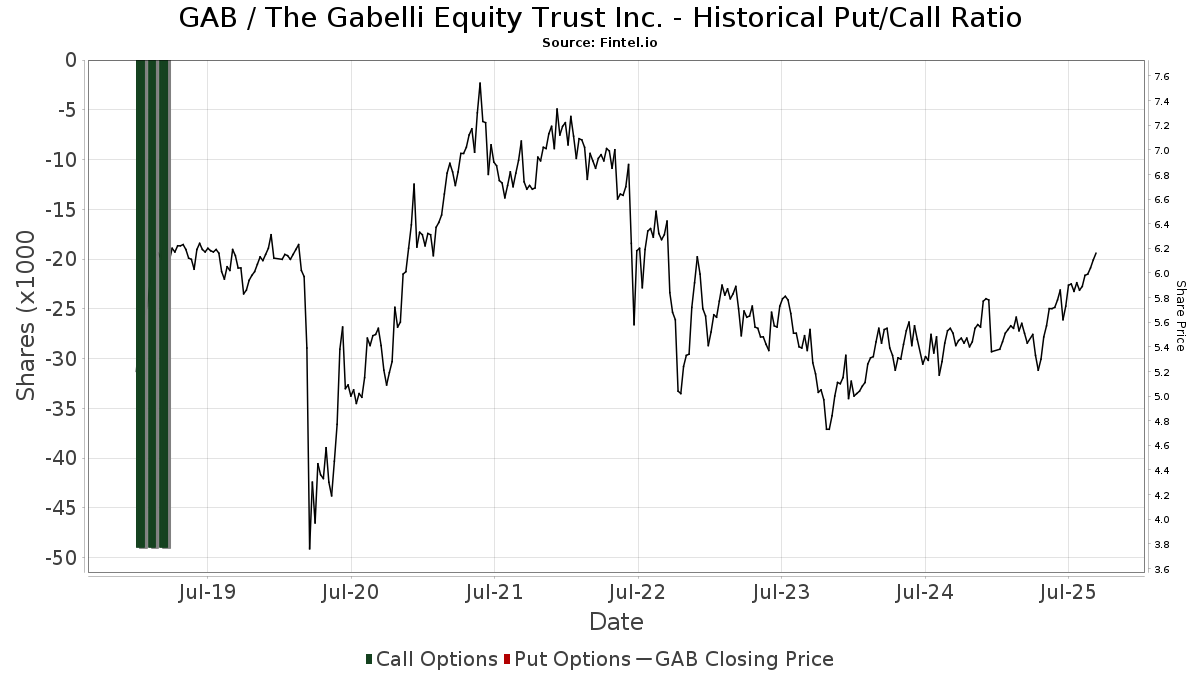
Rasio Put/Call Institusional
Selain melaporkan isu ekuitas dan utang standar, institusi dengan aset di bawah manajemen lebih dari 100 juta dolar AS juga harus mengungkapkan kepemilikan opsi put dan call mereka. Karena opsi put umumnya menunjukkan sentimen negatif, dan opsi call menunjukkan sentimen positif, kita dapat mengetahui sentimen institusional secara keseluruhan dengan memplot rasio put terhadap call. Grafik di sebelah kanan memplot rasio put/call historis untuk instrumen ini.
Menggunakan Rasio Put/Call sebagai indikator sentimen investor mengatasi salah satu kekurangan utama dari penggunaan total kepemilikan institusional, yaitu sejumlah besar aset yang dikelola diinvestasikan secara pasif untuk melacak indeks. Dana yang dikelola secara pasif biasanya tidak membeli opsi, sehingga indikator rasio put/call lebih akurat dalam melacak sentimen dana yang dikelola secara aktif.
Pengajuan 13F dan NPORT
Detail pada pengajuan 13F tersedia gratis. Detail pada pengajuan NP memerlukan keanggotaan premium. Baris berwarna hijau menunjukkan posisi baru. Baris berwarna merah menunjukkan posisi yang sudah ditutup. Klik tautan ini ikon untuk melihat riwayat transaksi selengkapnya.
Tingkatkan
untuk membuka data premium dan mengekspor ke Excel ![]() .
.
| Tanggal File | Sumber | Investor | Ketik | Presyo ng Avg (Silangan) |
Saham | Δ Saham (%) |
Dilaporkan Nilai ($1000) |
Nilai Δ (%) |
Alokasi Port (%) |
|
|---|---|---|---|---|---|---|---|---|---|---|
| 2025-08-12 | 13F | MAI Capital Management | 1,166 | 0.00 | 7 | 0.00 | ||||
| 2025-08-14 | 13F | Colony Group, LLC | 12,190 | -44.35 | 71 | -41.67 | ||||
| 2025-07-23 | 13F | Kingswood Wealth Advisors, Llc | 64,836 | 4.85 | 377 | 10.88 | ||||
| 2025-08-11 | 13F | TD Waterhouse Canada Inc. | 9,150 | 0.00 | 54 | 8.16 | ||||
| 2025-08-14 | 13F | Mml Investors Services, Llc | 92,767 | -0.11 | 1 | |||||
| 2025-08-05 | 13F | Wellington Shields Capital Management, LLC | 13,857 | 0.00 | 81 | 5.26 | ||||
| 2025-07-21 | 13F | Montz Harcus Wealth Management LLC | 15,896 | 2.60 | 93 | 8.24 | ||||
| 2025-07-31 | 13F | Darden Wealth Group Inc | 57,000 | -8.06 | 332 | -2.93 | ||||
| 2025-08-14 | 13F | Ameriprise Financial Inc | 13,605 | 79 | ||||||
| 2025-08-08 | 13F | Creative Planning | 460,823 | 0.03 | 2,682 | 5.63 | ||||
| 2025-07-11 | 13F | SILVER OAK SECURITIES, Inc | 60,770 | -5.74 | 354 | -0.28 | ||||
| 2025-07-18 | 13F | PFG Investments, LLC | 92,692 | 7.10 | 539 | 13.24 | ||||
| 2025-08-08 | 13F | Cornerstone Advisors, LLC | 2,200 | 0.00 | 13 | 0.00 | ||||
| 2025-08-01 | 13F | Financial Counselors Inc | 0 | -100.00 | 0 | |||||
| 2025-08-12 | 13F | Virtu Financial LLC | 35,102 | 0 | ||||||
| 2025-08-04 | 13F | Assetmark, Inc | 648 | 0.00 | 4 | 0.00 | ||||
| 2025-07-17 | 13F | Sound Income Strategies, LLC | 104 | 0.00 | 1 | |||||
| 2025-07-16 | 13F | West Branch Capital LLC | 22 | 0.00 | 0 | |||||
| 2025-07-24 | 13F | Us Bancorp \de\ | 1,654 | 0.00 | 10 | 0.00 | ||||
| 2025-08-08 | 13F | Cetera Investment Advisers | 601,262 | 4.82 | 3,499 | 10.73 | ||||
| 2025-08-13 | 13F | Baird Financial Group, Inc. | 32,548 | 6.55 | 189 | 12.50 | ||||
| 2025-08-22 | NP | Cornerstone Strategic Value Fund Inc | 2,200 | 0.00 | 13 | 0.00 | ||||
| 2025-07-24 | 13F | IFP Advisors, Inc | 2,170 | -13.20 | 13 | -7.69 | ||||
| 2025-08-14 | 13F | CoreCap Advisors, LLC | 9,562 | -23.49 | 56 | -19.12 | ||||
| 2025-07-21 | 13F | Empirical Financial Services, LLC d.b.a. Empirical Wealth Management | 114,937 | 0.00 | 669 | 5.53 | ||||
| 2025-08-14 | 13F | Raymond James Financial Inc | 554,382 | 8.08 | 3,227 | 14.15 | ||||
| 2025-07-01 | 13F | Kera Capital Partners, Inc. | 105,780 | 0.00 | 616 | 5.67 | ||||
| 2025-08-15 | 13F | Morgan Stanley | 2,464,758 | 1.64 | 14,345 | 7.36 | ||||
| 2025-08-11 | 13F | Private Advisor Group, LLC | 179,301 | -5.06 | 1,044 | 0.29 | ||||
| 2025-05-02 | 13F | Capital A Wealth Management, LLC | 0 | -100.00 | 0 | |||||
| 2025-07-15 | 13F | Beacon Investment Advisory Services, Inc. | 19,000 | 0.00 | 111 | 5.77 | ||||
| 2025-08-06 | 13F | Wedbush Securities Inc | 113,984 | -6.17 | 1 | |||||
| 2025-08-06 | 13F | Pekin Hardy Strauss, Inc. | 27,879 | 2.39 | 162 | 8.00 | ||||
| 2025-04-28 | 13F | Mutual Advisors, LLC | 0 | -100.00 | 0 | -100.00 | ||||
| 2025-08-12 | 13F | Global Retirement Partners, LLC | 1,902 | 9.06 | 11 | 22.22 | ||||
| 2025-08-05 | 13F | American Capital Advisory, LLC | 2,525 | 0.00 | 15 | 7.69 | ||||
| 2025-08-13 | 13F | Guggenheim Capital Llc | 358,969 | 38.61 | 2,089 | 46.39 | ||||
| 2025-07-16 | 13F | Novem Group | 10,489 | 0.00 | 61 | 7.02 | ||||
| 2025-07-14 | 13F | Golden State Equity Partners | 95,820 | -1.40 | 558 | 4.11 | ||||
| 2025-08-14 | 13F | Royal Bank Of Canada | 527,685 | 2.16 | 3,071 | 7.91 | ||||
| 2025-08-14 | 13F | Wells Fargo & Company/mn | 455,912 | -0.33 | 2,653 | 5.28 | ||||
| 2025-04-25 | 13F | Smallwood Wealth Investment Management, LLC | 1,125 | 6 | ||||||
| 2025-07-25 | 13F | LRI Investments, LLC | 16,347 | 0.00 | 95 | 5.56 | ||||
| 2025-08-06 | 13F | Savant Capital, LLC | 12,297 | 0.00 | 72 | 5.97 | ||||
| 2025-08-11 | 13F | HighTower Advisors, LLC | 71,096 | 0.44 | 414 | 5.90 | ||||
| 2025-08-14 | 13F | Citadel Advisors Llc | 25,675 | -3.44 | 149 | 2.05 | ||||
| 2025-07-30 | 13F | Insight Advisors, LLC/ PA | 21,842 | 0.00 | 127 | 5.83 | ||||
| 2025-07-17 | 13F | Eagle Wealth Strategies Llc | 18,624 | 0.00 | 108 | 5.88 | ||||
| 2025-08-14 | 13F | TCG Advisory Services, LLC | 15,203 | 0.00 | 88 | 6.02 | ||||
| 2025-07-15 | 13F | Fifth Third Bancorp | 4,000 | -9.32 | 23 | -4.17 | ||||
| 2025-07-25 | 13F | Johnson Investment Counsel Inc | 15,129 | -3.71 | 88 | 2.33 | ||||
| 2025-07-28 | 13F | Evernest Financial Advisors, LLC | 19,855 | -45.91 | 116 | -43.07 | ||||
| 2025-07-21 | 13F | Cornell Pochily Investment Advisors, Inc. | 29,580 | 172 | ||||||
| 2025-08-12 | 13F | Leigh Baldwin & Co., Llc | 86,084 | 0.00 | 501 | 5.70 | ||||
| 2025-05-15 | 13F | Glenmede Trust Co Na | 15,473 | 0.00 | 85 | 2.41 | ||||
| 2025-08-12 | 13F | Advisors Asset Management, Inc. | 208,465 | -0.53 | 1,213 | 5.11 | ||||
| 2025-08-01 | 13F | Motco | 22,318 | -26.39 | 130 | -22.75 | ||||
| 2025-07-30 | 13F | Brookstone Capital Management | 25,770 | -4.22 | 150 | 0.68 | ||||
| 2025-08-14 | 13F | DecisionPoint Financial, LLC | 0 | -100.00 | 0 | |||||
| 2025-07-17 | 13F | Park Place Capital Corp | 0 | -100.00 | 0 | |||||
| 2025-08-01 | 13F | MorganRosel Wealth Management, LLC | 6,246 | 36 | ||||||
| 2025-08-13 | 13F | Scotia Capital Inc. | 459,571 | 0.32 | 2,675 | 5.94 | ||||
| 2025-08-14 | 13F | Great Valley Advisor Group, Inc. | 24,475 | 0.55 | 142 | 5.97 | ||||
| 2025-05-12 | 13F | Independent Advisor Alliance | 0 | -100.00 | 0 | |||||
| 2025-07-18 | 13F | Bartlett & Co. Wealth Management Llc | 902 | 0.00 | 5 | 25.00 | ||||
| 2025-08-07 | 13F | Midland Wealth Advisors Llc | 26,748 | 0.00 | 156 | 5.44 | ||||
| 2025-07-24 | 13F | Aurora Private Wealth, Inc. | 11,014 | 2.60 | 0 | |||||
| 2025-07-17 | 13F | HCR Wealth Advisors | 75,353 | 0.00 | 439 | 5.54 | ||||
| 2025-08-14 | 13F | MidWestOne Financial Group, Inc. | 19,142 | 0.00 | 111 | 5.71 | ||||
| 2025-07-25 | 13F | Cwm, Llc | 12,802 | 0.00 | 0 | |||||
| 2025-08-08 | 13F | Meridian Wealth Management, LLC | 16,264 | 15.64 | 95 | 22.08 | ||||
| 2025-08-15 | 13F | Captrust Financial Advisors | 89,087 | 1.30 | 518 | 7.02 | ||||
| 2025-09-04 | 13F/A | Advisor Group Holdings, Inc. | 211,300 | 11.35 | 1,229 | 17.51 | ||||
| 2025-04-21 | 13F | Institute for Wealth Management, LLC. | 0 | -100.00 | 0 | -100.00 | ||||
| 2025-04-25 | 13F | Red Tortoise LLC | 0 | -100.00 | 0 | |||||
| 2025-08-05 | 13F | Wellington Shields & Co., LLC | 5,428 | 0.00 | 32 | 6.90 | ||||
| 2025-08-06 | 13F | RFG - Bristol Wealth Advisors, LLC | 14,053 | -9.04 | 82 | -4.71 | ||||
| 2025-05-05 | 13F | Hazlett, Burt & Watson, Inc. | 0 | -100.00 | 0 | |||||
| 2025-07-31 | 13F | Oppenheimer & Co Inc | 121,605 | 5.91 | 708 | 11.87 | ||||
| 2025-08-01 | 13F | Ashton Thomas Private Wealth, LLC | 20,302 | -51.55 | 118 | -48.70 | ||||
| 2025-08-07 | 13F | Kestra Private Wealth Services, Llc | 28,038 | 0.70 | 163 | 6.54 | ||||
| 2025-08-14 | 13F | UBS Group AG | 379,728 | 10.42 | 2,210 | 16.68 | ||||
| 2025-07-25 | 13F | Concord Wealth Partners | 303 | 0.00 | 2 | 0.00 | ||||
| 2025-08-05 | 13F | Sigma Planning Corp | 12,942 | 0.43 | 75 | 5.63 | ||||
| 2025-08-13 | 13F | Northwestern Mutual Wealth Management Co | 1,371 | -82.54 | 8 | -83.72 | ||||
| 2025-08-14 | 13F | Bank Of America Corp /de/ | 531,315 | 4.71 | 3,092 | 10.63 | ||||
| 2025-05-08 | 13F | Sound View Wealth Advisors Group, LLC | 0 | -100.00 | 0 | |||||
| 2025-08-06 | 13F | Texas Yale Capital Corp. | 11,000 | 2.80 | 64 | 10.34 | ||||
| 2025-08-14 | 13F | Mariner, LLC | 27,160 | -9.04 | 158 | -3.66 | ||||
| 2025-07-29 | 13F | Aire Advisors, Llc | 11,813 | 69 | ||||||
| 2025-07-30 | 13F | Cornerstone Advisory, LLC | 18,021 | 1.45 | 105 | 6.12 | ||||
| 2025-05-09 | 13F | Shaker Financial Services, LLC | 0 | -100.00 | 0 | |||||
| 2025-08-11 | 13F | Elequin Capital Lp | 26,873 | 156 | ||||||
| 2025-08-11 | 13F | Principal Securities, Inc. | 4,147 | 5.44 | 24 | 14.29 | ||||
| 2025-08-11 | 13F | Capital Square, LLC | 18,747 | 0.00 | 111 | 6.80 | ||||
| 2025-07-01 | 13F | Legacy Wealth Management, LLC / MS | 52,739 | 184.29 | 307 | 200.00 | ||||
| 2025-08-04 | 13F | Bay Colony Advisory Group, Inc d/b/a Bay Colony Advisors | 24,230 | 0.98 | 141 | 7.63 | ||||
| 2025-08-13 | 13F | Rsm Us Wealth Management Llc | 92,100 | 0.00 | 536 | 5.72 | ||||
| 2025-08-14 | 13F | Gen-Wealth Partners Inc | 5,235 | -24.51 | 30 | -21.05 | ||||
| 2025-08-14 | 13F | CIBC World Markets Inc. | 81,459 | 4.51 | 474 | 10.49 | ||||
| 2025-08-01 | 13F | Boyd Watterson Asset Management Llc/oh | 5,280 | 0.00 | 31 | 3.45 | ||||
| 2025-05-13 | 13F | Bank Of Montreal /can/ | 0 | -100.00 | 0 | |||||
| 2025-08-06 | 13F | Modera Wealth Management, LLC | 17,200 | 0.00 | 100 | 6.38 | ||||
| 2025-07-28 | 13F | Triton Wealth Management, PLLC | 11,031 | 0.51 | 66 | 6.56 | ||||
| 2025-08-14 | 13F | Cohen & Steers, Inc. | 400,000 | 0.00 | 2 | 0.00 | ||||
| 2025-07-17 | 13F | Janney Montgomery Scott LLC | 147,684 | 6.85 | 1 | |||||
| 2025-08-14 | 13F | Comerica Bank | 16,537 | 1,653,600.00 | 96 | |||||
| 2025-08-04 | 13F | Spire Wealth Management | 1,000 | 0.00 | 6 | 0.00 | ||||
| 2025-08-14 | 13F/A | Rockefeller Capital Management L.P. | 204,703 | 1.27 | 1,191 | 7.01 | ||||
| 2025-08-14 | 13F | Wealth Preservation Advisors, LLC | 1,500 | 0.00 | 9 | 0.00 | ||||
| 2025-07-29 | 13F | International Assets Investment Management, Llc | 397,426 | 0.00 | 2,313 | 5.66 | ||||
| 2025-08-05 | 13F | Mission Wealth Management, Lp | 37,574 | 0.00 | 219 | 5.31 | ||||
| 2025-05-16 | 13F | Coppell Advisory Solutions LLC | 0 | -100.00 | 0 | |||||
| 2025-07-11 | 13F | Kapstone Financial Advisors LLC | 21,080 | 80.94 | 123 | 90.63 | ||||
| 2025-07-14 | 13F | Armstrong Advisory Group, Inc | 2,727 | 16 | ||||||
| 2025-08-14 | 13F | GWM Advisors LLC | 32,406 | -11.71 | 189 | -6.93 | ||||
| 2025-08-06 | 13F | Vantage Financial Partners, LLC | 15,269 | -29.15 | 89 | -25.42 | ||||
| 2025-08-14 | 13F | Benjamin Edwards Inc | 32,542 | 2.32 | 189 | 8.00 | ||||
| 2025-08-14 | 13F | Mendel Capital Management LLC | 25,638 | 0.00 | 149 | 5.67 | ||||
| 2025-08-06 | 13F | Chancellor Financial Group WB LP | 19,010 | 1.70 | 111 | 7.84 | ||||
| 2025-08-06 | 13F | Commonwealth Equity Services, Llc | 1,878,662 | -0.72 | 11 | 0.00 | ||||
| 2025-05-09 | 13F | Exencial Wealth Advisors, Llc | 0 | -100.00 | 0 | |||||
| 2025-07-21 | 13F | Ameritas Advisory Services, LLC | 9,856 | -60.12 | 57 | -58.09 | ||||
| 2025-08-13 | 13F | Philadelphia Trust Co | 1,141,144 | -0.27 | 7 | 0.00 | ||||
| 2025-07-22 | 13F/A | Kingstone Capital Partners Texas, LLC | 26,996 | 0.00 | 157 | 5.37 | ||||
| 2025-07-22 | 13F | Valeo Financial Advisors, LLC | 0 | -100.00 | 0 | |||||
| 2025-08-04 | 13F | Live Oak Private Wealth LLC | 514,176 | 0.00 | 2,993 | 5.61 | ||||
| 2025-08-12 | 13F | Proequities, Inc. | 0 | 0 | ||||||
| 2025-08-13 | 13F | Continuum Advisory, LLC | 0 | -100.00 | 0 | -100.00 | ||||
| 2025-08-05 | 13F | Key FInancial Inc | 100 | 0.00 | 1 | |||||
| 2025-07-25 | 13F | Valley Brook Capital Group, Inc. | 115,836 | 2.66 | 674 | 8.53 | ||||
| 2025-08-13 | 13F | Beacon Pointe Advisors, LLC | 15,731 | -45.25 | 92 | -42.41 | ||||
| 2025-08-14 | 13F | Glen Eagle Advisors, LLC | 1,906 | 0.00 | 11 | 10.00 | ||||
| 2025-08-15 | 13F | Tower Research Capital LLC (TRC) | 25 | -16.67 | 0 | |||||
| 2025-07-21 | 13F | Hilltop National Bank | 2,750 | 0.00 | 16 | 14.29 | ||||
| 2025-07-22 | 13F | Accel Wealth Management | 364,694 | 1.16 | 2,123 | 6.85 | ||||
| 2025-08-13 | 13F | Transce3nd, LLC | 1,000 | 6 | ||||||
| 2025-08-14 | 13F | Beaird Harris Wealth Management, LLC | 3,917 | 23 | ||||||
| 2025-07-29 | 13F | Stratos Wealth Partners, LTD. | 110,735 | 14.61 | 644 | 21.05 | ||||
| 2025-08-08 | 13F | Pnc Financial Services Group, Inc. | 2,804 | -66.02 | 16 | -64.44 | ||||
| 2025-08-14 | 13F | Mercer Global Advisors Inc /adv | 64,822 | -0.24 | 377 | 5.31 | ||||
| 2025-08-04 | 13F | IFG Advisory, LLC | 31,486 | 11.71 | 183 | 18.06 | ||||
| 2025-08-13 | 13F | Smith, Moore & Co. | 17,104 | 45.00 | 100 | 54.69 | ||||
| 2025-08-19 | 13F | National Asset Management, Inc. | 0 | -100.00 | 0 | |||||
| 2025-07-23 | 13F | Stonegate Investment Group, LLC | 47,974 | 2.64 | 279 | 8.56 | ||||
| 2025-08-14 | 13F | Glenmede Investment Management, LP | 15,473 | 90 | ||||||
| 2025-07-30 | 13F | Avidian Wealth Solutions, LLC | 19,295 | 0.00 | 112 | 5.66 | ||||
| 2025-07-09 | 13F | Graves-Light Private Wealth Management, Inc. | 41,224 | 0.00 | 240 | 5.29 | ||||
| 2025-08-14 | 13F | Balyasny Asset Management Llc | 25,778 | 150 | ||||||
| 2025-08-14 | 13F | Hilltop Holdings Inc. | 18,032 | -12.80 | 105 | -7.96 | ||||
| 2025-08-01 | 13F | Envestnet Asset Management Inc | 457,149 | 761.91 | 2,661 | 810.96 | ||||
| 2025-08-13 | 13F | Cerity Partners LLC | 306,890 | 29.13 | 1,786 | 36.44 | ||||
| 2025-04-14 | 13F | RDA Financial Network | 0 | -100.00 | 0 | |||||
| 2025-07-21 | 13F | Crews Bank & Trust | 0 | -100.00 | 0 | |||||
| 2025-07-28 | 13F | Sagespring Wealth Partners, Llc | 0 | -100.00 | 0 | |||||
| 2025-08-06 | 13F | Golden State Wealth Management, LLC | 339,861 | -34.47 | 1,978 | -30.80 | ||||
| 2025-08-06 | 13F | Csenge Advisory Group | 12,459 | 0.00 | 72 | 9.23 | ||||
| 2025-08-14 | 13F | Stifel Financial Corp | 95,927 | -14.84 | 558 | -10.00 | ||||
| 2025-08-12 | 13F | LPL Financial LLC | 3,804,780 | 9.50 | 22,144 | 15.66 | ||||
| 2025-08-07 | 13F | Allworth Financial LP | 38,908 | 620.25 | 226 | 707.14 | ||||
| 2025-08-12 | 13F | CIBC Private Wealth Group, LLC | 1,484 | 2.56 | 9 | 14.29 | ||||
| 2025-08-12 | 13F | Steward Partners Investment Advisory, Llc | 318,939 | 27.38 | 1,856 | 34.59 | ||||
| 2025-08-19 | 13F | Advisory Services Network, LLC | 100,044 | -1.97 | 582 | 3.56 | ||||
| 2025-07-25 | 13F | Apollon Wealth Management, LLC | 15,222 | 0.34 | 89 | 6.02 | ||||
| 2025-08-08 | 13F | Kingsview Wealth Management, LLC | 39,426 | 0.13 | 229 | 6.02 | ||||
| 2025-07-18 | 13F | Consolidated Portfolio Review Corp | 112,532 | -17.72 | 655 | -13.15 | ||||
| 2025-05-14 | 13F | Huntington National Bank | 27 | 2,500.00 | ||||||
| 2025-04-22 | 13F | Putney Financial Group LLC | 0 | -100.00 | 0 | |||||
| 2025-08-13 | 13F | StoneX Group Inc. | 13,612 | 79 | ||||||
| 2025-08-13 | 13F | Thomas J. Herzfeld Advisors, Inc. | 1,020 | 2.62 | 6 | 0.00 | ||||
| 2025-07-10 | 13F | Wealth Enhancement Advisory Services, Llc | 99,274 | -2.47 | 589 | 5.00 | ||||
| 2025-08-12 | 13F | Jpmorgan Chase & Co | 4,500 | 0.00 | 26 | 8.33 | ||||
| 2025-07-18 | 13F | SOA Wealth Advisors, LLC. | 1,200 | 0.00 | 7 | 0.00 | ||||
| 2025-08-14 | 13F | Arete Wealth Advisors, LLC | 0 | -100.00 | 0 | |||||
| 2025-07-24 | 13F | Cascade Investment Group, Inc. | 11,749 | 0.00 | 68 | 6.25 | ||||
| 2025-07-15 | 13F | Shulman DeMeo Asset Management LLC | 57,639 | -0.20 | 335 | 5.35 | ||||
| 2025-07-25 | 13F | Atria Wealth Solutions, Inc. | 42,033 | -51.36 | 245 | -48.74 | ||||
| 2025-08-05 | 13F | Flynn Zito Capital Management, Llc | 88,806 | 0.00 | 517 | 5.52 | ||||
| 2025-08-08 | 13F | Thompson Davis & Co., Inc. | 13,000 | 76 | ||||||
| 2025-08-13 | 13F | Gamco Investors, Inc. Et Al | 841,675 | -0.64 | 4,899 | 4.95 | ||||
| 2025-07-17 | 13F | Vermillion Wealth Management, Inc. | 2,740 | 2.58 | 16 | 7.14 | ||||
| 2025-07-28 | 13F | Frazier Financial Advisors, LLC | 81 | 0.00 | 0 | |||||
| 2025-08-14 | 13F | Jane Street Group, Llc | 45,156 | 138.53 | 263 | 151.92 | ||||
| 2025-07-29 | 13F | Stratos Wealth Advisors, LLC | 0 | -100.00 | 0 | -100.00 | ||||
| 2025-08-15 | 13F | Equitable Holdings, Inc. | 63,099 | 0.00 | 367 | 5.76 | ||||
| 2025-07-31 | 13F | Moloney Securities Asset Management, LLC | 15,832 | 92 | ||||||
| 2025-08-07 | 13F | Midwest Trust Co | 52,810 | 307 | ||||||
| 2025-07-11 | 13F | Quad-Cities Investment Group, LLC | 24,942 | -0.36 | 145 | 5.84 | ||||
| 2025-08-14 | 13F | Two Sigma Securities, Llc | 18,317 | 107 | ||||||
| 2025-07-16 | 13F | Register Financial Advisors LLC | 22,637 | 81.07 | 132 | 92.65 | ||||
| 2025-08-01 | 13F | SYM FINANCIAL Corp | 11,476 | 2.60 | 67 | 8.20 | ||||
| 2025-05-15 | 13F | Gwn Securities Inc. | 0 | -100.00 | 0 | |||||
| 2025-07-08 | 13F | Nbc Securities, Inc. | 37,447 | -4.17 | 0 | |||||
| 2025-04-29 | 13F | Lee Danner & Bass Inc | 0 | -100.00 | 0 | -100.00 | ||||
| 2025-07-10 | 13F | Oliver Lagore Vanvalin Investment Group | 3,750 | 0.00 | 21 | 0.00 | ||||
| 2025-08-05 | 13F | GHP Investment Advisors, Inc. | 5,344 | 0.00 | 31 | 6.90 | ||||
| 2025-07-29 | 13F | Arista Wealth Management, LLC | 47,128 | 0.00 | 274 | 5.79 | ||||
| 2025-07-25 | 13F | Community Bank, N.A. | 1,000 | 0.00 | 6 | 0.00 | ||||
| 2025-04-25 | 13F | Koshinski Asset Management, Inc. | 0 | -100.00 | 0 | |||||
| 2025-05-12 | 13F | National Bank Of Canada /fi/ | 0 | -100.00 | 0 | |||||
| 2025-08-15 | 13F | Kestra Advisory Services, LLC | 65,339 | 29.24 | 380 | 36.69 | ||||
| 2025-05-07 | 13F | Sheaff Brock Investment Advisors, LLC | 33,495 | 0.00 | 185 | 2.22 | ||||
| 2025-07-31 | 13F | Cambridge Investment Research Advisors, Inc. | 59,542 | -9.70 | 0 | |||||
| 2025-07-22 | 13F | Belpointe Asset Management LLC | 0 | -100.00 | 0 | |||||
| 2025-07-31 | 13F | Whipplewood Advisors, LLC | 0 | -100.00 | 0 | |||||
| 2025-07-25 | 13F | NorthRock Partners, LLC | 81,363 | 1.43 | 474 | 7.26 | ||||
| 2025-08-14 | 13F | Federation des caisses Desjardins du Quebec | 739 | 0.00 | 4 | 0.00 | ||||
| 2025-07-22 | 13F | Marks Group Wealth Management, Inc | 244,838 | 0.00 | 1,425 | 5.56 | ||||
| 2025-08-08 | 13F | Symphony Financial Services, Inc. | 29,978 | 0.79 | 174 | 6.75 | ||||
| 2025-07-22 | 13F | Gsa Capital Partners Llp | 0 | -100.00 | 0 | |||||
| 2025-08-05 | 13F | Carolinas Wealth Consulting Llc | 0 | -100.00 | 0 | -100.00 | ||||
| 2025-08-14 | 13F | Prestige Wealth Management Group LLC | 343 | 0.00 | 2 | 0.00 | ||||
| 2025-08-14 | 13F | Safeguard Investment Advisory Group, LLC | 14,590 | 2.22 | 85 | 7.69 | ||||
| 2025-07-29 | 13F | Stephens Inc /ar/ | 16,873 | 0.00 | 98 | 6.52 | ||||
| 2025-07-24 | 13F | Ronald Blue Trust, Inc. | 2,000 | 12 | ||||||
| 2025-08-18 | 13F | Hollencrest Capital Management | 95,533 | 0.00 | 556 | 5.70 | ||||
| 2025-08-18 | 13F | Tactive Advisors, LLC | 17,154 | 100 | ||||||
| 2025-08-18 | 13F | Geneos Wealth Management Inc. | 5,100 | 200.00 | 30 | 222.22 | ||||
| 2025-08-14 | 13F | Susquehanna International Group, Llp | 0 | -100.00 | 0 | |||||
| 2025-08-14 | 13F | Synovus Financial Corp | 39,468 | 0.00 | 230 | 5.53 | ||||
| 2025-08-26 | 13F/A | Thrivent Financial For Lutherans | 191,249 | 0.68 | 1 | 0.00 | ||||
| 2025-07-15 | 13F | Kentucky Trust Co | 7,400 | 0.00 | 43 | 7.50 | ||||
| 2025-08-07 | 13F | PCG Wealth Advisors, LLC | 0 | -100.00 | 0 | |||||
| 2025-08-08 | 13F | Good Life Advisors, LLC | 22,161 | 10.03 | 129 | 16.36 | ||||
| 2025-08-12 | 13F | J.w. Cole Advisors, Inc. | 1,258,278 | 74.69 | 7,323 | 84.55 | ||||
| 2025-08-08 | 13F | MTM Investment Management, LLC | 13,530 | 0.00 | 79 | 5.41 | ||||
| 2025-07-18 | 13F | Truist Financial Corp | 20,567 | -0.36 | 120 | 5.31 | ||||
| 2025-08-08 | 13F | Avantax Advisory Services, Inc. | 46,000 | -0.48 | 268 | 5.12 | ||||
| 2025-08-11 | 13F | Rothschild Investment Llc | 6,000 | 0.00 | 35 | 3.03 |