Mga Batayang Estadistika
| Pemilik Institusional | 118 total, 118 long only, 0 short only, 0 long/short - change of 55.26% MRQ |
| Alokasi Portofolio Rata-rata | 0.4785 % - change of 21.14% MRQ |
| Saham Institusional (Jangka Panjang) | 10,221,747 (ex 13D/G) - change of 6.03MM shares 144.03% MRQ |
| Nilai Institusional (Jangka Panjang) | $ 330,115 USD ($1000) |
Kepemilikan Institusional dan Pemegang Saham
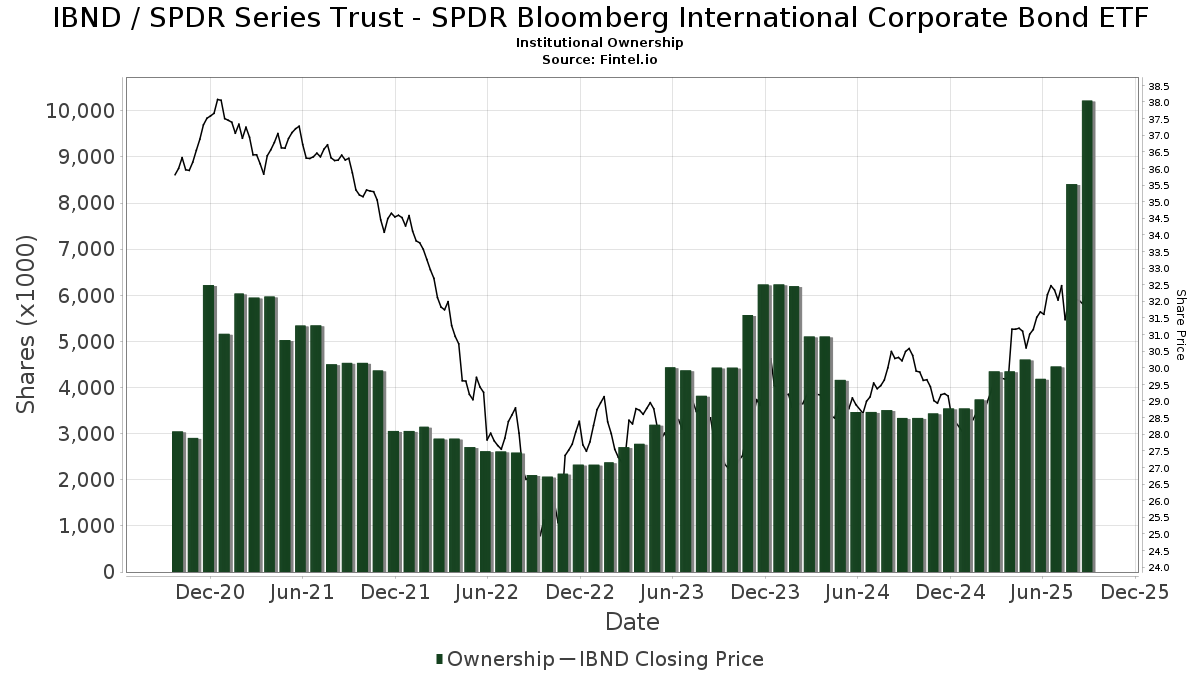
SPDR Series Trust - SPDR Bloomberg International Corporate Bond ETF (US:IBND) memiliki 118 pemilik institusional dan pemegang saham yang telah mengajukan formulir 13D/G atau 13F kepada Komisi Bursa Efek (Securities Exchange Commission/SEC). Lembaga-lembaga ini memegang total 10,221,747 saham. Pemegang saham terbesar meliputi Mainstay Capital Management Llc /adv, Checchi Capital Advisers, LLC, Lodestar Private Asset Management Llc, Redhawk Wealth Advisors, Inc., Cambria Investment Management, L.P., Leuthold Group, Llc, GAL - SPDR SSGA Global Allocation ETF, NewSquare Capital LLC, Ameritas Investment Partners, Inc., and Lam Group, Inc. .
Struktur kepemilikan institusional SPDR Series Trust - SPDR Bloomberg International Corporate Bond ETF (ARCA:IBND) menunjukkan posisi terkini di perusahaan oleh institusi dan dana, serta perubahan terbaru dalam ukuran posisi. Pemegang saham utama dapat mencakup investor individu, reksa dana, dana lindung nilai, atau institusi. Jadwal 13D menunjukkan bahwa investor memegang (atau pernah memegang) lebih dari 5% saham perusahaan dan bermaksud (atau pernah bermaksud) untuk secara aktif mengejar perubahan strategi bisnis. Jadwal 13G menunjukkan investasi pasif lebih dari 5%.
The share price as of September 5, 2025 is 32.28 / share. Previously, on September 6, 2024, the share price was 30.33 / share. This represents an increase of 6.43% over that period.
Skor Sentimen Dana
Skor Sentimen Dana (sebelumnya dikenal sebagai Skor Akumulasi Kepemilikan) menemukan saham-saham yang paling banyak dibeli oleh dana. Ini adalah hasil dari model kuantitatif multi-faktor yang canggih yang mengidentifikasi perusahaan dengan tingkat akumulasi institusional tertinggi. Model penilaian menggunakan kombinasi dari total peningkatan pemilik yang diungkapkan, perubahan dalam alokasi portofolio pada pemilik tersebut, dan metrik lainnya. Angka berkisar dari 0 hingga 100, dengan angka yang lebih tinggi menunjukkan tingkat akumulasi yang lebih tinggi dibandingkan dengan perusahaan sejenisnya, dan 50 adalah rata-ratanya.
Frekuensi Pembaruan: Setiap Hari
Lihat Ownership Explorer, yang menyediakan daftar perusahaan dengan peringkat tertinggi.
Rasio Put/Call Institusional
Selain melaporkan isu ekuitas dan utang standar, institusi dengan aset di bawah manajemen lebih dari 100 juta dolar AS juga harus mengungkapkan kepemilikan opsi put dan call mereka. Karena opsi put umumnya menunjukkan sentimen negatif, dan opsi call menunjukkan sentimen positif, kita dapat mengetahui sentimen institusional secara keseluruhan dengan memplot rasio put terhadap call. Grafik di sebelah kanan memplot rasio put/call historis untuk instrumen ini.
Menggunakan Rasio Put/Call sebagai indikator sentimen investor mengatasi salah satu kekurangan utama dari penggunaan total kepemilikan institusional, yaitu sejumlah besar aset yang dikelola diinvestasikan secara pasif untuk melacak indeks. Dana yang dikelola secara pasif biasanya tidak membeli opsi, sehingga indikator rasio put/call lebih akurat dalam melacak sentimen dana yang dikelola secara aktif.
Pengajuan 13F dan NPORT
Detail pada pengajuan 13F tersedia gratis. Detail pada pengajuan NP memerlukan keanggotaan premium. Baris berwarna hijau menunjukkan posisi baru. Baris berwarna merah menunjukkan posisi yang sudah ditutup. Klik tautan ini ikon untuk melihat riwayat transaksi selengkapnya.
Tingkatkan
untuk membuka data premium dan mengekspor ke Excel ![]() .
.
| Tanggal File | Sumber | Investor | Ketik | Presyo ng Avg (Silangan) |
Saham | Δ Saham (%) |
Dilaporkan Nilai ($1000) |
Nilai Δ (%) |
Alokasi Port (%) |
|
|---|---|---|---|---|---|---|---|---|---|---|
| 2025-08-13 | 13F | Capital Analysts, Inc. | 971 | 0.00 | 0 | |||||
| 2025-08-06 | 13F | Prospera Financial Services Inc | 95,347 | 3,107 | ||||||
| 2025-08-18 | 13F | Front Row Advisors LLC | 400 | 0.00 | 13 | 18.18 | ||||
| 2025-07-30 | 13F | Roman Butler Fullerton & Co | 8,385 | 271 | ||||||
| 2025-05-09 | 13F | Commonwealth Equity Services, Llc | 0 | -100.00 | 0 | |||||
| 2025-05-16 | 13F | Coppell Advisory Solutions LLC | 0 | -100.00 | 0 | -100.00 | ||||
| 2025-08-12 | 13F | Wayfinding Financial, LLC | 0 | -100.00 | 0 | |||||
| 2025-07-17 | 13F | Tempus Wealth Planning, LLC | 34,835 | 1.36 | 1,135 | 12.04 | ||||
| 2025-08-13 | 13F | RPg Family Wealth Advisory, LLC | 10,626 | -5.45 | 346 | 4.53 | ||||
| 2025-07-30 | 13F | Insight Advisors, LLC/ PA | 39,171 | -0.65 | 1,277 | 9.81 | ||||
| 2025-06-27 | NP | TRTY - Cambria Trinity ETF | 69,280 | 2,161 | ||||||
| 2025-07-21 | 13F | DHJJ Financial Advisors, Ltd. | 10 | 0 | ||||||
| 2025-08-08 | 13F | Davies Financial Advisors, Inc. | 16,929 | -11.03 | 552 | -1.78 | ||||
| 2025-07-24 | 13F | VanderPol Investments L.L.C. | 38,865 | 1,267 | ||||||
| 2025-08-14 | 13F | Jane Street Group, Llc | 148,387 | 160.48 | 4,836 | 187.97 | ||||
| 2025-08-05 | 13F | NewSquare Capital LLC | 235,831 | 7,686 | ||||||
| 2025-08-12 | 13F | Steward Partners Investment Advisory, Llc | 23,192 | 71.45 | 756 | 89.70 | ||||
| 2025-08-19 | 13F | Newbridge Financial Services Group, Inc. | 62 | 0.00 | 2 | 100.00 | ||||
| 2025-07-17 | 13F | Sound Income Strategies, LLC | 5,921 | 65,688.89 | 193 | |||||
| 2025-08-11 | 13F | Nomura Asset Management Co Ltd | 22,351 | 69.60 | 728 | 87.63 | ||||
| 2025-07-31 | 13F | TSA Wealth Managment LLC | 6,302 | 205 | ||||||
| 2025-08-04 | 13F | Integrity Alliance, Llc. | 10,074 | 328 | ||||||
| 2025-08-01 | 13F | Austin Private Wealth, LLC | 6,534 | 213 | ||||||
| 2025-08-14 | 13F | Stifel Financial Corp | 6,874 | 224 | ||||||
| 2025-08-01 | 13F | Envestnet Asset Management Inc | 66,231 | 175.02 | 2,158 | 203.94 | ||||
| 2025-08-05 | 13F | GPS Wealth Strategies Group, LLC | 502 | 16 | ||||||
| 2025-08-14 | 13F | Destination Wealth Management | 8,531 | 278 | ||||||
| 2025-08-14 | 13F | Raymond James Financial Inc | 38,105 | 1,242 | ||||||
| 2025-08-28 | NP | TFAFX - Tactical Growth Allocation Fund Class I | 10,083 | 24.48 | 329 | 32.79 | ||||
| 2025-07-24 | 13F | IFP Advisors, Inc | 2,702 | 7,405.56 | 88 | 8,700.00 | ||||
| 2025-05-12 | 13F | Citigroup Inc | 0 | -100.00 | 0 | |||||
| 2025-08-26 | NP | LCR - Leuthold Core ETF | 22,920 | -7.12 | 747 | 2.61 | ||||
| 2025-08-05 | 13F | Milestone Asset Management, Llc | 15,772 | 514 | ||||||
| 2025-08-13 | 13F | First Trust Advisors Lp | 54,007 | 1,760 | ||||||
| 2025-08-14 | 13F/A | Bank Julius Baer & Co. Ltd, Zurich | 38,911 | 20.49 | 1,268 | 17.84 | ||||
| 2025-08-13 | 13F | Vance Wealth, Inc. | 6,387 | 208 | ||||||
| 2025-04-22 | 13F | Castleview Partners, Llc | 0 | -100.00 | 0 | -100.00 | ||||
| 2025-08-01 | 13F | Brookwood Investment Group LLC | 13,851 | 451 | ||||||
| 2025-08-12 | 13F | Jpmorgan Chase & Co | 46,327 | -6.40 | 1,510 | 3.43 | ||||
| 2025-08-14 | 13F | Goldman Sachs Group Inc | 47,625 | 1,552 | ||||||
| 2025-08-14 | 13F | Federation des caisses Desjardins du Quebec | 225 | 0.00 | 7 | 16.67 | ||||
| 2025-05-13 | 13F | Bank Of Montreal /can/ | 0 | -100.00 | 0 | |||||
| 2025-07-21 | 13F | Ameritas Advisory Services, LLC | 6,141 | 200 | ||||||
| 2025-08-12 | 13F | Ameritas Investment Partners, Inc. | 234,433 | 3.20 | 7,640 | 14.05 | ||||
| 2025-05-08 | 13F | Plante Moran Financial Advisors, LLC | 0 | -100.00 | 0 | |||||
| 2025-04-17 | 13F | Janney Montgomery Scott LLC | 0 | -100.00 | 0 | |||||
| 2025-07-21 | 13F | Synergy Financial Management, LLC | 117,248 | 3,821 | ||||||
| 2025-08-14 | 13F | UBS Group AG | 12,032 | 60.36 | 392 | 77.38 | ||||
| 2025-08-28 | NP | NDOW - Anydrus Advantage ETF | 25,970 | 18.41 | 846 | 30.96 | ||||
| 2025-08-04 | 13F | AMG National Trust Bank | 13,527 | 31.55 | 441 | 45.21 | ||||
| 2025-08-14 | 13F | Transamerica Financial Advisors, Inc. | 27,146 | 20,008.15 | 885 | |||||
| 2025-07-09 | 13F | Breakwater Investment Management | 248 | 0.00 | 8 | 14.29 | ||||
| 2025-07-16 | 13F | Cambridge Advisors Inc. | 10,400 | 0.00 | 339 | 10.46 | ||||
| 2025-08-11 | 13F | HighTower Advisors, LLC | 61,653 | 774.26 | 2,009 | 870.53 | ||||
| 2025-08-13 | 13F | Rsm Us Wealth Management Llc | 6,326 | 206 | ||||||
| 2025-07-31 | 13F | Brighton Jones Llc | 9,151 | 298 | ||||||
| 2025-08-07 | 13F | Allworth Financial LP | 1,342 | 67,000.00 | 44 | |||||
| 2025-07-28 | 13F | Harbour Investments, Inc. | 458 | 11.17 | 15 | 16.67 | ||||
| 2025-08-13 | 13F | Leuthold Group, Llc | 256,592 | 86.91 | 8,362 | 106.57 | ||||
| 2025-08-15 | 13F | Tower Research Capital LLC (TRC) | 0 | -100.00 | 0 | |||||
| 2025-07-31 | 13F | Glass Jacobson Investment Advisors llc | 0 | -100.00 | 0 | -100.00 | ||||
| 2025-08-13 | 13F | Guggenheim Capital Llc | 83,171 | 0.13 | 2,711 | 10.66 | ||||
| 2025-08-12 | 13F | Proequities, Inc. | 0 | 0 | ||||||
| 2025-06-27 | NP | GMOM - Cambria Global Momentum ETF | 198,563 | 6,193 | ||||||
| 2025-08-08 | 13F | Foundations Investment Advisors, LLC | 74,608 | 2,431 | ||||||
| 2025-07-09 | 13F | Client First Investment Management LLC | 24,513 | 799 | ||||||
| 2025-07-14 | 13F | AdvisorNet Financial, Inc | 2,185 | 0.00 | 71 | 10.94 | ||||
| 2025-08-18 | 13F | N.E.W. Advisory Services LLC | 0 | -100.00 | 0 | |||||
| 2025-08-12 | 13F | Pathstone Holdings, LLC | 11,010 | 359 | ||||||
| 2025-08-13 | 13F | Cambria Investment Management, L.P. | 267,843 | 8,712 | ||||||
| 2025-04-22 | 13F/A | NorthRock Partners, LLC | 0 | -100.00 | 0 | -100.00 | ||||
| 2025-07-21 | 13F | Pflug Koory, LLC | 163 | 0.00 | 5 | 25.00 | ||||
| 2025-09-04 | 13F/A | Advisor Group Holdings, Inc. | 27,330 | 65.21 | 891 | 82.75 | ||||
| 2025-07-24 | 13F | Mainstay Capital Management Llc /adv | 3,413,828 | 111,257 | ||||||
| 2025-08-26 | NP | FIRST TRUST VARIABLE INSURANCE TRUST - First Trust Dorsey Wright Tactical Core Portfolio Class I This fund is a listed as child fund of First Trust Advisors Lp and if that institution has disclosed ownership in this security, then these positions will not be double counted when calculating total shares and total value | 54,007 | 1,760 | ||||||
| 2025-08-13 | 13F | Baird Financial Group, Inc. | 24,071 | 784 | ||||||
| 2025-08-26 | NP | LCORX - Leuthold Core Investment Fund Retail Class | 97,222 | 3,168 | ||||||
| 2025-08-08 | 13F | Kingsview Wealth Management, LLC | 7,295 | 238 | ||||||
| 2025-08-15 | 13F | Urban Financial Advisory Corp | 891 | 0.56 | 29 | 11.54 | ||||
| 2025-08-08 | 13F | Cetera Investment Advisers | 11,998 | -5.83 | 391 | 4.27 | ||||
| 2025-05-02 | 13F | Transcendent Capital Group LLC | 0 | -100.00 | 0 | |||||
| 2025-08-14 | 13F | Bank Of America Corp /de/ | 128,864 | -40.45 | 4,200 | -34.20 | ||||
| 2025-08-26 | NP | GLBIX - Leuthold Global Fund Institutional Class | 4,949 | 161 | ||||||
| 2025-08-11 | 13F | Sykon Capital Llc | 170,004 | 336.08 | 5,540 | 382.16 | ||||
| 2025-08-12 | 13F | LPL Financial LLC | 144,021 | 73.47 | 4,694 | 91.71 | ||||
| 2025-08-14 | 13F | Great Valley Advisor Group, Inc. | 83,316 | 2,715 | ||||||
| 2025-08-14 | 13F | State Street Corp | 181,850 | -1.22 | 5,926 | 9.15 | ||||
| 2025-08-11 | 13F | Independent Advisor Alliance | 7,472 | 244 | ||||||
| 2025-07-16 | 13F | MJT & Associates Financial Advisory Group, Inc. | 0 | -100.00 | 0 | |||||
| 2025-07-31 | 13F | Hobart Private Capital, LLC | 141,731 | 4,619 | ||||||
| 2025-08-13 | 13F | Beacon Pointe Advisors, LLC | 20,401 | 3.16 | 665 | 13.89 | ||||
| 2025-04-16 | 13F | BTS Asset Management, Inc. | 0 | -100.00 | 0 | |||||
| 2025-08-13 | 13F | F/M Investments LLC | 35,676 | 0.00 | 1,163 | 10.67 | ||||
| 2025-08-12 | 13F | MAI Capital Management | 4,743 | -4.03 | 155 | 6.21 | ||||
| 2025-08-04 | 13F | Haven Private, LLC | 26,289 | 25.47 | 857 | 38.74 | ||||
| 2025-08-07 | 13F | Rathbone Brothers plc | 139,938 | 26.84 | 4,561 | 40.18 | ||||
| 2025-08-28 | NP | GAL - SPDR SSGA Global Allocation ETF This fund is a listed as child fund of State Street Corp and if that institution has disclosed ownership in this security, then these positions will not be double counted when calculating total shares and total value | 242,543 | -2.11 | 7,904 | 8.19 | ||||
| 2025-07-03 | 13F | Lam Group, Inc. | 228,190 | 70.38 | 7,437 | 88.30 | ||||
| 2025-07-30 | 13F | Patten Group, Inc. | 10,071 | 328 | ||||||
| 2025-08-07 | 13F | Montag A & Associates Inc | 1,608 | 0.00 | 52 | 10.64 | ||||
| 2025-04-23 | 13F | Creative Financial Designs Inc /adv | 0 | -100.00 | 0 | |||||
| 2025-07-15 | 13F | Retireful, LLC | 25,970 | 846 | ||||||
| 2025-08-14 | 13F | Royal Bank Of Canada | 133,165 | 48.69 | 4,340 | 64.33 | ||||
| 2025-05-14 | 13F | Kestra Advisory Services, LLC | 0 | -100.00 | 0 | -100.00 | ||||
| 2025-08-14 | 13F | Sunbelt Securities, Inc. | 494 | 0.00 | 14 | 0.00 | ||||
| 2025-08-19 | 13F | Cape Investment Advisory, Inc. | 50 | 0.00 | 2 | 0.00 | ||||
| 2025-07-25 | 13F | Lodestar Private Asset Management Llc | 409,110 | 17.02 | 13,333 | 29.31 | ||||
| 2025-08-15 | 13F | Morgan Stanley | 201,422 | 29.02 | 6,564 | 42.60 | ||||
| 2025-08-19 | 13F | Advisory Services Network, LLC | 11,706 | 369 | ||||||
| 2025-07-21 | 13F | Financial Services Advisory Inc | 9,881 | 322 | ||||||
| 2025-08-06 | 13F | AE Wealth Management LLC | 61,433 | 40.79 | 2,002 | 55.68 | ||||
| 2025-08-13 | 13F | Congress Wealth Management LLC / DE / | 9,548 | -1.88 | 311 | 8.74 | ||||
| 2025-08-14 | 13F | Wells Fargo & Company/mn | 129,398 | 704.81 | 4,217 | 789.66 | ||||
| 2025-08-12 | 13F | Global Retirement Partners, LLC | 28,434 | 927 | ||||||
| 2025-08-01 | 13F | Red Lighthouse Investment Management, Llc | 3,731 | -49.16 | 122 | -43.19 | ||||
| 2025-08-18 | 13F/A | National Bank Of Canada /fi/ | 460 | 0.00 | 15 | 7.69 | ||||
| 2025-07-18 | 13F | PFG Investments, LLC | 13,376 | 436 | ||||||
| 2025-08-08 | 13F | Omega Financial Group, LLC | 16,391 | -15.08 | 534 | -6.15 | ||||
| 2025-05-15 | 13F | Citadel Advisors Llc | 0 | -100.00 | 0 | |||||
| 2025-07-08 | 13F | Strategic Advocates LLC | 12,020 | -0.77 | 392 | 9.52 | ||||
| 2025-08-14 | 13F | GWM Advisors LLC | 4,581 | -48.41 | 149 | -42.91 | ||||
| 2025-07-10 | 13F | Redhawk Wealth Advisors, Inc. | 344,874 | 11,239 | ||||||
| 2025-07-31 | 13F | Cambridge Investment Research Advisors, Inc. | 51,011 | 151.31 | 2 | |||||
| 2025-07-30 | 13F | D.a. Davidson & Co. | 16,476 | 537 | ||||||
| 2025-08-18 | 13F | Geneos Wealth Management Inc. | 1,500 | 0.00 | 49 | 9.09 | ||||
| 2025-07-22 | 13F | Checchi Capital Advisers, LLC | 649,084 | -42.87 | 21,154 | -36.86 | ||||
| 2025-05-02 | 13F | Capital A Wealth Management, LLC | 0 | -100.00 | 0 | |||||
| 2025-07-29 | 13F | International Assets Investment Management, Llc | 7,160 | 233 | ||||||
| 2025-08-08 | 13F | Good Life Advisors, LLC | 61,061 | 1,990 | ||||||
| 2025-08-13 | 13F | Idaho Trust Bank | 155,668 | 19.13 | 5,073 | 31.70 | ||||
| 2025-08-13 | 13F | Jones Financial Companies Lllp | 840 | -26.51 | 27 | -18.18 | ||||
| 2025-08-14 | 13F | Mml Investors Services, Llc | 25,790 | 1 | ||||||
| 2025-08-14 | 13F | Fmr Llc | 31 | 210.00 | 1 | |||||
| 2025-08-28 | NP | TFAZX - TFA Tactical Income Fund Class I | 25,931 | -11.78 | 845 | -6.01 | ||||
| 2025-08-14 | 13F | Obsido Oy | 113,055 | -3.73 | 3,684 | 6.38 | ||||
| 2025-08-07 | 13F | LFA - Lugano Financial Advisors SA | 124,430 | 4,038 | ||||||
| 2025-05-14 | 13F | Flow Traders U.s. Llc | 0 | -100.00 | 0 | |||||
| 2025-08-13 | 13F | Fisher Asset Management, LLC | 46,234 | 0.08 | 1,507 | 10.57 | ||||
| 2025-08-14 | 13F | Gerber Kawasaki Wealth & Investment Management | 18,425 | 600 |